Advances in Breast Cancer Research
Vol.1 No.2(2012), Article ID:21276,8 pages DOI:10.4236/abcr.2012.12003
Differential Expression of Genes Involved in Cell Polarity, EMT and Cell-Fate in Breast Cancer and Corresponding Normal Tissue
1Department of Clinical and Community Health Sciences, Medical Statistics, Biometry and Bioinformatics, University of Milano, Milano, Italy
2Senology Center, Casa di Cura Ambrosiana, Istituto Sacra Famiglia, Cesano Boscone, Milano, Italy
Email: danila.coradini@yahoo.it
Received May 10, 2012; revised June 20, 2012; accepted July 13, 2012
Keywords: breast cancer; cell-fate decision; cell polarity; epithelial-mesenchymal transition; histologically normal tissue
ABSTRACT
Objectives: Cell polarity and epithelial morphology are peculiar features of cells forming the terminal ductal lobular unit, and they are early lost during neoplastic transformation because of an epithelial-mesenchymal transition (EMT). To understand these early events we analyzed a set of 125 genes related to cell polarity, EMT and cell-fate decision in 26 breast cancer specimens and corresponding patient-matched normal tissue. Methods: The difference of gene expression was explored by t-paired test. In addition, to evidence latent variables accounting for genes correlations, a Factor Analysis was applied as exploratory technique. Results: Among the 90 differentially expressed genes, those coding for cell‑polarity complexes, apical-junctional components and luminal cytokeratins were overexpressed in tumor samples (suggesting a terminally differentiated phenotype) whereas those coding for stemness-associated features or related with EMT were expressed in normal tissues but not in tumor samples, suggesting the persistence of stem/progenitor cells. Factor analysis confirmed these findings and indicated that the difference between tumors and normal tissues can be synthesized in three main features representative of specific molecular/morphological alterations. Conclusions: The a priori definition of a selected panel of genes and the application of an exploratory statistical approach, greatly contribute to reduce the intrinsic biological complexity of tumor specimens and to describe the difference between tumor specimens and corresponding histologically normal tissues.
1. Introduction
Breast cancer is a biologically heterogeneous disease arising at the terminal ductal lobular units of the mammary gland. According to the widely accepted model of breast cancer progression, normal epithelial cells of the terminal ductal lobular unit acquire increasingly aberrant molecular and morphological abnormalities, resulting in different subtypes of invasive cancer [1].
To better understand breast cancer biology we focused on a peculiar feature of cells forming the terminal ductal lobular unit: cell polarity. Indeed, epithelial mammary cells are characterized by an asymmetric distribution of cytoplasmic and membrane proteins, termed apico-basolateral cell polarity that is essential to maintain the normal tissue specificity and a correct directional secretion of milk into the lumen [2]. During neoplastic transformation, cell polarity and epithelial morphology are early lost because of an epithelial-mesenchymal transition (EMT). Physiologically activated during embryo development, EMT is a process in which polarized epithelial cells, generally organized in cells layers, convert into single fibroblastoid cells characterized by a reduced cell-cell adhesion, loss of apico-basolateral polarity and epithelial markers, and by the acquisition of motility, spindle-cell shape and mesenchymal markers [3,4]. Recently, EMT activation has been proposed for the generation of cells with stem-like features including selfrenewal ability [5,6]. Such a hypothesis has fuelled the exciting suspect that the disruption of the mechanisms deputed to cell polarity control should somehow be involved in the emergence of the so-called tumor initiating cells. Due to the acquired stem-like features, these cells should be able of reinitiating growth and form distant metastases with relevant clinical implications in terms of prognosis and responsiveness to therapy [7,8]. Given the relation between EMT and loss of cell polarity, and the proposed hypothesis that EMT may generate cell with stem cells properties, we investigated the pattern of expression of a selected set of genes related to cell polarity, EMT, and cell-fate decision. To this aim, we interrogated a previously published microarray dataset consisting of 26 primary breast cancers with a patientmatched histologically normal tissue, concomitantly taken from the clinically free of tumor ipsilateral mammary gland [9].
2. Materials and Methods
2.1. Genes Set Selection
As reported in the original paper [9] specimens gene expression profile was determined by using the Affymetrix Human Genome HG-U133 Plus 2.0 GeneChip, and microarray dataset was available at the ArrayExpress web site (http://www.ebi.ac.uk/arrayexpress/), with the accession number E-GEOD-10810. Combining Gene Ontology (http://www.geneontology.org) and PubMed (http:// www.ncbi.nlm.nih.gov) information about the genes related with cell polarity, EMT and cell-fate decision, a set of 165 genes evolutionarily conserved in Homo sapiens was established. This genes set corresponded to 404 Affymetrix probe-sets, as verified by GeneAnnot system v2.0 (http://bioinfo2.weizmann.ac.il/geneannot/), that additionally provides information about the quality of each probe-set in terms of sensitivity and specificity score [10]. Since in the original dataset, several gene expression values were discarded because of background correction and quantile normalization, the final genes set was actually composed of 125 elements (Supplementary Table 1), 64 of which are involved in cell polarity and apical junction assembly [11,12], 24 in EMT activation [3,4], 16 in cell fate-decision and in the maintenance of a self-renewal state in tumorigenic adult tissues [13,14] and 21 are clinically relevant for breast cancer management (ESR1, PGR, ERBB2, TP53) [15,16] or involved in estrogen signaling (MTA3, NCOA1) [17], angiogenesis activation (HIF1A, VEGFA, VEGFB and VEGFC) [18,20] or used as luminal (GATA3, KRT7, KRT8, KRT18, KRT19) and basal (EGFR, KRT5, KRT6B, KRT14, KRT17, VIM) phenotype markers [21-25]. These 125 genes corresponded to 220 probe-sets.
2.2. Statistical Analysis
As some genes were recognized by more than a single probe-set, each of which characterized by an individual specificity and sensitivity that differently contribute to gene expression value, a gene expression mean value was calculated after weighting each probe-set for its own sensitivity and specificity score. Specifically, each expression value (already log2-transformed in the original dataset) was multiplied for the semi-sum of sensitivity and specificity scores of the corresponding probe-set. Given the patient-matched samples study design, all statistical analyses were performed considering the difference of gene expression between tumor and corresponding noncancerous adjacent tissue as a new variable. The difference of gene expression was explored by t-paired test. To correct for multiple testing, the false discovery rate (FDR) was estimated [26] and an estimated FDR < 0.01 was considered statistically significant. To evidence latent variables accounting for genes correlations, a Factor Analysis was applied as exploratory technique [27]. The number of retained factors was selected according to the scree test [28]. To facilitate the interpretation of the factors, Varimax rotation was applied. Loading values lower than 0.3 were not considered. All analyses were performed using open source software R 2.11.1 packages HDMD (http://www.R-project.org).
3. Results
To evaluate the impact of the selected genes in distinguishing tumor from the corresponding histologically normal tissue with respect to non-selected genes, we ranked the overall probe-sets group according to t-paired test on the whole 18382 probe-sets available and computed the FDR. One hundred and forty-five out of the 220 selected probe-sets had an FDR < 0.01 and ranked among the first 9600 probe-sets. Statistical analysis indicated that 90 of 125 selected genes were differentially expressed between tumors and corresponding histologically normal tissues with an estimated FDR < 0.01. Of the differentially expressed genes, 42 (47%) were overexpressed (Table 1). Among them we found ESR1, coding for ER; KRT8, KRT18, and KRT19, all coding for luminal cytokeratins; GATA3, coding for a transcription factor involved in the mammary gland morphogenesis; CD24, coding for a surface marker expressed by welldifferentiated mammary cells. Consistent with a luminal differentiated phenotype, we also found overexpressed CDH1, coding for E-cadherin, many genes involved in the maintenance of a correct cell polarity (CRB3, DLG3, INADL, LLGL2, MLLT4, PARD6B, PRKCZ, PRKCI and SCRIB) and several genes coding for structural components of tight (CGN, CLDN1, CLDN3, CLDN4, CLDN7, CLDN12, CXADR, F11R, MAGI3, MARVELD2, OCLN and TJP3) and adherens junctions (CADM1, JUP, PFN1, PFN2, PVRL2, PVRL4). Additionally, we found as differentially overexpressed: BMI-1, coding for a component of the polycomb repressive complex required to maintain the transcriptionally repressive state of many genes; CDC42, coding for a GTPase family member involved in epithelial cell polarization processes; MTA3, which product plays a role in maintenance of the normal
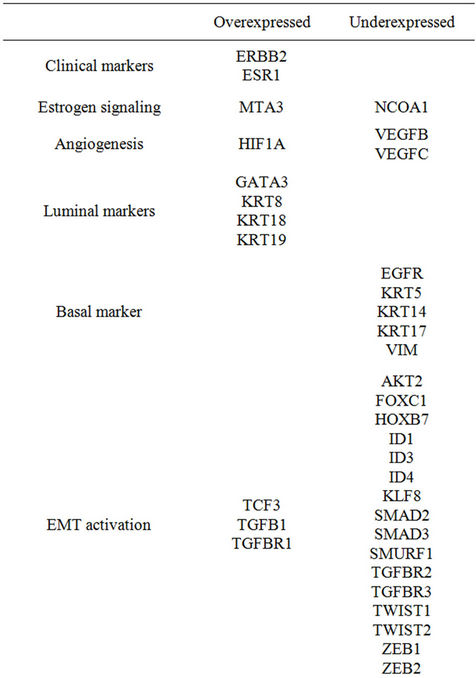
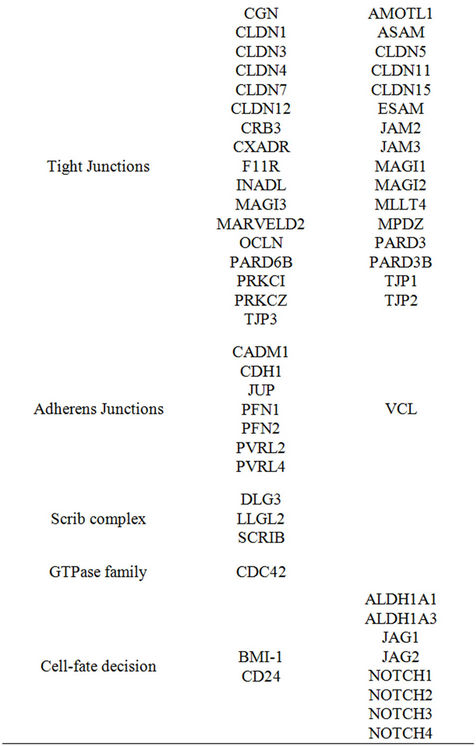
Table 1. Genes differentially expressed with respect to corresponding histologically normal tissue (Estimated FDR < 0.01).
epithelial architectures; TGFB1, coding for transforming growth factor-β (TGF-β), known for its antiproliferative effects; TGFBR1, coding for type I TGF-β receptor; ERBB2, coding for ErbB2/neu. Conversely, among the 48 underexpressed genes, we found those coding for basal markers (EGFR, KRT5, KRT14, KRT17 and VIM), many genes associated with EMT (AKT2, FOXC1, HOXB7, ID1, ID3, ID4, KLF8, SMAD2, SMAD3, SMURF1, TGFBR2, TGFBR3, TWIST1, TWIST2, ZEB1 and ZEB2) or cell-fate decision (ALDH1A1, ALDH1A3, JAG1, JAG2, NOTCH1, NOTCH2, NOTCH3, NOTCH4). Notably, according to the inverse relation between differentiation and tumor aggressiveness we found as underexpressed the genes involved in endothelium proliferation (ASAM, ESAM, JAM2, JAM3, VEGFB and VEGFC).
When we applied a factor analysis to investigate the latent variables intrinsically associated with the 125 genes, three factors were retained according to the scree plot. Genes associated with the epithelial phenotype principally characterized the first factor (Figure 1). In fact, among the genes with a positive loading value we found those coding for tight (CGN, CLDN1, cldn3, CLDN4, CLDN7, CLDN8, CLDN12, CXADR, MARVELD2 and OCLN) and adherens (CDH1, CDH3, CTNND1, JUP and MLLT4) junction components, cell polarity complexes (DLG3, DLG5, INADL, LLGL2, PRKCI and PRKCZ) and coding for a surface marker specifically expressed by well-differentiated mammary (CD24). The concomitant presence of luminal (GATA3, KRT7, KRT8, KRT18 and KRT19) and basal (KRT5, KRT14 and KRT17) markers clearly suggests the coexistence, in tumor specimens, of luminal and myoepithelial cells. Notably, among the genes with a negative loading value we found ASAM, ESAM, and VEGFB (all involved in endothelial cell proliferation), NOTCH1 and NOTCH4 (associated with cell-fate decision), and AKT2 and TWIST2 (involved in EMT).
The second factor (Figure 2) was characterized by genes associated with EMT. In fact, among the genes with a positive loading value we found ID3, ID4, SMAD3, SNAI2, TGFBR2, TWIST1, TWIST2, ZEB1, and ZEB2, all involved in the activation of EMT via the canonical TGF-β pathway. Such a transition towards a more aggressive mesenchymal phenotype is supported by the
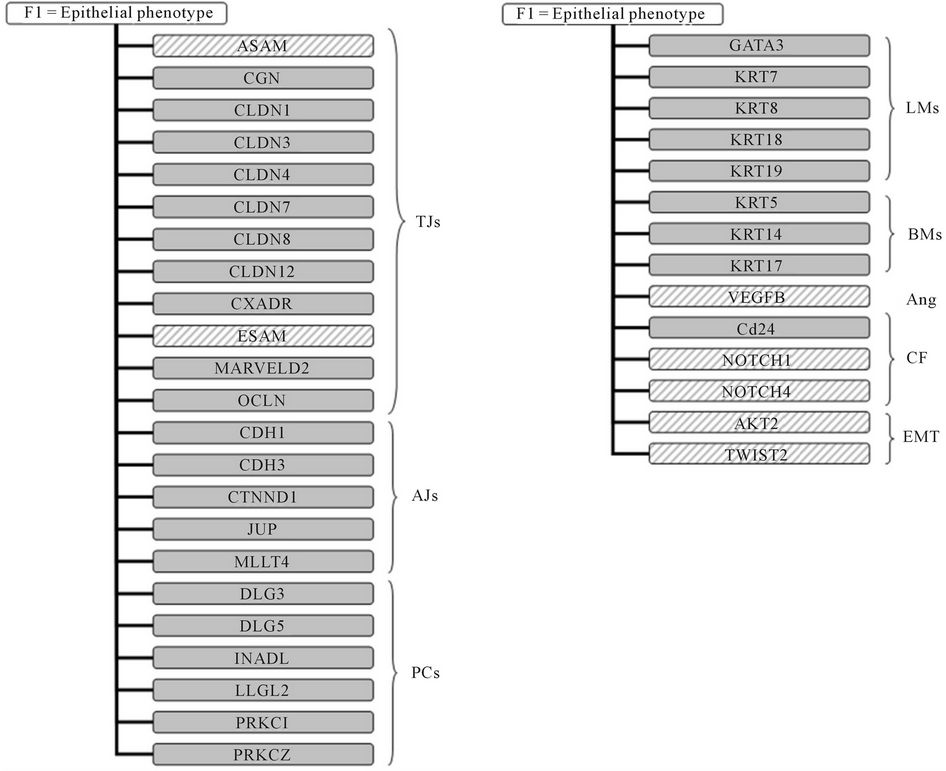
Figure 1. Factor analysis. Schematic representation of genes characterizing the first factor and principally associated with epithelial phenotype. Solid color indicates a positive loading value whereas dashed color indicates a negative loading value. TJs, tight junction components; AJs, adherens junction components; PCs, polarity complexes components; Ang, angiogenesis; CF, cell-fate decision; LMs, luminal markers; BMs, basal markers; EMT, epithelial-mesenchymal transition.
presence of VIM coding for vimentin, a typical mesenchymal marker, and by the presence of genes involved in endothelial cells proliferation (AMOTL1, JAM2, JAM3 and VEGFC) or cell-fate decision (ALDH1A1, ALDH1A3, JAG1, JAG2, NOTCH2, NOTCH3, NUMB).
Finally, the third factor (Figure 2) was principally characterized by genes associated with a terminal luminal differentiation of the tumor. In fact, among the genes with a positive loading value, in addition to those coding for the apical-junctional complex (MAGI2, MAGI3 MARVELD2 and OCLN) and polarity complexes (DLG1, DLG5, INADL, LLGL2, PARD3B and PARD6B), we found genes associated with an estrogen-dependent phenotype (ESR1, GATA3, and PGR) that provided a more specific characterization of tumor specimens with respect to the “generic” epithelial phenotype described by the first factor. According to the terminal luminal differenttiation, we found the negative loading value of EGFR gene, whose expression is generally negatively associated with that of ESR1. Furthermore, in agreement with the positive role played by TGF-β in mammary gland development, we found several genes (SMAD2, SMAD3, SMAD4 and TWIST1) coding for transcription factors involved in the canonical TGF-β pathway.
4. Discussion
In the original paper, Pedraza et al. [9] performed largescale transcription profiling on 58 breast cancer specimens, 52 of which corresponding to 26 patient-matched samples. Using significance analysis of microarrays [29], they found 8088 differentially expressed sequences between tumor and corresponding histologically normal tissue, most of which coding for proteins with “binding activity” and involved in various and no better-specified “metabolic processes”. To better understand tumor biology, in the present study, we considered only the 26

Figure 2. Factor analysis. Schematic representation of genes characterizing second and third factors. Second factor (on the left) is principally associated with epithelial-mesenchymal transition (EMT). Third factor (on the right) is principally associated with luminal differentiation. Solid color indicates a positive loading value whereas dashed color indicates a negative loading value. TJs, tight junction components; AJs, adherens junction components; PCs, polarity complexes components; Ang, angiogenesis; CF, cell-fate decision; LMs, luminal markers; BMs, basal markers; EMT, epithelial-mesenchymal transition.
patient-matched samples and we investigated a selected set of genes involved in cell polarity and apical junction assembly [11,12], EMT activation [3,4] cell fate-decision and maintenance of a self-renewal state in tumorigenic adult tissues [13,14]. Our results indicated that 72% of the selected 125 genes were differentially expressed between tumor and corresponding histologically normal tissue with an estimated FDR < 0.01. In particular, we found overexpressed the genes associated with a welldifferentiated luminal phenotype; complementally we found underexpressed those associated with a basal phenotype, EMT activation or stemness-like morphology. With respect to the corresponding histologically normal tissue, tumor samples differentially overexpressed also the genes coding for estrogen receptor and for the regulators of cellular polarity and adhesion. Conversely, histologically normal tissues expressed the genes coding for some transcription factors involved in EMT and stemness-associated features. Such an apparently paradoxical finding, i.e., the positive association between histologically normal tissues and EMTand stemness-related genes (more likely expected in neoplastic samples) is not a peculiar feature of breast epithelium since we recently observed a similar behavior in normal pleura with respect to pleural mesothelioma [30]. On the contrary, it suggests, in agreement with the physiological remodeling of the mammary gland, the presence of resident stem/progenitor cells in normal tissue [31,32]. Under this light, is not surprising the expression, in normal tissues, of ALDH1A and its paralog ALDH1A3, both coding for proteins recently identified as putative stem-cell markers in several tissue including mammary gland [33]. Similarly, is not surprising the expression of JAG1 and its paralog JAG2, as well as of Notch family members (NOTCH1, NOTCH2, NOTCH3 and NOTCH4) considering the critical role that they play in cell-fate decision in forcing normal mammary stem cells to stay in an undifferentiated state [34,35]. The hypothesis is further corroborated by the underexpression of BMI-1 and CD24. In fact, BMI-1 codes for a member of Polycomb group required to maintain the transcriptionally repressive state of many genes throughout embryo development [36] and adult tissues differentiation including mammary gland [37], whereas CD24 codes for a mucin-like cell-adhesion molecule positively associated with a terminally differentiated luminal phenotype, exploited to isolate breast cancer cells with stem/progenitor cell properties [38,39].
Normal mammary gland development and differentiation imply tissue remodeling. Therefore, the expression, in histologically normal samples, of genes involved in EMT and, in particular, the panel of genes related to TGF-β signaling pathway is not at all surprising. TGF-β, in fact, is the recognized major inducer of EMT during embryogenesis and cancer progression [40,41]. According to the conventional model, TGF-β binds to a heteromeric complex formed by type I and type II receptors and leads to the activation of Smad2 and Smad3 that, after forming a trimer with Smad4, translocate to the nucleus where they bind to Smad-binding elements and activate/repress a plethora of target genes. Through Snail, ZEB and bHLH transcription factors the Smad complex represses the expression of several epithelial markers, including claudins, ZOs proteins, occludin, E-cadherin and cytokeratins, and induces the expression of mesenchymal markers including N-cadherin, fibronectin and vitronectin. Consistent with such a model, in normal tissue we found expressed genes coding for TGF-β receptors (TGFBR2 and TGFBR3), Smad proteins (SMAD2 and SMAD3), ZEB (ZEB1 and ZEB2) and bHLH (TWIST1, TWIST2, ID1, ID3 and ID4) transcription factor family members. Concomitantly, we found underexpressed all genes coding for epithelial markers. In agreement with recent acquisition providing evidence of a negative transcriptional regulation of CD24 expression by Twist [42] we also found a negative association between TWIST1/TWIST2 and CD24 expression as well as a negative association between TWIST1/TWIST2 and CDH1, the gene coding for E-cadherin [43]. The observation that in tumor samples TGFB1 and TGFBR1 genes, coding respectively for TGF-β and its type I receptor, were differentially overexpressed, can be explained by considering the well-known dual role of TGF-β that, in addition to its tumor promoter activity, has provided to be a potent inhibitor of epithelial cell proliferation and able to maintain tissue homeostasis [44,45]. Consistently, we found overexpressed all genes associated with a well-differentiated luminal phenotype including ESR1, in agreement with the notion that ERα and TGF-β signaling pathways are major regulators during mammary gland development [46]. Factor analysis corroborated this hypothesis providing evidence that one of latent variables accounting for genes correlations (namely, factor 3) included genes associated with an estrogen-dependent phenotype and several genes coding for transcription factors involved in the canonical TGF-β pathway. Interestingly, factor analysis clearly indicated that many genes, selected for this study, provided redundant information (as in the case of CLDN3 and CLDN4, CDH1 and CHD3, KRT5, KRT6B, KRT7, KRT8 and KRT18, KRT14 and KRT17, MARVELD2 and OCLN). In addition, it indicated that the difference between tumor specimens and corresponding histologically normal tissues are synthesizable in few main features representative of specific molecular and morphological alterations occurring during neoplastic transformation, thus suggesting the application of this statistical approach to reduce, at least partially, the intrinsic biological complexity of tumor specimens.
REFERENCES
- T. Sørlie, C. M. Perou, R. Tibshirani, et al., “Gene Expression Patterns of Breast Carcinomas Distinguish Tumor Subclasses with Clinical Implications,” Proceeding of the National Academy of Sciences of the United States of America, Vol. 98, No. 19, 2001, pp. 10869-10874.
- F. Martin-Belmonte and K. Mostov, “Regulation of Cell Polarity during Epithelial Morphogenesis,” Current Opinions in Cell Biology, Vol. 20, No. 2, 2008, pp. 227-234. doi:10.1016/j.ceb.2008.01.001
- D. S. Micalizzi and H. L. Ford, “Epithelial-Mesenchymal Transition in Development and Cancer,” Future in Oncology, Vol. 5, No. 8, 2009, pp. 1129-1143. doi:10.2217/fon.09.94
- G. Moreno-Bueno, F. Portillo and A. Cano, “Transcriptional Regulation of Cell Polarity in EMT and Cancer,” Oncogene, Vol. 27, No. 55, 2008, pp. 6958-6969. doi:10.1038/onc.2008.346
- D. C. Radisky and M. A. LaBarge, “Epithelial-Mesenchymal Transition and the Stem Cell Phenotype,” Cell Stem Cell, Vol. 2, No. 6, 2008, pp. 511-512. doi:10.1016/j.stem.2008.05.007
- A.-P. Morel, M. Lièvre, C. Thomas, G. Hinkal, S. Ansieau and A. Puisieuxet, “Generation of Breast Cancer Stem Cells through Epithelial-Mesenchymal Transition,” PLoS ONE, Vol. 3, No. 8, 2008, Article No. e2888. doi:10.1371/journal.pone.0002888
- M. E. Sehl, J. S. Sinsheimer, H. Zhou and K. L. Lange, “Differential Destruction of Stem Cells: Implications for Targeted Cancer Stem Cell Therapy,” Cancer Research, Vol. 69, No. 24, 2009, pp. 9481-9489. doi:10.1158/0008-5472.CAN-09-2070
- C. S. O’Brien, S. J. Howell, G. Farnie and R. B. Clarke, “Resistance to Endocrine Therapy: Are Breast Cancer Stem Cells the Culprits?” Journal of Mammary Gland Biology and Neoplasia, Vol. 14, No. 1, 2009, pp. 45-54. doi:10.1007/s10911-009-9115-y
- V. Pedraza, J. A. Gomez-Capilla, G. Escaramis, et al., “Gene Expression Signature in Breast Cancer Distinguish Subtypes and Tumor Invasiveness,” Cancer, Vol. 116, No. 2, 2010, pp. 486-496. doi:10.1002/cncr.24805
- F. Ferrari, S. Bortoluzzi, A. Coppe, et al., “Novel Definition Files for Human GeneChips Based on GeneAnnot,” BMC Bioinformatics, Vol. 8, 2007, Article No. 446. doi:10.1186/1471-2105-8-446
- A. Wodarz and I. Näthke, “Cell Polarity in Development and Cancer,” Nature Cell Biology, Vol. 9, No. 9, 2007, pp. 1016-1024. doi:10.1038/ncb433
- F. Martin-Belmonte and K. Mostov, “Regulation of Cell Polarity during Epithelial Morphogenesis,” Current Opinions in Cell Biology, Vol. 20, No. 2, 2008, pp. 227-234. doi:10.1016/j.ceb.2008.01.001
- A. Lugli, G. Iezzi, I. Hostettler, et al., “Prognostic Impact of the Expression of Putative Cancer Stem Cell Markers CD133, CD166, CD44s, EpCAM, and ALDH1 in Colorectal Cancer,” British Journal of Cancer, Vol. 103, No. 3, 2010, pp. 382-390. doi:10.1038/sj.bjc.6605762
- J. C. Lawson, G. L. Blatch and A. L. Edkins, “Cancer Stem Cells in Breast Cancer and Metastasis,” Breast Cancer Research and Treatment, Vol. 118, No. 2, 2009, pp. 241-254. doi:10.1007/s10549-009-0524-9
- P. L. Nguyen, A. G. Taghian, M. S. Katz, et al., “Breast Cancer Subtype Approximated by Estrogen Receptor, Progesterone Receptor, and HER-2 Is Associated with Local and Distant Recurrence after Breast-Conserving Therapy,” Journal of Clinical Oncology, Vol. 26, No. 14, 2008, pp. 2373-2378. doi:10.1200/JCO.2007.14.4287
- H. Ozcelik, D. Pinnaduwage, S. B. Bull and I. L. Andrulis, “Type of TP53 Mutation and ERBB2 Amplification Affects Survival in Node-Negative Breast Cancer,” Breast Cancer Research and Treatment, Vol. 105, No. 3, 2007, pp. 255-265. doi:10.1007/s10549-006-9452-0
- R. R. Singh and R.Kumar, “MTA Family of Transcriptional Metaregulators in Mammary Gland Morphogenesis and Breast Cancer,” Journal of Mammary Gland Biology and Neoplasia, Vol. 12, No. 23, 2007, pp. 115-125. doi:10.1007/s10911-007-9043-7
- A. E. Greijer, P. van der Groep, D. Kemming, et al., “UpRegulation of Gene Expression by Hypoxia Is Mediated Predominantly by Hypoxia-Inducible Factor 1 (HIF-1),” Journal of Pathology, Vol. 206, No. 3, 2005, pp. 291-304. doi:10.1002/path.1778
- D. Coradini, P. Boracchi, M. G. Daidone, et al., “Contribution of Vascular Endothelial Growth Factor to the Nottingham Prognostic Index in Node-Negative Breast Cancer,” British Journal of Cancer, Vol. 85, No. 6, 2001, pp. 795-797. doi:10.1054/bjoc.2001.2019
- D. Coradini, E. Biganzoli, C. Pellizzaro, et al., “Vascular Endothelial Growth Factor in Node-Positive Breast Cancer Patients Treated with Adjuvant Tamoxifen,” British Journal of Cancer, Vol. 89, No. 2, 2003, pp. 268-270. doi:10.1038/sj.bjc.6601060
- H. Kouros-Mehr, J. Kim, S. K. Bechis and Z. Werb, “GATA-3 and the Regulation of the Mammary Luminal Cell Fate,” Current Opinions in Cell Biology, Vol. 20, No. 2, 2008, pp. 164-170. doi:10.1016/j.ceb.2008.02.003
- M.-L. Asselin-Labat, K. D. Sutherland, H. Barker, et al., “Gata-3 Is an Essential Regulator of Mammary-Gland Morphogenesis and Luminal-Cell Differentiation,” Nature Cell Biology, Vol. 9, No. 2, 2007, pp. 201-212. doi:10.1038/ncb1530
- D. M. Abd El-Rehim, S. E. Pinder, C. E. Paish, et al., “Expression of Luminal and Basal Cytokeratins in Human Breast Carcinoma,” Journal of Pathology, Vol. 203, No. 2, 2004, pp. 661-671. doi:10.1002/path.1559
- E. A. Rakha, M. E. El-Sayed, A. R. Green, E. C. Paish, A. H. Lee and I.O. Ellis, “Breast Carcinoma with Basal Differentiation: A Proposal for Pathology Definition Based on Basal Cytokeratin Expression,” Histopathology, Vol. 50, No. 4, 2007, pp. 434-438. doi:10.1111/j.1365-2559.2007.02638.x
- K. A. Hoadley, V. J. Weigman, C. Fan, et al., “EGFR Associated Expression Profiles Vary with Breast Tumor Subtype,” BMC Genomics, Vol. 8, 2007, Article No. 258. doi:10.1186/1471-2164-8-258
- Y. Benjamini and Y. Hochberg, “Controlling the False Discovery Rate. A Practical and Powerful Approach to Multiple Testing,” Journal of the Royal Statistics Society B, Vol. 57, 1995, pp. 284-300.
- F. Husson, S. Lê and J. Pagès, “Exploratory Multivariate Analysis by Example Using R,” Computer Science and Data Analysis Series, CRC Press, Boca Raton, 2010.
- J. D. Jobson, “Applied Multivariate Data Analysis Volume 2. Categorical and Multivariate Methods,” Springer, Berlin, 1992.
- V. G. Tusher, R. Tibshirani and G. Chu, “Significance Analysis of Microarrays Applied to the Ionizing Radiation Response,” Proceeding of the National Academy of Sciences of the United States of America, Vol. 98, No. 9, 2001, pp. 5116-5121.
- C. Casarsa, N. Bassani, F. Ambrogi, et al., “Epithelial-toMesenchymal Transition, Cell Polarity and StemnessAssociated Features in Malignant Pleural Mesothelioma,” Cancer Letters, Vol. 302, No. 2, 2011, pp. 136-143. doi:10.1016/j.canlet.2011.01.009
- O. W. Petersen and K. Polyak, “Stem Cells in the Human Breast,” Cold Spring Harbor Perspect in Biology, Vol. 2, No. 5, 2010, Article ID: a003160. doi:10.1101/cshperspect.a003160
- B. Tiede and Y. Kang, “From Milk to Malignancy: The Role of Mammary Stem Cells in Development, Pregnancy and Breast Cancer,” Cell Research, Vol. 21, No. 2, 2011, pp. 245-257. doi:10.1038/cr.2011.11
- C. Ginestier, M. H. Hur, E. Charafe-Jauffret, et al., “ALDH1 Is a Marker of Normal and Malignant Human Mammary Stem Cells and a Predictor of Poor Clinical Outcome,” Cell Stem Cell, Vol. 1, No. 5, 2007, pp. 555- 567. doi:10.1016/j.stem.2007.08.014
- E. M. Hansson, U. Lendahl and G. Chapman, “Notch Signaling in Development and Disease,” Seminars in Cancer Biology, Vol. 14, No. 5, 2004, pp. 320-328. doi:10.1016/j.semcancer.2004.04.011
- G. Dontu, K. W. Jackson, E. McNicholas, M. J. Kawamura, W. M. Abdallah and M. S. Wicha, “Role of Notch Signaling in Cell-Fate Determination of Human Mammary Stem/Progenitor Cells,” Breast Cancer Research, Vol. 6, No. 6, 2004, pp. R605-615. doi:10.1186/bcr920
- A. P. Bracken, N. Dietrich, D. Pasini, K. H. Hansen and K. Helin, “Genome-Wide Mapping of Polycomb Target Genes Unravels Their Roles in Cell Fate Transitions,” Genes and Development, Vol. 20, No. 9, 2006, pp. 1123- 1136. doi:10.1101/gad.381706
- A. M. Pietersen, B. Evers, A. A. Prasad, et al., “Bmi1 Regulates Stem Cells and Proliferation and Differentiation of Committed Cells in Mammary Epithelium,” Current Biology, Vol. 18, No. 14, 2008, pp. 1094-1099. doi:10.1016/j.cub.2008.06.070
- K. E. Sleeman, H. Kendrick, A. Ashworth, C. M. Isacke and M. J. Smalley, “CD24 Staining of Mouse Mammary Gland Cells Defines Luminal Epithelial, Myoepithelial/Basal and Non-Epithelial Cells,” Breast Cancer Research, Vol. 8, No. 1, 2006, Article No. R7.
- D. Ponti, A. Costa, N. Zaffaroni, et al., “Isolation and in Vitro Propagation of Tumorigenic Breast Cancer Cells with Stem/Progenitor Cell Properties,” Cancer Research, Vol. 65, No. 13, 2005, pp. 5506-5511. doi:10.1158/0008-5472.CAN-05-0626
- X. Varelas, R. Sakuma, P. Samavarchi-Tehrani, et al., “TAZ Controls Smad Nucleocytoplasmic Shuttling and Regulates Human Embryonic Stem-Cell Self-Renewal,” Nature Cell Biology, Vol. 10, No. 7, 2008, pp. 837-848. doi:10.1038/ncb1748
- J. Xu, S. Lamouille and R. Derynck, “TGF-β-Induced Epithelial to Mesenchymal Transition,” Cell Research, Vol. 19, No. 2, 2009, pp. 156-172. doi:10.1038/cr.2009.5
- F. Vesuna, A. Lisok, B. Kimble and V. Raman, “Twist Modulates Breast Cancer Stem Cells by Transcriptional Regulation of CD24 Expression,” Neoplasia, Vol. 11, No. 12, 2009, pp. 1318-1328.
- F. Vesuna, P. van Diest, J. H. Chen and V. Raman, “Twist Is a Transcriptional Repressor of E-Cadherin Gene Expression in Breast Cancer,” Biochemical and Biophysical Research Communications, Vol. 367, No. 2, 2008, pp. 235-241. doi:10.1016/j.bbrc.2007.11.151
- R. S. Muraoka-Cook, N. Dumont and C. L. Arteaga, “Dual Role of Transforming Growth Factor B in Mammary Tumorigenesis and Metastatic Progression,” Clinical Cancer Research, Vol. 11, 2005, pp. 937s-943s.
- J. Massagué, “TGFβ in Cancer,” Cell, Vol. 134, No. 2, 2008, pp. 215-230. doi:10.1016/j.cell.2008.07.001
- A. M. Band and M. Laiho, “Crosstalk of TGF-β and Estrogen Receptor Signaling in Breast Cancer,” Journal of Mammary Gland Biology and Neoplasia, Vol. 16, No. 2, 2011, pp. 109-115.