Open Journal of Air Pollution
Vol.1 No.2(2012), Article ID:22754,9 pages DOI:10.4236/ojap.2012.12003
Ambient Air Quality Surveillance and Indexing in and around Mining Clusters in Western Kachchh Region, Gujarat, India
Gujarat Institute of Desert Ecology (GUIDE), Opp. Changleshwar Temple, Bhuj, India
Email: anjaneia@gmail.com, anjaneia@sacon.in
Received June 9, 2012; revised July 17, 2012; accepted August 5, 2012
Keywords: Air Quality Index; Ambient Air Quality; Mining; Western Kachchh
ABSTRACT
Generation of baseline information about ambient air quality of any given region assumes significance, when 1) the area is an active mine site, 2) the area is proposed to be mined out in future, and 3) industrialization in the area is in fast pace. Ambient air quality monitoring (with respect to SPM, RPM, SO2, NOx and CO) was carried out in and around two mining complexes in western parts of Kachchh district in Gujarat, India to generate baseline air quality status of the area. This area has two major mine complexes and various large scale industrial projects (thermal power plants, cement plants and several ports and jetties) are also in pipeline. Ambient air sampling was carried out in four locations each within five km radial distance from two major mine sites, i.e. Panandhro and Mata-na-Madh. Air Quality Indexing was done for all the locations, since it is a simplest way for the prediction of ambient air quality status of any region with respect to industrial, residential and rural areas. Of the eight locations studied the air quality for six locations fell under fairly clean (Light Air Pollution, AQI 25 - 50) category, while the rest (rural areas in the region), had relatively better air quality and fell under clean (Clean Air, AQI 10 - 25) category.
1. Introduction
In India mining is one of the core industries contributing to the economic development and has detrimental environmental impacts, though unavoidable to some extent. Western region of Kachchh district in Gujarat, consisting of Lakhpat and Abdasa Taluks with the adjoining areas of Nakhatrana taluk, is one of the most arid and socioeconomically backward regions. The region is bestowed with several mineral resources, viz. lignite, bentonite, lateriate, limestone and bauxite. Rich mineral resources of the region have opened up the possibilities for the expansion of mining activities, industrialization and rapid socio-economic development. Until date, there are three active mining sites in Western parts of Kachchh, i.e. Matana-Madh, Panandhro and Jadva, of which Panandhro and Mata-na-Madh lignite mine belong to Gujarat Mineral Development Corporation (GMDC) and Jadva limestone mine belongs to M/S Sanghi Cements Ltd. Kachchh has 44.6 percent of Gujarat state’s reserves of lignite [1]. The total reserve is around 200 MT spread over seven isolated pockets, of which Panadhro is the single largest deposit consisting of 98.0 MT. The production of lignite mine is 5.5 MTPA [2]. GMDC restricted supply of lignite from Panandhro mining complex during early 2008 and reserved the remaining lignite reserve to cater the captive requirements of two thermal power plants at Panandhro and Akrimota. Contrary to this, there was 24.4% increase in annual lignite production at Mata-na-Madh mining complex (Personal communication with GMDC officials) due to diminishing limited mineable reserve at Panandhro site and to meet rising demands in domestic market.
The major sources of atmospheric emissions in this region with opencast mining as a dominant industrial activity include land clearing, removal of overburden, vehicular movement, excavation, and loading and unloading of ore materials. Dust emanating from the haul roads in lignite and limestone mines contribute considerably to the particulate matter content in the atmosphere. Other major industries, which are operational at present, in the region, include thermal power plants, cement plants, several ports and jetties. Environmental contamination due to dust particulates from all of these activities including stone crushing draws serious attention as they create pollution problems and pose threat to the ecosystem. The extent of dispersion of the dust emanating from these activities depend on the topographical setting of the area, vegetation cover and certain micro-meteorological factors.
The present investigation considered assessment of Suspended Particulate Matter (SPM), Respirable Particulate Matter (RPM), Oxides of Nitrogen (NOx), Sulphur Dioxide (SO2), and Carbon Monoxide (CO). National ambient air quality standard was prescribed by CPCB (1995-1996) and later on revised by categorizing different areas with respect to pollution potential (Table 1 [3]). As per the revised notification, particulate matters have been divided into two categories, i.e. those with <10 µm aerodynamic diameter (PM10) and those with <2.5 µm aerodynamic diameter (PM2.5). In the present investigation, however, RPM indicates those with size <10 µm and does not further fractionate into fine particles, i.e. PM2.5. Hence, in the absence of stipulated concentration level for particles with size >10 µm (SPM as per the old standards), the SPM levels in the present investigation was compared with the pre-revised standards (as stipulated earlier). However, for better interpretation of the analytical dataAir Quality Index (AQI) was proposed and the whole area was categorised accordingly. The detailed categories as per the AQI are presented in Table 2 [4]. Owing to the present scenario and rapid industrialization in the area, the present investigation was undertaken to evaluate ambient air quality status of the area, which can be used for trend analysis after decades of industrialization in the region. The specific research questions, those were attempted to answer during the present investigation are as below:
• What is the background concentration of SPM, RPM, NOx, SO2, and CO?
• Do these above mentioned pollutants show any spatio-temporal gradient in their availability in the ambient air?
2. Materials and Methods
2.1. Study Area
The study area (Figure 1) covering about 5000 km2 area in western Kachchh region, encompasses parts of
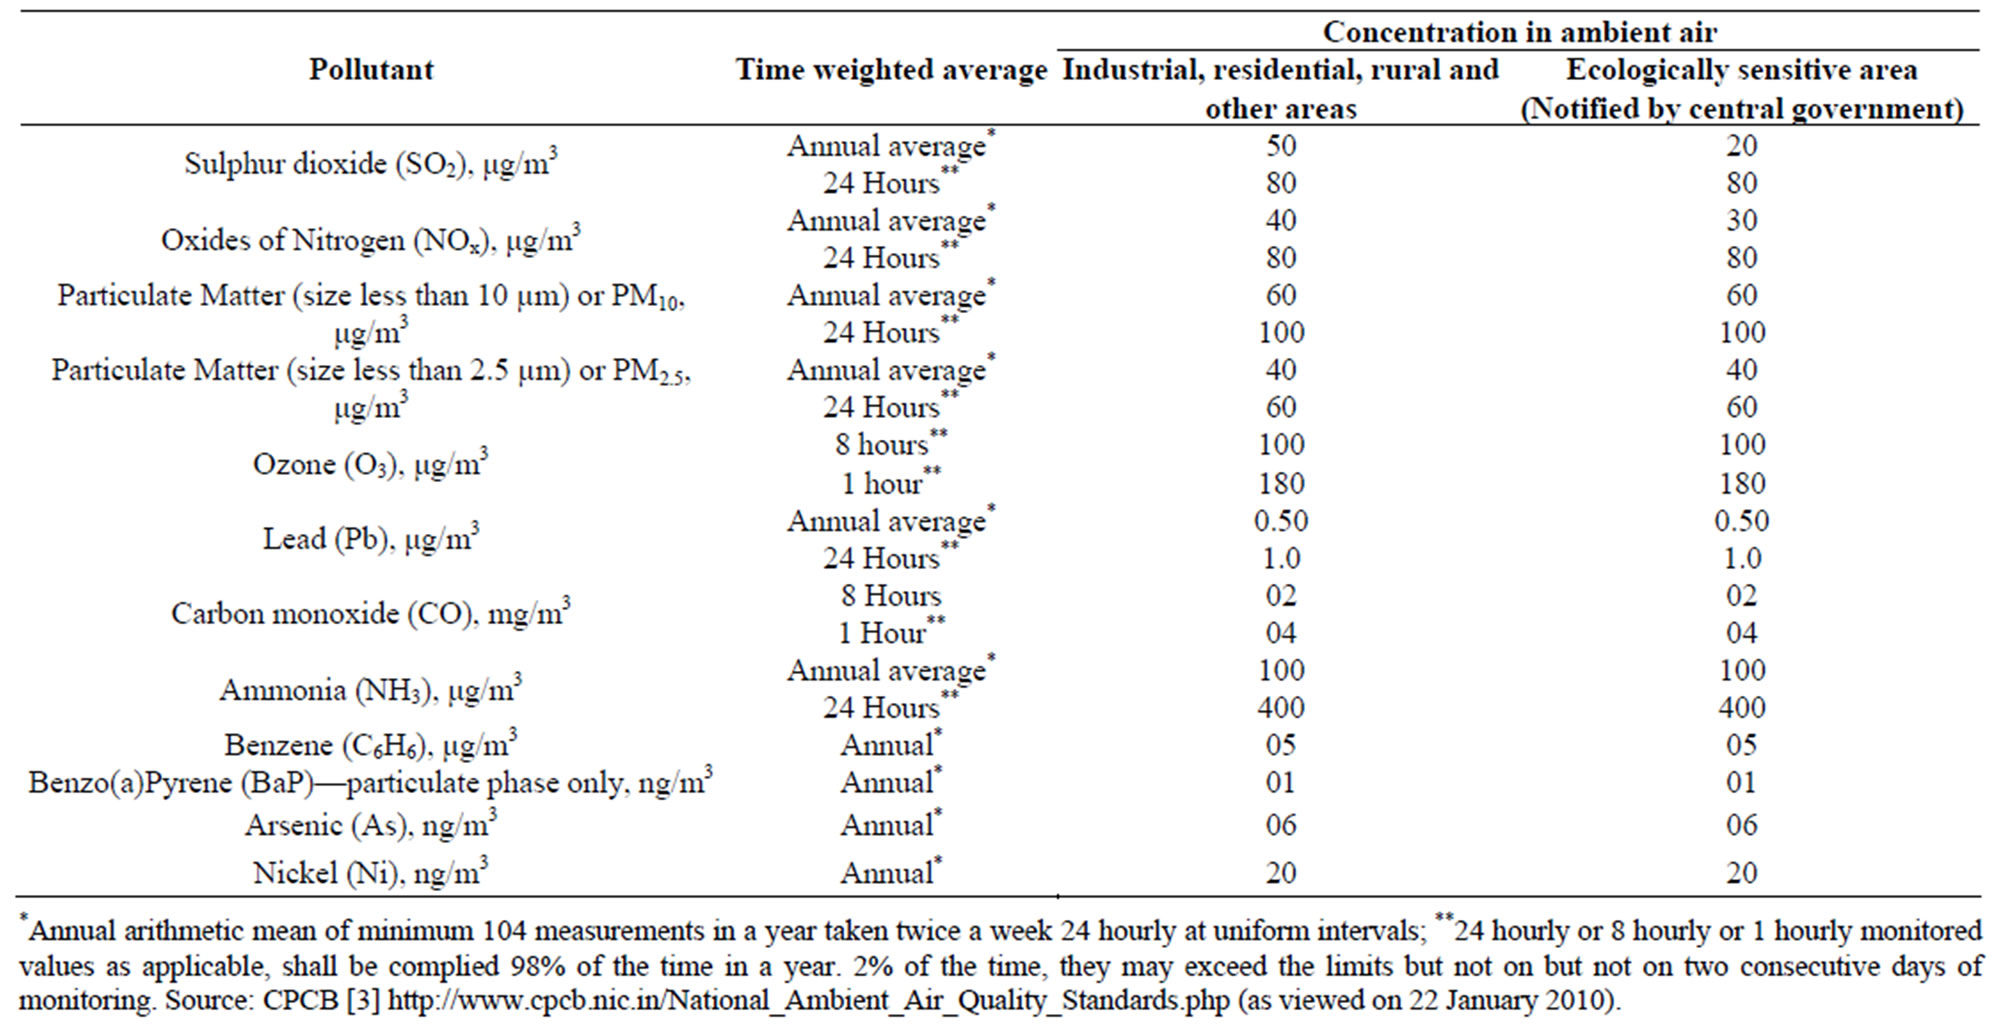
Table 1. National ambient air quality standard.
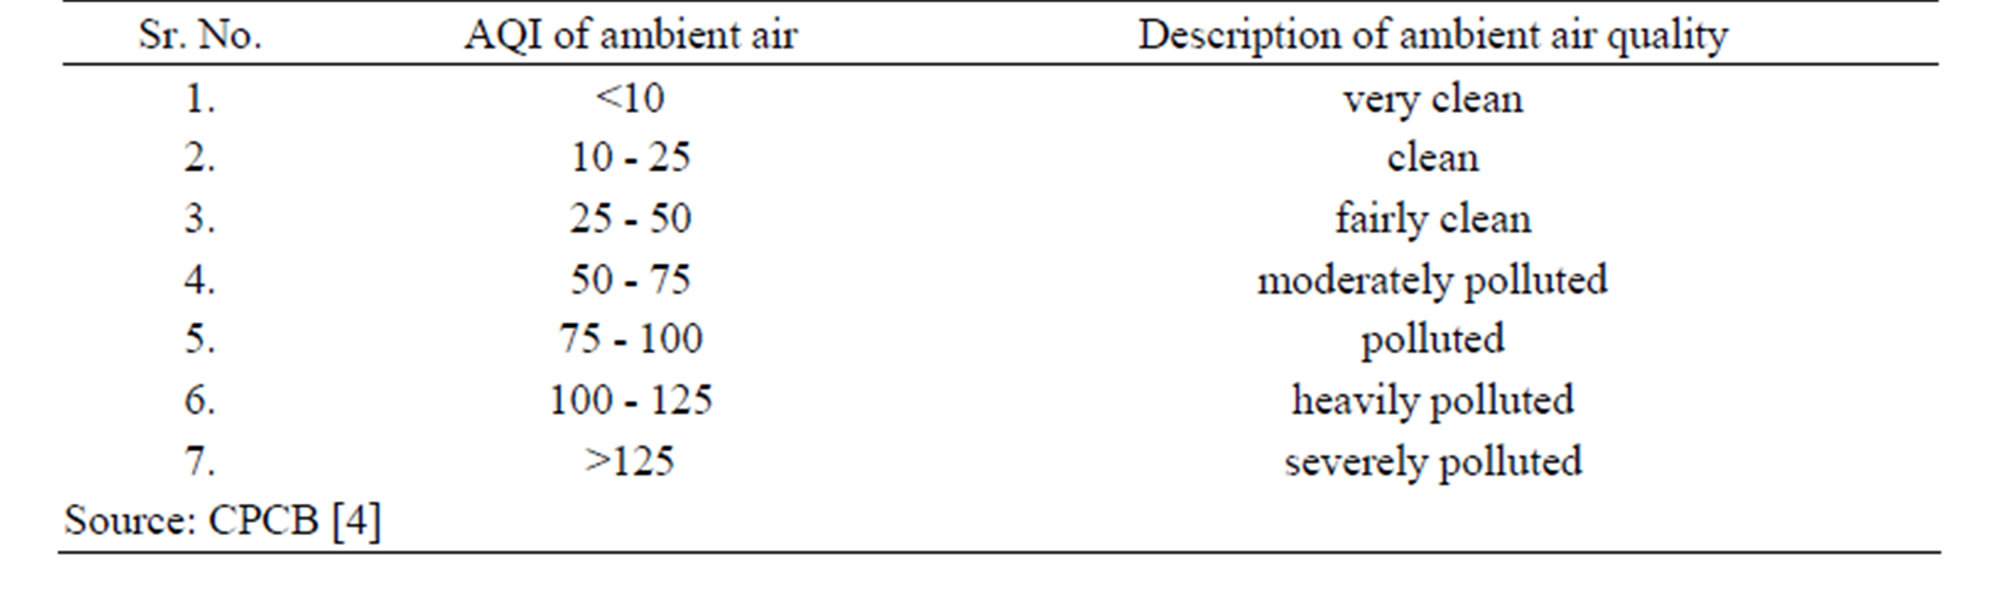
Table 2. Air quality categories based on AQI.
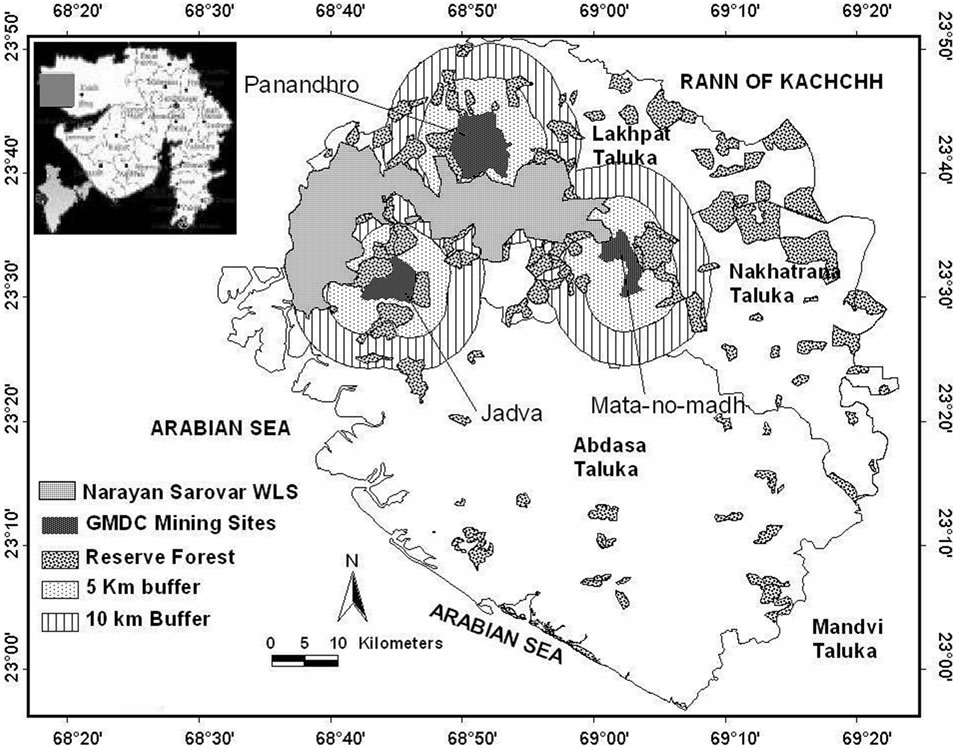
Figure 1. Study area showing major mining complexes.
Lakhpat, Abdasa and Nakhatrana taluks. This zone is representative of Kachchh with all landscape elements like forests, agriculture, industries, mining areas, grassland, mangroves, salt pans, rocky barrens, wetlands and waste land. Intensive study area was delineated by considering a buffer of 10 km from two major mining complexes in the region. These mining complexes are at Panandhro and Mata-na-Madh villages located in Lakhpat and Nakhatrana taluks, respectively (Figure 1). The area with three major landform types (depositional landform, erosional landform and residual landform) falls under drought prone region. The climate of Kachchh region is characterized by long hot summer, cold winter and overall aridity. The area experiences four seasons: Winter (December to February), summer (March to mid June) followed by monsoon till September, and post-monsoon (October to November). There is general moisture deficiency, indicating sustained potential water deficit where potential evapo-transpiration (PET) outweighs precipitation. The region is marked by very high aridity index of over 40 percent with more or less dry desert conditions. The rainfall usually shows an upward gradient from west to east. Being situated in the extreme western portion of Kachchh, the study area landscape receives lowest rainfall. The annual average rainfall is low (334.7 mm) near these mining complexes. Semi-arid climatic conditions prevail in the area, which falls in rain-shadow portion with scanty rainfall. The minimum and maximum temperatures recorded were 2˚C and 44˚C during winter and summer, respectively. The area is characterized by a very low gradient and devoid of any significant topographic features, where the plain gradually rises, from the sea level, to an altitude of 297 m.
2.2. Sampling and Analysis
Reconnaissance of the region was carried out in the 1st intern of the April-May 2008 to gain basic understanding about the existing ecosystem types, and to identify the strategic locations for ambient air quality monitoring. For the purpose of obtaining an overall picture about air quality parameters in this region both the lignite mining complexes were considered and accordingly the ambient air quality monitoring stations (AAQMS) were selected in and around the mining sites. Four AAQMS were selected with respect to each mine site (Figure 2), of which, one at the mine site and the rest in different directions with respect to the mine centre, and specific details about each of the AAQMS are given in Table 3. The sampling locations were also selected as per Bureau of Indian Standards (BIS) specifications, such that the sampler is placed at breathing level which is at a height of 1.5 to 3 meters above ground level. Therefore in all the places, care was taken to see that the instruments were placed suitably, at least at the 1st floor level to avoid accumulation of dust lifted from ground level. The method of air sample collection and analysis is presented in the Table 4 [5-8]. Respirable Dust Sampler (RDS, Make: Envirotech, Model: APM 460) was used for collecting particulate matter and gaseous samples, and additionally air samples were collected instantly using rubber bladders for CO samples. The RDS was operated at a flow rate of 1.0 to 1.3 m3/minute that allows particulates with size up to 10 μm to get collected on high efficiency glass microfiber filter paper. Pre-weighed rubber cups and glass fibre filter paper (Whatman make) were used for measurement of SPM and RPM concentrations, respectively. For gaseous samples an impingent rate of 1.0 l/minute was maintained throughout the sampling duration. The impinger samples were put in ice boxes immediately after sampling and transferred to laboratory and stored in a refrigerator until further analysis. The frequency of sampling was twice a month during June 2008, October 2008 and January 2009 representing summer, monsoon and winter seasons, respectively.
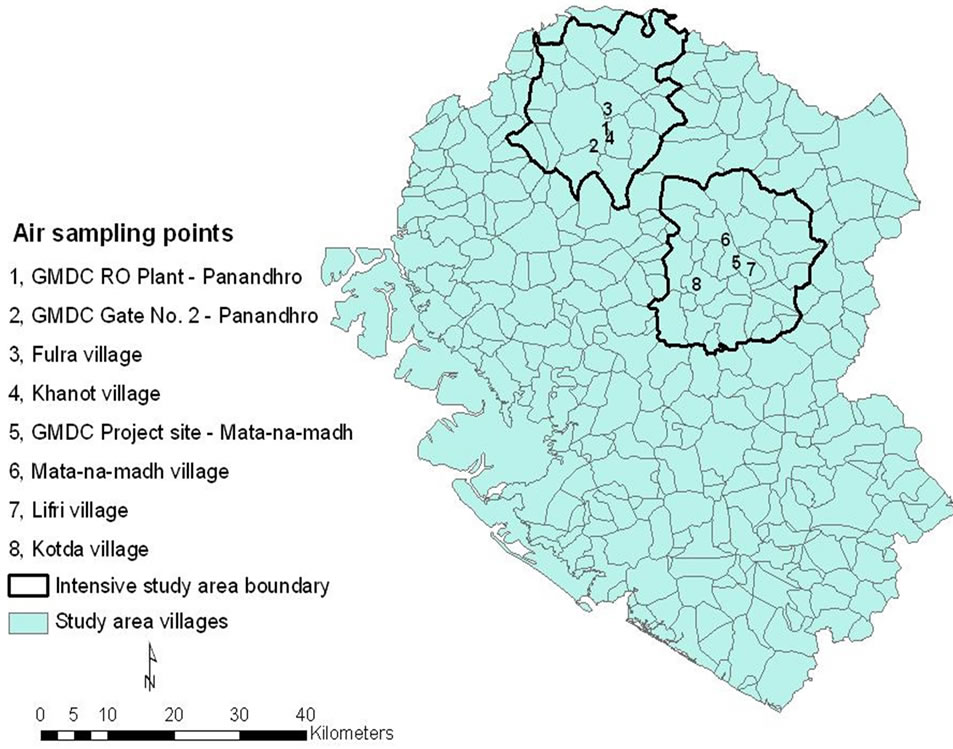
Figure 2. Sampling locations in the study area.
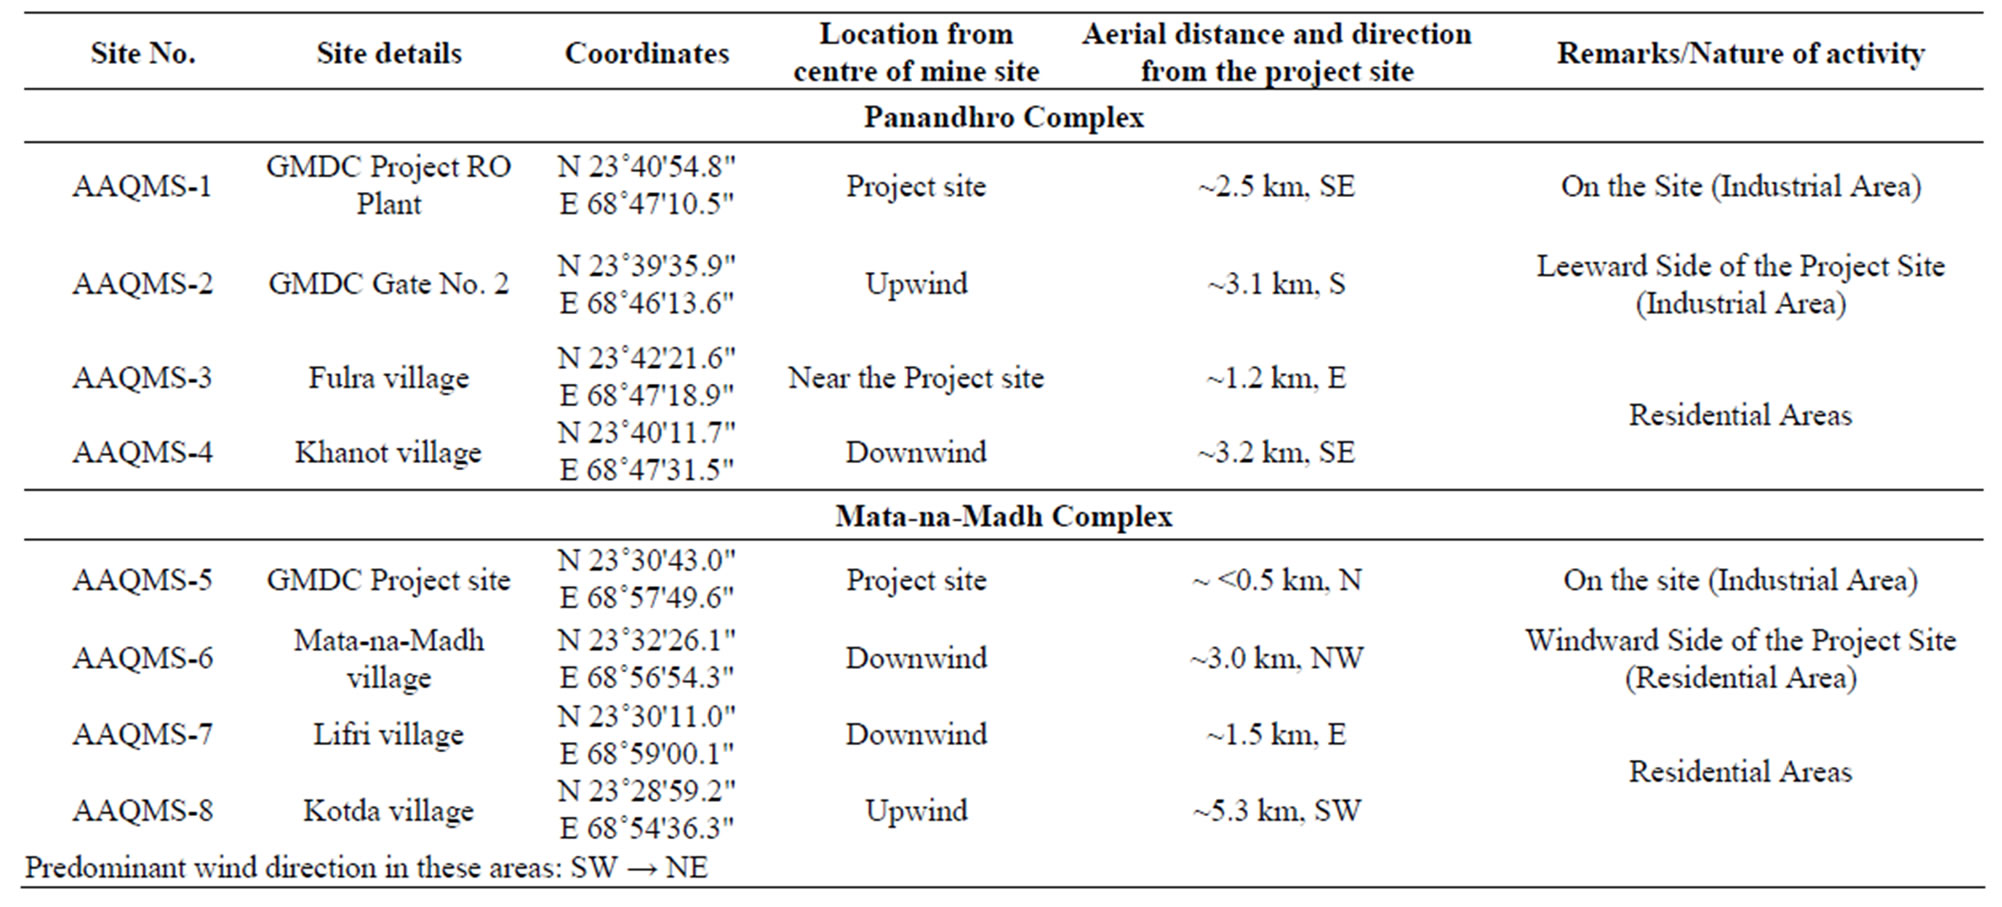
Table 3. Details about the ambient air quality monitoring stations.
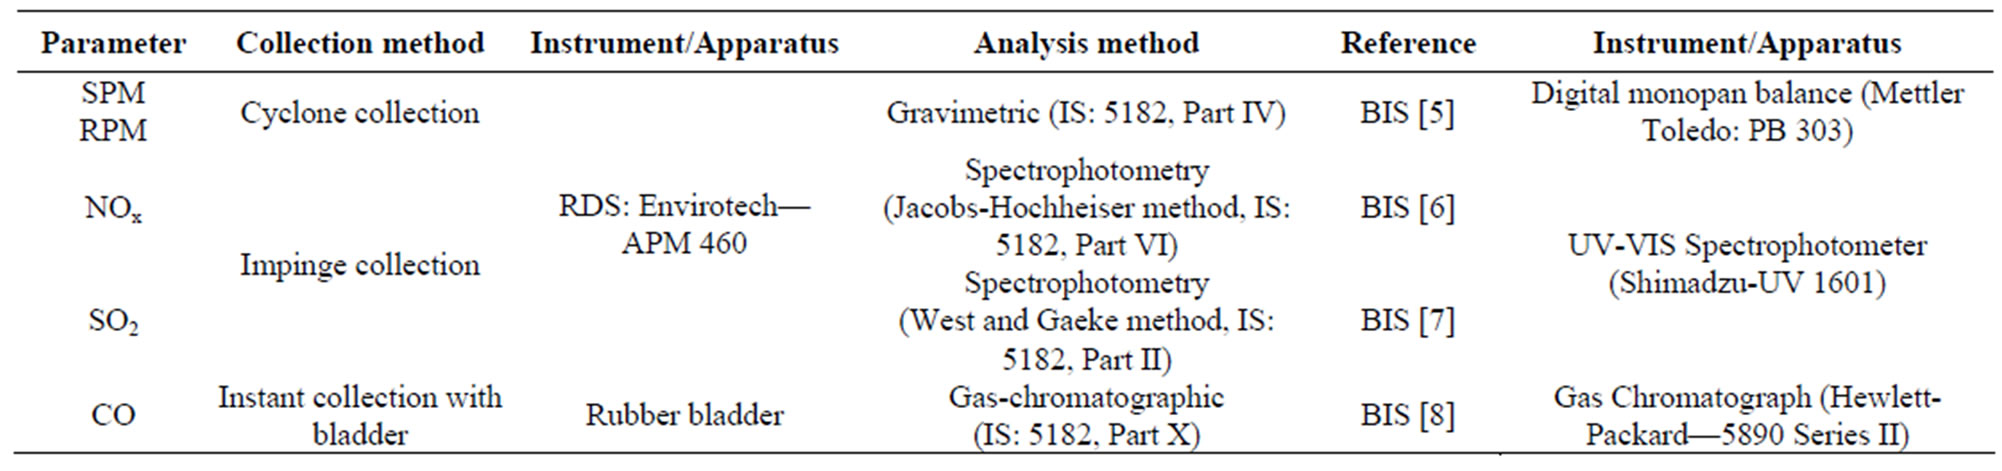
Table 4. Methods used for sampling and analysis of air samples.
2.3. Air Quality Indexing
Air quality index (AQI) is an overall measure of the status of a place under consideration. From a series of observations, an index (a ratio or number) is derived which is an indicator or measure of some condition or property. This index is a compilation of terms that define the air quality as understandable by a layman. The AQI is a measure of the ratio of the pollutant concentration to the standard concentration and is an interpretive technique which transforms measured concentrations of individual air pollutants into a single set of numbers in order to make the data more understandable. The higher value of an index refers to a greater level of air pollution and consequently greater health risks. On the basis of air quality index “Q”, the quality rating of each parameter was obtained by the formula as below, following Agarwal et al. [9]:
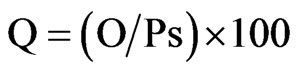
where, Q = Quality RatingsO = Observed ValuePs = Prescribed standards as permissible limits.
Subsequently, the geometric mean of this “n” number of quality ratings “Q” was estimated, which is known as AQI. To find the range, mean and distribution of different variables in the present investigation, basic descriptive statistics was performed on the analytical data using MEGASTAT 8.8 [10]. The locations, where CO concentration was recorded Below Detection Level (BDL); DL/ 2 was considered for the ease of statistical analyses.
3. Results and Discussion
Since the present investigation was first of its kind of environmental assessment study for this region, the present concentrations of the air quality parameters were compared with reported values from elsewhere in India (Table 5 [11-13]). With respect to the questions aimed at addressing in the present investigation, it was found that the background concentration of all the 5 air quality parameters were below the stipulated standards. Based on the air quality data spatio-temporal distribution of all the air pollutants was assessed. Most of the air pollutants were dispersed in atmosphere based on prevailing meteorological conditions in the area. The ambient level of air pollutants in and around the mining complexes were a function of 1) locations of the sampling site; 2) distance from the mine; 3) direction of the site with respect to the mine, i.e. leeward or windward side of the mine locations; and 4) season of the sampling.
3.1. Panandhro Mine Complex
All the parameters studied were within detectable levels in the ambient air in the area except CO. SPM levels in and around Panandhro lignite mine site ranged between 6.0 and 144.0 µg/m3 with the minimum value observed at Fulra village (AAQMS-3) during June 2008 and the maximum at AAQMS-2 (Gate No. 2, GMDC Lignite Project, Figure 3) during October 2008. RPM levels in the ambient air ranged from 35.0 to 153.0 µg/m3, with the corresponding locations being Fulra village and GMDC project site RO plant, respectively during June 2008 (Figure 3). SO2 levels ranged between 11.0 and 36.5 µg/m3, wherein the lowest level was at Khanot village (June 2008) and GMDC Gate No. 2 (October 2008), and highest at Fulra village during October 2008 (Figure 3). NOx concentration in the ambient air of Panandhro lignite mine area ranged between 11.0 µg/m3 (June 2008) and 77.5 µg/m3 (October 2008), both at Fulra village (Figure 3).
CO level in the ambient air ranged from 175.0 to 295.0 µg/m3 and the corresponding locations were GMDC RO plant (October 2008) and GMDC Gate No. 2 (June 2008), respectively (Figure 3). The CO concentration at Fulra village was BDL. The level of all the air quality parameters in and around Panandhro mining complex with detectable concentration was below the prescribed limits for corresponding area categories (industrial, residential and rural, Table 1 [3]). Both SPM and RPM levels were highest near the project sites, i.e., AAQMS-2 and AAQMS-1, respectively. Mining is the main source of particulate matter concentrations [13] at the project sites, where as heavy traffic and vehicular moments near the Panandhro lignite project might have contributed to the level of SO2 and NOx at Fulra village. The village is located very close (about 200 m) to the main approach road of the mine site and hence experiences more vehicular movements. Of the two sources of air pollutants in the atmosphere, i.e. 1) natural sources, and 2) anthropogenic sources [14], vehicular traffic (anthropogenic) is one of the known contributors of SO2 and NOx [15].
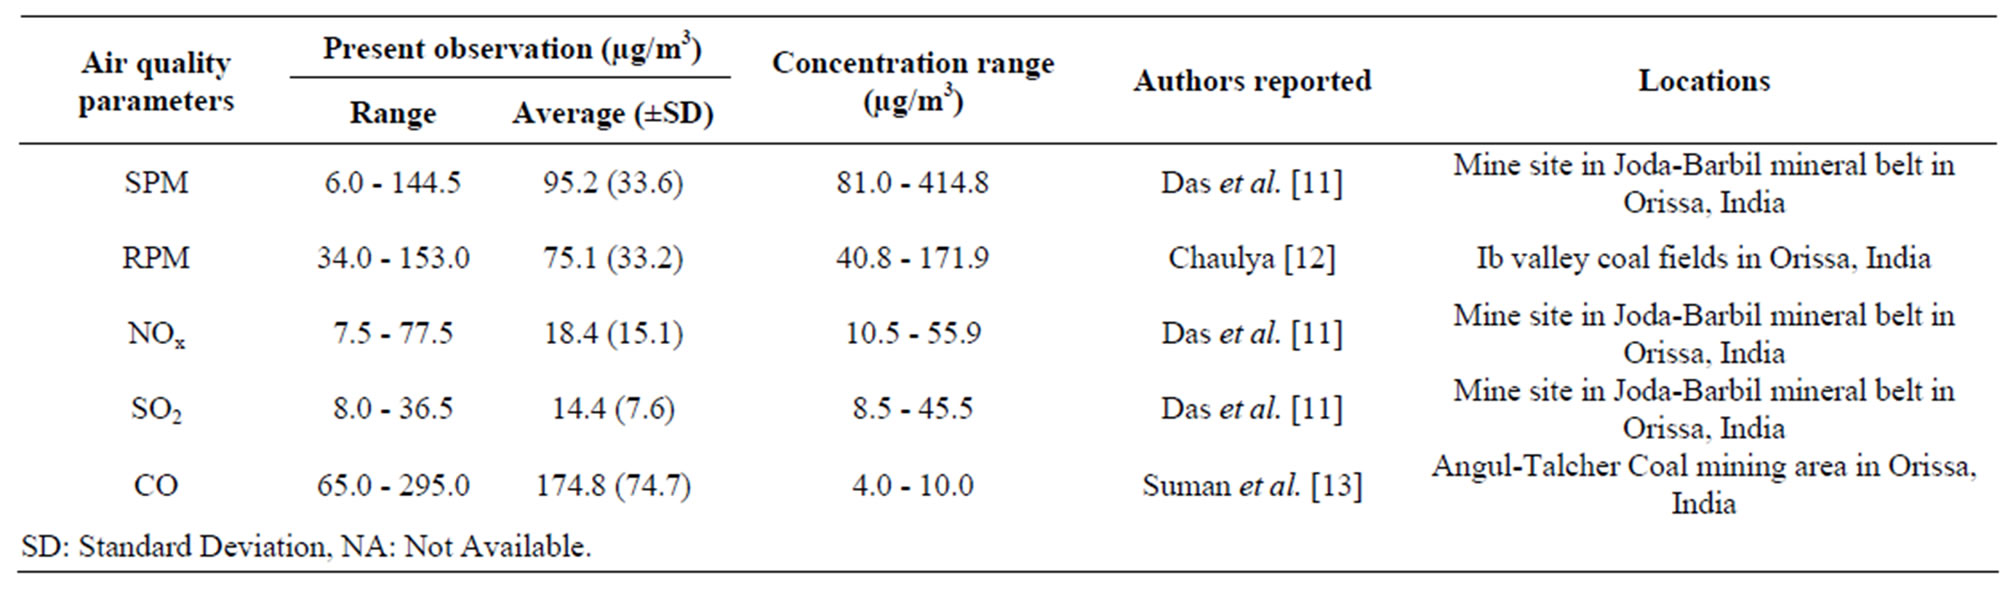
Table 5. General concentration range vs presently recorded concentrations for air quality parameters.
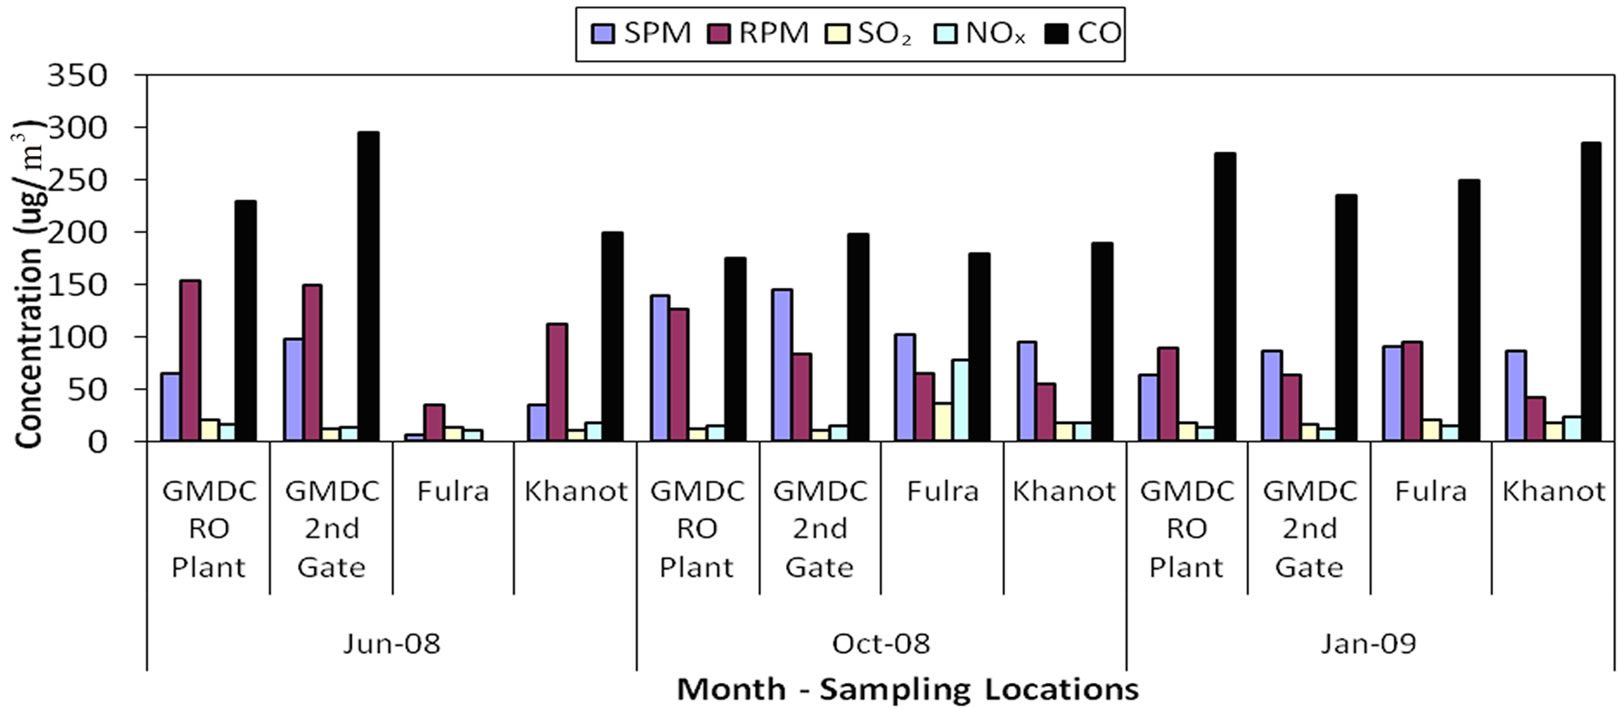
Figure 3. Level of air quality parameters in Panandhro mine complex.
3.2. Mata-Na-Madh Mine Complex
Akin to Panandhro site, all the stations in Mata-na-Madh site also had detectable level of air quality parameters except CO. SPM levels in and around the mining complex was from 53.5 to 142.0 µg/m3, the minimum level at Kotda village (June 2009) and the maximum at Lifri village (October 2008, Figure 4). RPM levels ranged between 34.0 and 98.5 µg/m3, with the corresponding stations being Lifri village and GMDC project site, respectively during October 2008 (Figure 4). The higher levels of particulate matter observed near the project site might be a cumulative impact of mining activities and vehicular movements. The fine fraction (<2.5 µm) of the particulate matter contains most of the acidity (hydrogen ion) and mutagenic activity [16]. SPMs are also generated by incomplete fuel combustion and metallic industries. However, fugitive dust from opencast mining is a contentious issue. It has often been perceived to be a significant contributor to ambient levels of airborne particulates, even though no reliable means of dust fingerprinting has been available to regulatory authorities [17]. With ever-increasing number of vehicles, vehicular traffic contribute significantly to the particulate matter levels in the ambient air [18] especially in urbanized areas and/or areas those experience heavy vehicular movements.
SO2 levels ranged from 8.0 to 33.5 µg/m3. The lowest level was recorded at Kotda village (June 2008 and October 2008) and Lifri village (October 2008), and the highest at GMDC project site (January 2009, Figure 4). Highest concentration at the mine site could be due to temperature inversion and mixing heights in the lower atmosphere, which reduce the dispersion of pollutants from source and hence the ambient level increases. NOx concentration in the ambient air varied between 7.5 and 47.0 µg/m3.
Lowest and highest concentration was seen at GMDC project site (June 2008) and Mata-na-Madh village (October 2008), respectively (Figure 4). Sulphur dioxide and oxides of nitrogen are universally occurring atmospheric pollutants and are important constituents of automobile exhaust and industrial emissions [19]. In addition to the ongoing mining activities, increasing number of vehicles around the mine site and nearby villages might have contributed to the higher levels of oxides of nitrogen. Most of the air pollutants were observed low during the wet precipitation (rainfall) days.
CO concentration in the ambient air ranged between 150.0 and 230.0 µg/m3 and the corresponding locations were GMDC Project site (June 2008) and Mata-na-Madh village (January 2009), respectively (Figure 4). CO concentration in Lifri (AAQMS-7) and (AAQMS-8) Kotda villages were BDL. The locations with detectable concentration of the air quality parameters in the present study recorded levels below the prescribed limits for corresponding area categories (industrial, residential and rural, Table 1). CO, one of the five primary pollutants which together contribute more than 90% of global atmospheric pollution [20], is one of the major pollutants emitted to the atmosphere during mine fires. Coal mine fires cause major perturbation of the micro as well as macro-environment of the coal field and give rise to severe environmental problems besides safety hazards. Effect of mine fires on air quality are alarming and the cracked strata acts as a chimney stack discharging various air pollutants including CO during coal combustion process [21]. Moreover, vehicular movements contribute to CO levels in the ambient air considerably [22,23] and this holds true in case of mine areas due to massive vehicular transport involved in transporting ore materials. This causes a lot of inconveniences and health hazards to the people residing in the proximity of mine areas.
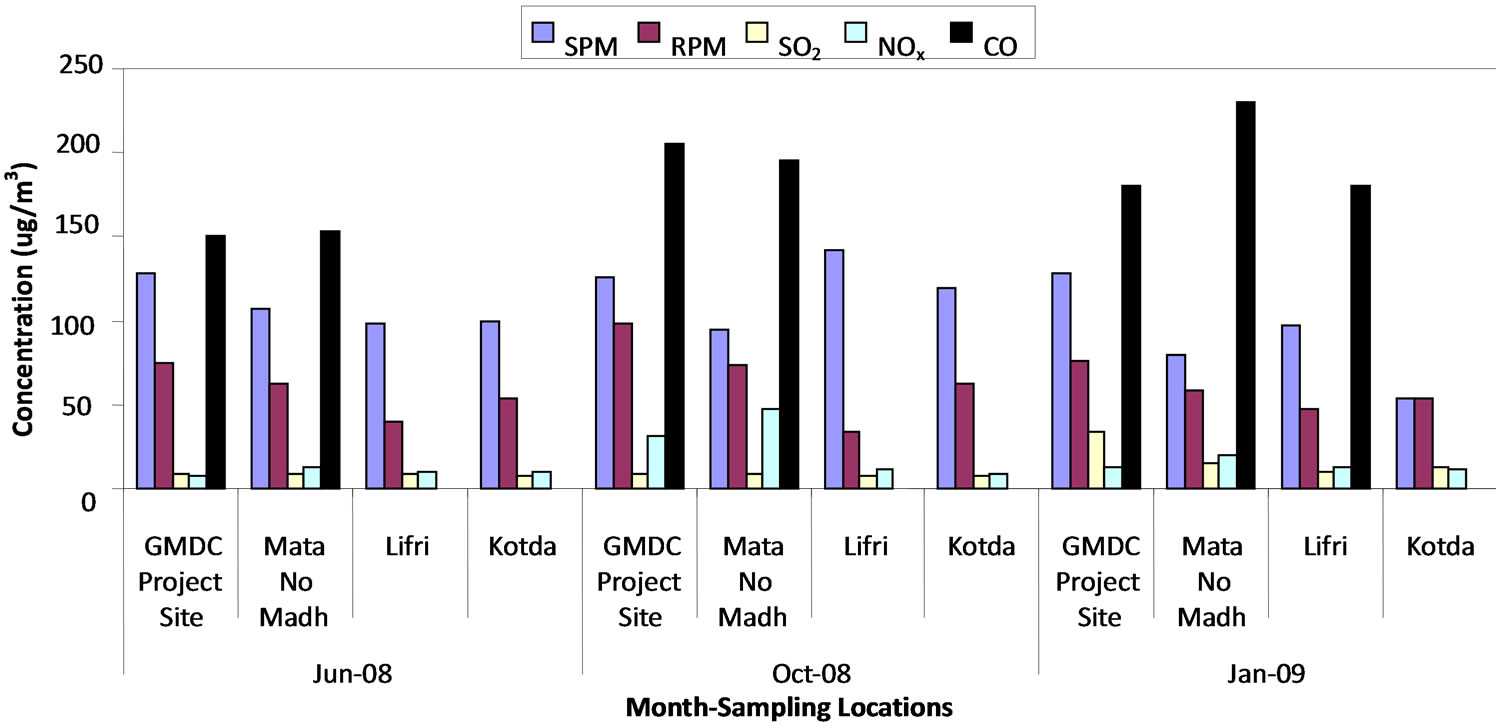
Figure 4. Level of air quality parameters in Mata-na-Madh mine complex.
3.3. Air Quality Scenario
As a statutory and regulatory requirement, environmental impact assessment studies were undertaken for the Industries in this region including the mining projects. Nevertheless, the present investigation considered simultaneous assessment of ambient air quality for all the major mining complexes in Western Kachchh region. In view of this, results of the present study were compared with studies undertaken elsewhere in the country bearing similar environmental conditions. The comparative results are presented in Table 5 [11-13]. This would provide insights about the status of air pollution in the study area and would be helpful for the planners and decision makers for further environmental planning of the area in view of rapid industrialization. Of all the air quality parameters examined, the level of SPM, RPM and SO2 was less than the reported values from other coal mining areas in Orissa [11,12]. However, the level of NOx exceeded the reported concentrations by Das et al. [11] from select mine sites in Joda-Barbil mineral belt in Orissa. CO levels in the present investigation (65.0 - 295.0 µg/m3) far exceeded the levels reported by Suman et al. [13] from Angul-Talcher coal mine area in Orissa (Table 5).
3.4. Air Quality Index
As per the air quality rating and AQI, all the sampling stations could be categorised under two categories: Fairly Clean (Light Air Pollution, AQI 25 - 50) and Clean (CleanAir, AQI 10 - 25). Of all the locations, the AQI of Fulra village was under Fairly Clean category (AQI 32.8), and for rest of the locations it was under “Clean” category (Table 6). According to Rosaline and Elangovan [24], Fulra location could also be described as the area experiencing Light Air Pollution. Although out of eight locations, seven were within five km of the mine centres, none of them seemed to experience poor air quality. Absence of any reliable tool for dust fingerprinting is a major challenge in this regard, and hence we compared the values with CPCB stipulated standards for industrial, residential and rural areas.
4. Conclusion
The present investigation is based on the ambient air quality monitoring for SPM, RPM, SO2, NOx and CO at eight strategic locations in and around two of the major lignite mining sites in western Kachchh. The levels of all these air quality parameters were well within the permissible
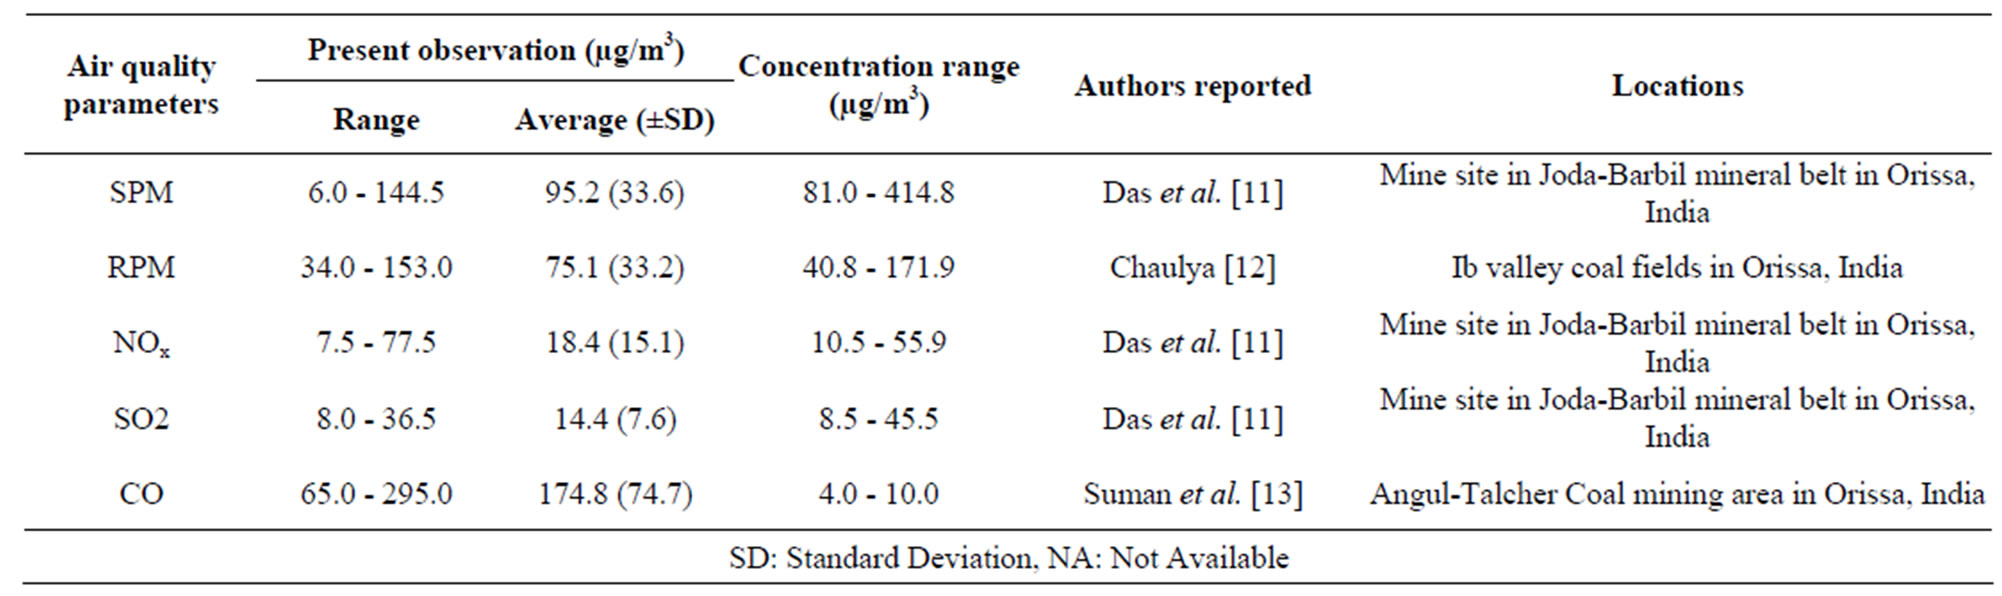
Table 5. General concentration range vs presently recorded concentrations for air quality parameters.

Table 6. AQI and air quality categories in Western Kachchh.
limits as prescribed by CPCB for residential and industrial areas. In certain locations CO level was below the detectable levels. AQI revealed that the air quality fell under “Clean (Clean Air, AQI 10 - 25)” category at Lifri and Kotda in Mata-naMadh mine complex, and for the rest it was under “Fairly Clean (Light Air Pollution, AQI 25 - 50)” category. In brief, the present investigation threw light upon ambient air quality in and around selected mine areas in Kachchh region. Increased mining of lignite from Mata-na-Madh, operationalisation of several new major cement industries and increasing lime stone mining in the region necessitates comprehensive assessment of the ambient air in the whole region comprising other industrial locations, such as thermal power plants, cement plants, ports and jetties. Additionally assessing the carrying capacity of the region for air quality parameters, in view of the rapid industrialization, would further aid with the planning of this region for sustainable management of its mineral resources. This is expected to provide a realistic picture about the air quality of the region and would help the planners for zoning the locations for future industrialisation and implementation of proper pollution control measures.
5. Acknowledgements
I gratefully acknowledge Gujarat Mineral Development Corporation, Ahmedabad for providing financial support for undertaking this study. I am also thankful to The Director in-charge, GUIDE, Bhuj and Dr. Ashish Kumar, then Scientist, GUIDE and Principal Investigator of the project for their kind support throughout the study. Dr Rachna Chandra, EIA Division, SACON commented on an earlier draft of this paper.
REFERENCES
- B. A. K. Prusty, A. Kumar, P. N. Joshi, G. A. Thivakaran, M. Pardeshi, N. Gajera, R. Patel, S. Pati, P. Patel, H. Ayar and D. K. Worah, “Regional Environmental Assessment in Western Parts (Lakhpat, Abdasa and Nakhatrana Talukas) of Kachchh District, Gujarat,” Gujarat Institute of Desert Ecology, Gujarat Mineral Development Corporation, Ahmedabad, 2010, 314 p.
- GMRDS, “Working with the Elements: Mining in Gujarat,” Gujarat Mineral Development Society, Gandhinagar, 2007, 96 p.
- CPCB, “National Ambient Air Quality Standards,” 2009. http://www.cpcb.nic.in/National_Ambient_Air_Quality_Standards.php
- CPCB, “Standards for Liquid Effluents, Gaseous Emission, Automobile Exhaust, Noise and Ambient Quality, Pollution Control and Law Series,” Ministry of Environment and Forests, Government of India, New Delhi, 1995- 1996.
- BIS, “Indian Standard Methods for Measurement of Air Pollution: Part IV—Suspended Matter,” Bureau of Indian Standards, New Delhi, 1974, 11 p.
- BIS, “Indian Standard Methods for Measurement of Air Pollution: Part VI—Nitrogen Oxides,” Bureau of Indian Standards, New Delhi, 1975, 6 p.
- BIS, “Indian Standard Methods for Measurement of Air Pollution: Part II—Sulphur Dioxide,” Bureau of Indian Standards, New Delhi, 1969, 11 p.
- BIS, “Indian Standard Methods for Measurement of Air Pollution: Part X—Carbon Monoxide,” Bureau of Indian Standards, New Delhi, 1977, 16 p.
- S. Agarwal, B. L. Swami and A. B. Gupta, “Interpretation of Ambient Air Quality and Air Quality Parameters in Jaipur City—A Case Study,” Nature Environment and Pollution Technology, Vol. 7, No. 4, 2008, pp. 573-578.
- J. B. Orris, “MEGASTAT Version 8.8,” 2000. www.mhhe.com
- S. K. Das, J. K. Tripathy and M. M. Nayak, “Ambient Air Quality at a Mine Site in Joda-Barbil Mineral Belt in Orissa: A Case Study,” Pollution Research, Vol. 22, No. 2, 2003, pp. 265-267.
- S. K. Chaulya, “Air Quality Status of an Open Pit Mining Area in India,” Environmental Monitoring and Assessment, Vol. 105, No. 1-3, 2005, pp. 369-389. doi:10.1007/s10661-005-4345-y
- Suman, P. Roy, A. K. Pal and G. Singh, “Assessment of Air Quality Status in Angul-Talcher Coal Mining Area in Orissa,” Proceedings of 1st International Conference on MSECCMI, New Delhi, 19-21 November 2007, pp. 577- 589.
- B. A. K. Prusty, P. C. Mishra and P. A. Azeez, “Dust Accumulation and Leaf Pigment Content in Vegetation near the National Highway at Sambalpur, Orissa, India,” Ecotoxicology and Environmental Safety, Vol. 60, No. 2, 2005, pp. 228-235. doi:10.1016/j.ecoenv.2003.12.013
- S. M. Talebi, “Determination of Lead Associated with Airborne Particulate Matter by Flame Atomic Absorption and Wave-Length Dispersive X-Ray Fluorescence Spectrometry,” Pollution Research, Vol. 16, No. 4, 1997, pp. 203-207.
- K. P. Beckett, P. H. Freer-Smith and G. Taylor, “Urban Woodlands: Their Role in Reducing the Effects of Particulate Pollution,” Environmental Pollution, Vol. 99, No. 3, 1998, pp. 347-360. doi:10.1016/S0269-7491(98)00016-5
- J. Merefield, I. Stone, P. Jarman, J. Roberts, J. Jones and A. Dean, “Fugitive Dust Characterisation in Opencast Mining Areas,” Proceedings of the National Symposium on the Impact of Mining on the environment: Problems and Solutions, AA Balkema/Rotterdam and Oxford & IBH Publishing Co. Pvt. Ltd., New Delhi, 1994, pp. 3-10.
- R. Mohanraj and P. A. Azeez, “Urban Development and Particulate Air Pollution in Coimbatore City, India,” International Journal of Environmental Studies, Vol. 62, No. 1, 2005, pp. 69-78.
- P. K. Sarangi and P. C. Mishra, “Ambient Air Quality of Jyotivihar, Orissa, India,” Pollution Research, Vol. 16, No. 1, 1997, pp. 33-35.
- E. Asrari, P. N. Sen and M. Masoudi, “Status of Carbon Mono Oxide in Tehran City—Iran,” Pollution Research, Vol. 26, No. 4, 2007, pp. 531-535.
- D. P. Tripathy, “Assessment of Impacts of Mine Fires on Air Quality—A Case Study,” Pollution Research, Vol. 25, No. 1, 2006, pp. 9-11.
- S. C. Katiyar, D. T. Khathing and K. K. Dwivedi, “Characterization of Exhaust Emissions from Gasoline and Diesel Powered Vehicles,” Pollution Research, Vol. 22, No. 1, 2003, pp. 1-14.
- T. U. Madhuri, T. Srinivas and K. Ramakrishna, “A Study on Automobile Exhaust Pollution with Regard to Carbon Monoxide Emissions,” Nature, Environment and Pollution Technology, Vol. 2, No. 1, 2003, pp. 473-474.
- G. V. Rosaline and R. Elangovan, “Ambient Air Quality Assessment of Major Air Pollutants at Selected Stations in Salem City,” Nature, Environment and Pollution Technology, Vol. 5, No. 2, 2006, pp. 277-282.
NOTES
*Present Address: Environmental Impact Assessment Division, Sálim Ali Centre for Ornithology and Natural History (SACON), Anaikatti (PO), Coimbatore, India.