Journal of Financial Risk Management
Vol.05 No.01(2016), Article ID:64253,7 pages
10.4236/jfrm.2016.51002
Classification of Risk Perceptions of Trading Firms
Gokhan Cinar1, Ferruh Isin2, Adnan Hushmat3
1Department of Agriculture Economics, Adnan Menderes University, Aydın, Turkey
2Department of Agriculture Economics, Ege University, Izmir, Turkey
3Department of Business Administration, Antalya International University, Antalya, Turkey

Copyright © 2016 by authors and Scientific Research Publishing Inc.
This work is licensed under the Creative Commons Attribution International License (CC BY).
http://creativecommons.org/licenses/by/4.0/


Received 25 December 2015; accepted 4 March 2016; published 7 March 2016
ABSTRACT
Risks faced by the trading firms cannot be eliminated completely due to the reasons arising from the structure of international trade. Therefore, minimizing risk and managing it well lay down the foundation of modern risk approach. The most important element of risk management is to define and categorize the risk. This study aims at perceptual description of risk within the scope of the firms exporting agricultural products in Turkey. The main purpose is to classify the risks faced by these firms. The study uses factor analysis to determine the behavioral and perceptional dimensions of the firms; and also uses multidimensional scaling in positioning the firms’ risk perceptions. The findings show that seven dimensions namely political, economic, trade, financial, food safety and goods delivery formulate risk perception of the firms. Multi-dimensional scaling technique maps the perception under two dimensions. The results of the research can be helpful for the managers of agri-products export firms in designing risk management strategies.
Keywords:
Risk Perception, Foreign Trade, Multidimensional Scaling, Factor Analysis

1. Introduction
Risk is an important management issue for the firms. Defining and understanding the risk specific to a particular firm is vital for designing suitable risk management strategies. The risk and competition in the agricultural foreign trade has seen a tremendous increase as the borders between the local and international trade disappear due to the efforts of World Trade Organization (WTO). Financial volatilities, interdependence of food commodity markets, transportation and packing problems and perishability of food items are some of the factors that limit the international trade of the agri-products. It is not possible for the firms to completely remove all the risks they face. However, they can minimize their exposure to these risks. The vital thing in risk management is to identify and describe the particular risk faced by a specific firm or industry. The identification of the sub-risks that describe a risk is done in process of identifying the risk perception and its classification. This study focuses on describing and classifying the risk perception of the firms exporting agricultural products in Turkey.
In literature, there are a lot of studies that focus on describing risk at organizational level. Most of them stress the importance of analyzing each type of risk in the context or area it belongs to (Jüttner, 2005) . Therefore, the researchers have identified major types of risk faced in trading. Some of them are management risk (Tang, 2006) , strategic risk (Ritchie & Brindley, 2007) , operational risk (Jiang et al., 2008) , customer risk (Meulbrook, 2000), competition risk (Beneito et. al., 2015) , trust risk (Spekman & Davis, 2004) , political risk (Manuj & Mentzer, 2008) , market (Miller, 1991) , natural disaster risk (Zeng et al., 2005) and security risk (Rossignol & Delvenne, 2015) . Under these major categories, there are also a number of sub-categories. The studies have shown relations among these risk types under different scenarios (Kleindorfer & Saad, 2005) . Similar risk types have also been classified under separate studies. For example, Zsidisin (2003) classifies risks faced by a firm into supply-related risks and market-related risks. Supply-related risks include risks relating to delivery and cost increase; however, market-related risks include commodity price change and patent. Hunter et al. (2004) classify risks faced by firms on the basis of risk probabilities. Jüttner et al. (2003) study risk under three major heads namely environmental risk, risk related to relations and organizational risk. Kersten et al. (2007) classify risks faced by manufacturing sector under four major heads: firm-specific risk, supply risk, demand risk and environmental risk. According to Rao & Goldsby (2009) , the environmental risks are the result of political, macro, natural and social risks. Mason & Fovil (1998) categorize risks into internal, supply-chain and external risks. Moreover, Cucchiella & Gastaldi (2006) analyze environmental risks under three sub-heads namely natural disaster, political instability, economic disequilibrium and transportation risks. Richie and Marshall characterize risks arising from the problems relating with environment, organization, industry and decisions (Rao & Goldsby, 2009) . On the other hand, operational risks are described as the risks relating to firm’s internal processes or the risks relating to the workers mistakes (Lockamy, 2011) . Jüttner et al. (2003) study these risks under the head of organizational risks. According to Tang & Musa (2011) risks faced by firms can be classified as raw-material risk, financial risk and information-flow risk. Merna & Smith (1999) analyze risk under five heads: strategic, natural, political, physical and supply-chain risks. According to them, the strategic risk includes organizational decisions.
The literature, as mentioned above, contains a number of studies classifying risk faced by the firms into various categories. The reason is that the risk classification varies depending on the conditions specific to a firm or industry. Therefore, it is important how a firm describes, perceives and gives order of preference to the risks it is faced with (Kern, et al., 2012) . The main purpose of this study is to classify risk perceptions specific to the firms involved in the foreign trade of the agricultural products in Turkey. The findings show that risk perceptions of the firms are classified under seven heads: political, commercial, economic, financial, management, delivery and food safety risk perceptions. Furthermore, multidimensional scaling technique positions the seven identified risk categories under a two dimensional scale. The findings show that political and financial risks are related with each other; management and commercial risk are close to each other; and lastly, delivery and food safety risks are related with each other.
This is a short but comprehensive introduction of the study. In the next section, data and methodology are shown. Later on, findings and discussion are provided. Lastly, conclusion is given.
2. Data and Methodology
The study uses the data obtained from the member firms of the exporters union exporting agricultural products. The data is collected using specially designed questionnaires.
2.1. Data Collection: Techniques and Instruments
The sample of the firms is selected keeping in view that it truly represents the whole agri-products exports of Turkey. The population of the research sample includes the firms exporting grain seeds, fresh fruits & vegetables, dry fruits & vegetables and olive products. The said products constitute 57 percent of total agri-products exports as well as 82 percent of herbal products exports. The firms are identified from the exporters unions of four important regions of Turkey (Aegean, Mediterranean, Istanbul, and Bursa) depending on the respective number of members. The sample size is calculated using the following formula:
 (1) (Newbold, 1995)
Here, n is the sample size, N is the population size (4 896), and p is the prediction rate (0.5 for the maximum sample size) and the probability level confidence interval (95% confidence interval, 𝜎p: 0.038265 for %7.5 margin of error from the equation of 1.96 𝜎p: 0.075). Accordingly, the sample size, determined as 167 firm, is distributed per the respective population of the regions.
2.2. Data Analysis: Techniques and Instruments
This study uses factor analysis to identify behavior and perception of the firms against risk. There are two important tests in the methodology; one of them is Bartlett test. This test checks whether the correlation matrix is a unit matrix or not; or in other words it tests whether sufficient correlation exists among the variables. It uses Chi-square statistics. The second one is KMO statistics. It tests the adequacy of sample size. It is calculated as:
 (2)
(2)
Here, aij shows partial correlation, rij represents the correlation between the observations. The acceptable value of KMO statistic is 0.70.
Multidimensional scaling is used in order to map the risk perceptions of the firms. This technique is used to see the distance among k objects, measured on the basis of p variables, on a k-dimensional (k < p) space. The stress value of the test is calculated as follows:
 (3)
(3)
Here, dij shows resulting estimated distances and kij represents actual distances. The value of the test varies between 0 and 1; the value greater than 0.20 shows week compatibility and the value close to zero shows strong compatibility.
3. Findings & Discussion
Table 1 shows general characteristics of the firms participated in the survey. 38.9 percent of them exports fresh fruits and vegetables, 9.6 percent are olive oil exporters, 29.9% grains seeds exporters and 21.6 percent are dry fruits and vegetables exporters. The firms are classified into 3 categories on the basis of market experience: having less than 11 years of experience, having more than 20 years of experience and having experience between 11 to 20 years. Based on this classification, 49.1 percent of the firms have less than 11 years of experience; whereas 19.8% of them have more than 20 years of experience.
In factor analysis, object dimensions of risk perception levels of the firms are formed. For this, the highest value that each object takes for a particular factor is identified. Later on, the objects are classified to form factors structure. The results show that the risk perceptions of the firms are classified under seven factors.1 The first one is political risk perception. It includes all the variables that show the possible political risk at local and international level (PRP1, PRP2, PRP3, and PRP4) with high factor loadings (see Table 2). This factor shows risk relating to entering into the target markets including the markets of the neighbor countries. It also represents the factors effecting competition in local market. These risks are in line with the risks described by Merna & Smith (1999) . The risks include the risks relating to political instability, regulations, agreements, custom regulations and wars.

Table 1. General characteristics of the firms.
*1 TL = 2.33 USD (Jan. 2015).
(Method: Basic Components rotation method Verimax)
Table 2. Rotated factor loading matrix of the firms’ risk perceptions.
The second factor, named as trade risk perception, represents all the risks relating to trading process (TRP1, TRP2, TRP3, TRP4) (see Table 2). It includes the risks relating to the slowdown in market money flow, increase in dishonored cheques in market in general, dishonored cheques that the particular firm have and increase in interest rates.
The third factor, named as economic risk perception, includes the risks arising from budget deficit, balance of payments at macro level and market volatility (ERA1, ERA2, and ERA) (see Table 2). The said economic risks gather under one head and describe the economic risk perception of the firms. Furthermore, the increase in production demand as a result of economic growth also shows the validity of this description of the economic risk perception. World Economic Forum (2012) describes economic risk as the risk relating to sudden shocks in demand, high volatility in commodity prices, delays in custom, exchange rate volatilities, world energy shortness, workforce deficiency and ownership and investment constraints. The findings of this study show that this extensive description of economic risk is invalid for the firms exporting agri-products. The findings show that the perceptional description of economic risk should be analyzed on different dimensions.
The fourth factor found in this study is named as financial risk perceptions. It consists of the risks arising from banking and commodity markets (FRP1, FRP2, and FRP3) (see Table 2). Tang & Musa (2011) describes the exchange rate risk, cost and price risk as financial flow risk. The results of this study describe perceptional description of financial risk from a different view.
The fifth one is named as food safety risk perceptions. It covers the possible risk in agriculture trade relating to food safety speculations, increase in bureaucratic requirements regarding food safety and increase in food safety speculations. This risk group can be considered under product risk described by Merna & Smith (1999) ; however, the one described in this study do not have clear classifications.
The sixth one is called as goods delivery risk perceptions. It includes the possible risks in international trade relating to payment methods, problems in transportation system and the way goods are delivered. This risk class is described by Cucchiella & Gastaldi (2006) as operational risk under the category of internal risk. The factors like late delivery, transportation and damaged material become the base of this risk category.
Lastly, the seventh one is described as management risk perceptions. It covers the possible risks in organizational system like not being open to innovation, lack of harmony among employees and lack of professional employees. Merna & Smith (1999) include human risks into employee mistakes and operational risk into internal organizational functions; however, the findings of this study show that the firm perceives these two risk types under a single head. Table 2 shows the rotated factor loadings matrix of the risk perceptions based on firms’ functional areas.
Risks faced by the firms are classified using factor analysis; later on, perceptional preferences are identified. Then, to position the risk perceptions of the firms, the results obtained from the factor analysis is used as input to Multidimensional Scaling (MDS) technique. Kruskal Stress test statistic and R2 of the two dimensional illustration of MDS are 0.06694 and 0.96720, respectively; ensuring appropriate compatibility between the dimensions and interpretability of the results obtained. All the risk perceptions do not position very close to each other. However, financial and political risk perceptions cluster in one group, economic risk perception clusters alone, trade and management risk perceptions cluster in another group and the risk perceptions relating to goods delivery and food safety cluster in a separate group. Furthermore, the trading risk perception is the closet to the average. The risk perceptions farthest to each other, with the matrix value 17.559, are relating to economic and management. Likewise, food safety and political risks are perceived different, with the matrix value 17.153, by the firms. On the other hand, the risks perceived as the most similar with each other, with the matrix value 12.092, are relating with trade and management. According to the two dimensional illustration, the trade and management risks are completely different from the risks arise due to the factors external to the firms. Likewise, the possible risks relating with product standards like goods delivery and food safety completely differ from the rest (see Figure 1).
4. Conclusion
The purpose of this study is to classify risk perceptions specific to the firms involved in the foreign trade of the agricultural products in Turkey. The study uses factor analysis to determine the firms’ behavior and perceptional dimensions. The results show that the risk perception of the firms can be classified under seven heads: political, commercial, economic, financial, management, delivery and food safety risk perceptions. Moreover, multi-di-
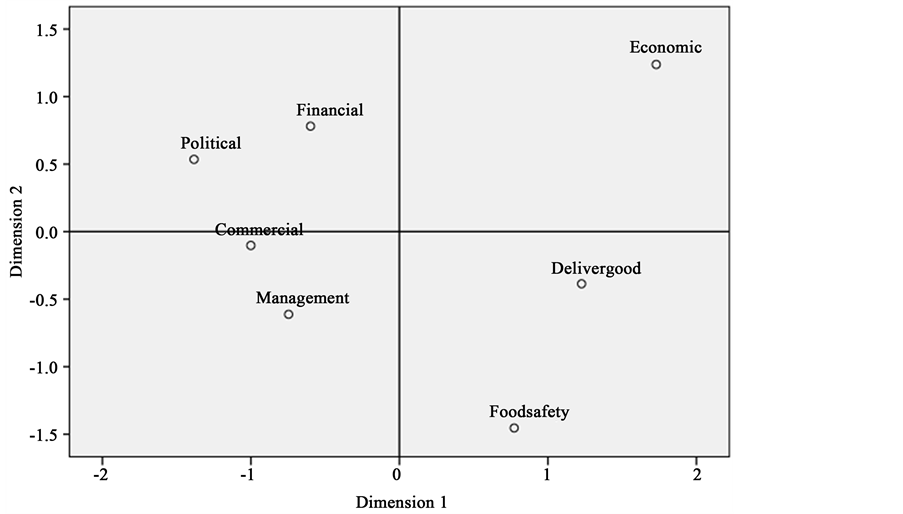
Figure 1. Positioning of the firms risk perceptions on two dimensional space.
mensional scaling technique positons the seven identified risk categories under a two dimensional scale. The findings show that political, financial and economic risk perceptions are above average.
On the other hand, goods delivery and food safety risks are classified under one head. This category can also be described under operational risks. Furthermore, the risk relating with trade and management are grouped under single category. These risks types are related with firm’s internal dynamics. Successful management is vital in this category. Lastly, political and financial risks are also perceived together by the firms.
The findings of this study will help the firms, engaged in agriculture trading business, in designing risk management strategies on the basis of risk perception preferences and making rational decisions.
Acknowledgements
This study besides being a part of doctoral thesis of the first author has been granted support, under the project number ZRF-13021, by Adnan Menderes University.
Cite this paper
GokhanCinar,FerruhIsin,AdnanHushmat, (2016) Classification of Risk Perceptions of Trading Firms. Journal of Financial Risk Management,05,7-13. doi: 10.4236/jfrm.2016.51002
References
- 1. Beneito, P., Coscollá-Girona, P., Rochina-Barrachina, M.E., & Sanchis, A. (2015). Competitive Pressure and Innovation at the Firm Level. The Journal of Industrial Economics, 63, 422-457.
http://dx.doi.org/10.1111/joie.12079 - 2. Cucchiella, F., & Gastaldi, M. (2006). Risk Management in Supply Chain: A Real Option Approach. Journal of Manufacturing Technology Management, 17, 700-720.
http://dx.doi.org/10.1108/17410380610678756 - 3. Hunter, L. M., Kasouf, C. J., Celuch, K. G., & Curry, K. A. (2004). A Classification of Business-to-Business Buying Decisions: Risk Importance and Probability as a Framework for E-Business Benefits. Industrial Marketing Management, 33, 145-154.
http://dx.doi.org/10.1016/S0019-8501(03)00058-0 - 4. Jiang, B., Baker, R., & Frazier, G. (2008). An Analysis of Job Dissatisfaction and Turnover to Reduce Global Supply Chain Risk: Evidence from China. Journal of Operations Management, 27, 169-184.
http://dx.doi.org/10.1016/j.jom.2007.09.002 - 5. Jüttner, U. (2005). Supply Chain Risk Management: Understanding the Business Requirements from a Practitioner Perspective. The International Journal of Logistics Management, 16, 120-141.
http://dx.doi.org/10.1108/09574090510617385 - 6. Jüttner, U., Peck, H., & Christopher, M. (2003). Supply Chain Risk Management: Outlining an Agenda for Future Research. International Journal of Logistics: Research and Applications, 6, 197-210.
http://dx.doi.org/10.1080/13675560310001627016 - 7. Kern, D., Moser, R., Hartmann, E., & Moder, M. (2012). Supply Risk Management: Model Development and Empirical Analysis. International Journal of Physical Distribution & Logistics Management, 42, 60-82.
http://dx.doi.org/10.1108/09600031211202472 - 8. Kersten, W., Hohrath, P., & Böger, M. (2007). An Empirical Approach to Supply Chain Risk Management: Development of a Strategic Framework. Proceeding POMS 2007 Conference 2007, Dallas, 4-7 May 2007.
- 9. Kleindorfer, P. R., & Saad, G. H. (2005). Managing Disruption Risks in Supply Chains. Production and Operations Management, 14.1, 53-68.
http://dx.doi.org/10.1111/j.1937-5956.2005.tb00009.x - 10. Lockamy III, A. (2011). Benchmarking Supplier Risks Using Bayesian Networks. Benchmarking: An International Journal, 18, 409-427.
http://dx.doi.org/10.1108/14635771111137787 - 11. Manuj, I., & Mentzer, J. T. (2008). Global Supply Chain Risk Management Strategies. International Journal of Physical Distribution & Logistics Management, 38, 192-223.
http://dx.doi.org/10.1108/09600030810866986 - 12. Mason, J. R., & Towill, D. R. (1998). Shrinking the Supply Chain Uncertainty Cycle (pp. 17-22). Cardiff: Logistics Systems Dynamics Group, Cardiff University.
- 13. Merna, A., & Smith, N. J. (1999). Privately Financed Infrastructure for the 21st Century. Proceedings of the Institution of Civil Engineers, 132, 166-173.
- 14. Miller, K. (1991). A Framework for Integrated Risk Management in International Business. Journal of International Business Studies, 23, 311-331.
http://dx.doi.org/10.1057/palgrave.jibs.8490270 - 15. Newbold, P. (1995). Statistics for Business and Economics. Upper Saddle River, NJ: Prentice Hall Int.
- 16. Rao, S., & Goldsby, T. J. (2009). Supply Chain Risks: A Review and Typology. International Journal of Logistics Management, 20, 97-123.
http://dx.doi.org/10.1108/09574090910954864 - 17. Ritchie, B., & Brindley, C. (2007). Supply Chain Risk Management and Performance: A Guiding Framework for Future Development. International Journal of Operations & Production Management, 27, 303-322.
http://dx.doi.org/10.1108/01443570710725563 - 18. Rossignol, N., Delvenne, P., & Turcanu, C. (2015). Rethinking Vulnerability Analysis and Governance with Emphasis on a Participatory Approach. Risk Analysis, 35, 129-141.
http://dx.doi.org/10.1111/risa.12233 - 19. Spekman, R. E., & Davis, E. W. (2004). Risky Business: Expanding the Discussion of Risk and the Extended Enterprise. International Journal of Physical Distribution & Logistics Management, 34, 414-433.
- 20. Tang, C. S. (2006). Perspectives in Supply Chain Risk Management. International Journal of Production Economics, 103, 451-488.
http://dx.doi.org/10.1016/j.ijpe.2005.12.006 - 21. Tang, O., & Musa, S. N. (2011). Identifying Risk Issues and Research Advancements in Supply Chain Risk Management. International Journal of Production Economics, 133, 25-34.
http://dx.doi.org/10.1016/j.ijpe.2010.06.013 - 22. World Economic Forum (2012). New Models for Addressing Supply Chain and Transport Risk Report.
- 23. Zeng, A. Z., Berger, P. D., & Gerstenfeld, A. (2005). Managing the Supply-Side Risks in Supply Chains: Taxonomies, Processes, and Examples of Decision-Making Modeling. In A. Z. Zeng, & P. D. Berger (Eds.), Applications of Supply Chain Management and E-Commerce Research (pp. 141-160). New York: Springer.
http://dx.doi.org/10.1007/0-387-23392-X_5 - 24. Zsidisin, G. A. (2003). A Grounded Definition of Supply Risk. Journal of Purchasing and Supply Management, 9, 217-224.
http://dx.doi.org/10.1016/j.pursup.2003.07.002
NOTES

1The value of KMO test is 0.721 (Chi-square = 1999.427, Std. Dev. 276, p = 0.000 < 0.05) which means sample size used in this study is adequate.