International Journal of Clean Coal and Energy
Vol.03 No.02(2014), Article ID:46772,9 pages
10.4236/ijcce.2014.32003
Analysis on the Governing Reactions in Coal Oxidation at Temperatures up to 400˚C
Jing Zhan, Haihui Wang*, Feng Zhu, Shengnan Song
State Key Laboratory of Fire Science, University of Science and Technology of China, Hefei, China
Email: *hhwang4@ustc.edu.cn
Copyright © 2014 by authors and Scientific Research Publishing Inc.
This work is licensed under the Creative Commons Attribution International License (CC BY).
http://creativecommons.org/licenses/by/4.0/


ABSTRACT
The present study aims to further understanding of the principal reactions that occur during coal oxidation at moderate temperatures. Mass change and heat evolution of a sample were monitored by thermo-gravimetric analysis coupled with differential thermal analysis (TGA/DTA). Gaseous and solid products were traced using online or in situ Fourier trans- form infrared spectroscopy (FTIR). Measurements were conducted by heating the samples up to 400˚C, with the O2 concentration in the reaction medium set at 0, 10, 21, and 40 vol%, respectively. It was observed that the mass increase of a sample between 150˚C and ~275˚C was a result of the accumulation of C=O containing species in the coal structure, whereas substantial mass loss and heat evolution of a sample at ~400˚C can be attributed to the significant involvement of the direct “burn-off” reaction. Enrichment of O
Keywords: Coal; Oxidation at Moderate Temperatures; Reaction Product; Governing Reaction; Self-Heating; Spontaneous Combustion
1. Introduction
Coal oxidation at moderate temperatures (≤400˚C) alters the coal properties as fuel, thereby making pronounced impact on its subsequent utilization [1] [2] . As an exo- thermic phenomenon, coal oxidation has direct link to self-heating and spontaneous combustion of coal, which poses fire hazard in coal industries. Up to date, enormous efforts have been made to understand the chemistry and heat effects of the oxidation process [1] - [4] .
*Corresponding author.
Coal oxidation at moderate temperatures is a complicated process affected by several factors, including coal compositions, temperature and oxygen concentration in the environment [1] - [3] . As stated in the literature [2] [3] the rate of oxygen consumption almost doubles by every increment of 10˚C at temperatures below 90˚C. At a spe- cific temperature, an oxygen-enriched environment may result in acceleration in the oxidation rate, thereby pro- ducing a larger amount of heat during this process.
In the past two decades, typical research work on the effect of temperature on coal oxidation can be attributed to the observations based on the thermo-gravimetric ana- lysis (TGA) and associated techniques. Crelling and co- workers [5] monitored the temperature-dependent mass change of a series of coals oxidized in the aerial atmos- phere, and then suggested several temperature parameters to describe the profile of the TG curves collected. The parameters below 400˚C include “temperature of initial chemisorptions” T1, “temperature of maximum rate of chemisorptions” T2, and “temperature of combustion on- set” T3. Based on these temperature parameters, He and Wang [6] proposed four stages of the coal oxidation at low and moderate temperatures, i.e., moisture vaporiza- tion, mass increase by absorbing oxygen, degradation caused by heating, and combustion. The rate of mass in- crease at the second stage was defined and then utilized to evaluate the propensity of various coals towards spon- taneous combustion [6] [7] .
So far, significant progress has been made in under- standing the mechanism of coal oxidation. It has been identified that two independent reaction sequences pro- ceed during the oxidation process, and one of them is the chemisorption sequence [2] [4] [8] . Chemisorption se- quence consists of several steps, including the chemi- sorption of oxygen, as well as formation and decompose- tion of unstable carbon-oxygen complexes (intermediates). The other reaction sequence is the so-called direct “burn- off” reaction, which occurs at specific sites in the coal structure. Given that the intermediate process is signifi- cantly rapid, direct “burn-off” reaction is described as a simultaneous formation of the gas products, i.e., CO2, CO, and H2O. These two reaction sequences are briefly depicted as follows:
 (1)
(1)
Received 17 March 2014; revised 21 April 2014; accepted 23 May 2014
 (2)
(2)
Although the occurrence of the direct “burn-off” reac- tion at low temperatures (<150˚C) has been verified by the existing measurements and theoretical analysis [2] [4] [8] [9] , the dependence of this reaction to temperature and its relationship with the chemisorption sequence have not been clearly elucidated. In addition, extensive measurements have been conducted to verify the effect of O2 concentration on coal oxidation; however, no rigo- rous efforts have been made to understand the role of O2 molecules in altering the multi-step reactions that occur during the oxidation process.
The present study aims to further understanding of the principal reactions that occur during coal oxidation at moderate temperatures and lay a methodical basis for developing new techniques to characterize the coals and to assess their propensity towards self-heating and spon- taneous combustion. Using TGA and differential thermal analysis (DTA) coupling technique, the mass change and heat evolution are measured during coal oxidation un- der various oxygen concentrations and at temperatures up to 400˚C. Gas and solid products formed on coal surfaces are also monitored by means of a TGA in connection with a Fourier transform infrared spectrometer (TGA/ FTIR), as well as an in-situ FTIR technique. The nature of different reactions and their inherent relationships are then explored based on a series of experimental results obtained.
2. Experimental
A bituminous coal was collected from Yanzhou Colliery, Shandong Province. The coal was crushed and ground into particles. Size distribution of the particles was meas- ured using laser particle-size-distribution tester JL-1177, and the volumetric mean diameter of the particles (D [v, 0.5]) was found to be ~1.6 μm. Fine coal particles were used to eliminate the possible reaction regime controlled by gas diffusion in coal pores during the oxidation pro- cess [2] [10] . Proximate and ultimate analyses of the coal are given in Table 1.
A TGA/DTA instrument was used to evaluate pyroly- sis and oxidation behaviors of raw coal samples, and the one adopted was a Shimadzu DTG-60H thermal analysis system with a nominal resolution of mass of 0.1 μg. DTA signals at a sensitivity of 0.1 μV were directly converted into heat flow rates in the units of mW per sample cur- rent mass using a manufacturer-provided software. A sample of ~10 mg in mass was quickly and loosely placed on the aluminum crucible. The sample tempera- ture was then raised from room temperature to 400˚C at a heating rate of 4˚C/min. Such a low heating rate employed was to reduce the thermal lag of a sample during heating.

Table 1. Proximate and ultimate analyses for the coal used in the current study.
Flow rate of the atmosphere purging into the furnace was set at
Coupled with a TGA (TA Q5000IR) instrument, an online FTIR spectrometer was used to trace the effluent gas products of a sample. During the measurement, the gas line was maintained at 230˚C, and the spectra were picked up in the range between 4000 and 400 cm−1. Solid products on coal surfaces were traced using an in-situ FTIR spectrometer, equipped with a high temperature reaction chamber, a Bruker IFS 66V/S spectrometer, and a diffuse reflectance accessory (Praying Mantis™, Har- rick). A sample was placed in the reaction chamber, and the gas medium with specific O2 concentration was then introduced into the chamber slowly. A measurement commenced after 30 min of gas environment preparation. The spectra of the solid surface at various temperatures were collected between 4000 and 700 cm−1. These two types of FTIR measurements were both started by heat- ing the samples from the ambient temperature to 400˚C at 4˚C/min. During the operation of the spectrometers, the scanning times for both the background and sample were set to 32 at a resolution of
3. Results and Discussion
3.1. Phenomena Observed by Analytical Instrumentations
The TG/DTA data for the samples either under N2 or aerial atmosphere are shown in Figure 1. As shown by the TG results collected under N2 atmosphere, the sample mass undergoes progressive decrease with the tempera- ture increase. The mass loss becomes significant at tem- peratures > 350˚C. Negative values of the DTA signals were obtained at the beginning of the measurement, but immediately returned to zero and remained constant throughout the measurement. Under aerial atmosphere, the sample undergoes a slight decline in its mass, which corresponds to the endothermic stage of the DTA signals. Afterwards, the sample mass displays progressive in- crease, and then reaches the maximum at ~275˚C; meanwhile, the DTA data become positive, and the rate of heat flow reaches its maximum at ~300˚C. As the temperature increases further, the sample mass begins to decrease rapidly, whereas the rate of heat flow exhibits a decline followed by a considerable increase. The trends displayed by the DTA curve for the sample under the
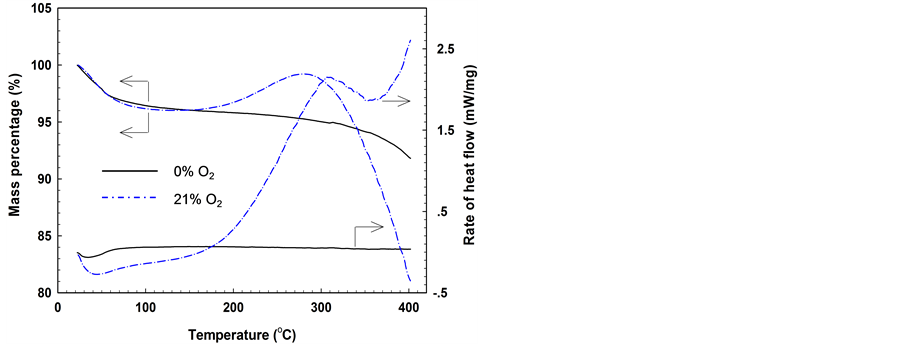
Figure 1. TG and DTA curves obtained by heating the samples either in nitrogen or air at a rate of 4˚C/min.
aerial atmosphere are consistent with those reported by Banerjee and co-worker [11] .
During pyrolysis of a sample in nitrogen, the mass loss at the initial stage is mainly ascribed to the removal of moisture. The progressive mass change between 150˚C and 300˚C indicates a low rate of decomposition reactions. At ~350˚C, the decomposition reactions begin to accele- rate, resulting in significant mass loss. For the sample under oxidation in air, the initial mass loss was also mainly led by water evaporation, which is demonstrated by the negative values in the rate of heat flow. As a result of oxygen uptake and formation of solid oxygenated complexes, the sample mass starts to increase, and the corresponding rate of heat flow becomes positive. After reaching the maximum at ~275˚C, the sample mass tends to decrease with the further increase in temperature. This is a sign to indicate the acceleration in the rate of thermal decomposition (endothermic) reactions: on one hand, it makes the sample mass decrease; on the other hand, the heat absorbed by the thermal decomposition of unstable oxygenated complexes offsets in part the heat evolved by the oxygen chemisorption, thereby reducing the rate of heat flow. The DTA curve rebounds again after slight decrease, which is assigned to the significant mass loss shown in the TG curve. This phenomenon suggests that another exothermic reaction comes into action at this stage.
The variations of the TG and DTA curves for the sam- ple heated in aerial atmosphere are essentially related to the multiple reactions that occur during the oxidation process. By contrast, the sample heated under nitrogen atmosphere always undergoes thermal decomposition reactions throughout the measurement. The obvious dif- ferences shown by these two sets of TG/DTA curves in- dicate that the reaction medium plays an important role in altering the behavior of a coal sample during heating.
Li et al. [12] reported their TG/DTA results for oxida- tion of a bituminous coal and several types of refuse- derived fuels. The trends of mass change and the cumulative heat for all of the samples observed in the temper- ature range between 0˚C and 400˚C are similar to those described in the present study. Instead of providing de- tailed analysis on the experimental data, they stated that the progressive increase in mass and the rate of heat flow at temperatures > 120˚C is due to the reactions induced by oxygen adsorption.
The TG curve obtained under aerial atmosphere was analyzed using the parameters defined by Crelling et al. [5] , with three characteristic temperatures found below 400˚C. Given the fluctuation of the derivative TG (DTG) data at temperatures between 120˚C and 170˚C, the pa- rameter T1 falls between 130.1˚C and 168.0˚C, whereas the parameters T2 and T3 are evaluated at 238.4˚C and 276.2˚C, respectively. T3 cannot be considered as the “onset temperature of combustion”, because the corres- ponding DTA data did not illustrate a drastic increase at temperatures > T3. Direct scanning electron microscope (SEM) images also show no sign of combustion for the sample even after heating to 400˚C in air.
Gaseous species formed during the coal oxidation process were traced using an online FTIR spectrometer; the absorption intensities observed at various tempera- tures are reported in Figure 2. It is evident that within the temperature range studied, the gaseous species released are CO2 (2400 cm−1 -
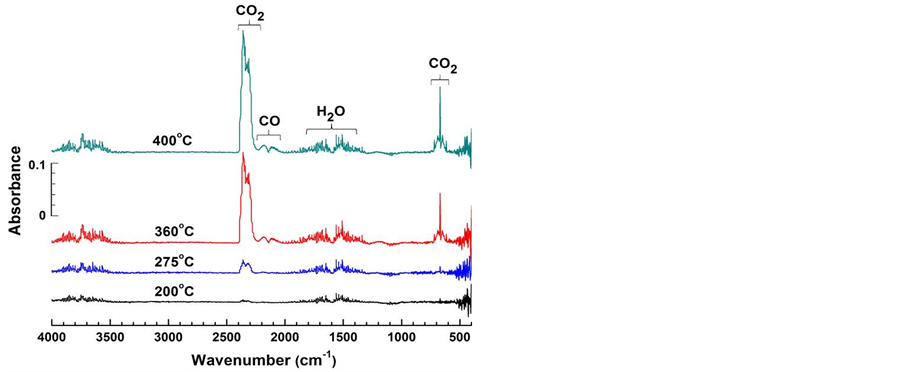
Figure 2. FTIR spectra of gas products evolved at various temperatures for a sample heated at 4˚C/min in air.
FTIR spectra of the solid species obtained at various temperatures during the sample oxidation in air are shown in Figure 3. The major absorption peaks and their cor- responding species (organic functional groups) were iden- tified and labeled. The observed species usually contain O-H, C-H, C=C, C-O, and C=O bonds [15] [16] . Chan- ges in the functional groups on the sample surfaces were further examined by subtracting FTIR spectra collected at various temperatures (Figure 4). The curve a in Figure 4, which is the subtracted FTIR spectra for a sample at room temperature from those obtained after heating to 275˚C in nitrogen, indicates that a coal sample mainly experiences the water removal and hydroxyl decomposi- tion in an inert atmosphere [14] [16] .
Significant changes have been observed in the major absorption bands for the sample oxidized at 275˚C (curve

Figure 3. FTIR spectra observed on the surfaces of a sample at various temperatures during heating at 4˚C/min in air.

Figure 4. Comparisons of the subtracted FTIR spectra for the samples at ambient temperature from those after heating to 275˚C either in nitrogen (a) or in air (b), as well as the spectra for the sample oxidized to 275˚C from those after heating to 400˚C in air (c).
b in Figure 4). The weakening of the bands in the region 3680 cm−1 - 3100 cm−1 is also due to water removal and decomposition of hydroxyls. The intensities of the peaks for νC-H (ν: stretching vibration) (3050 cm−1 - 2800 cm−1) and δC-H (δ: bending vibration) (1450 cm−1) decrease significantly, indicating loss of hydrocarbon species un- der the aerial atmosphere [4] [17] . Strong positive ab- sorption peaks centered at ~1760 cm−1 appear, implying the formation of abundant oxygenated complexes con- taining C=O bonds. It is suggested that the oxidation products formed at ~275˚C are mainly those containing C=O bonds, including aldehydes and carboxylic acids.
The subtracted FTIR spectra for a sample oxidized at 275˚C from those after heating to 400˚C in air are shown as curve c in Figure 4. The appearance of the negative absorption bands at 3630 cm−1 - 3100 cm−1 for νO-H demonstrates that with the further increase in temperature, hydroxyls continue to be condensed or oxidized. Similar to curve b in Figure 4, the negative bands assigned to νC-H (3100 cm−1 - 2800 cm−1) and δC-H (1450 cm−1) are still strong, thereby indicating accelerated rate of oxida- tion reactions with alkyls. The strong positive absorption peaks of C=O at higher bands (2000 cm−1 - 1720 cm−1) mainly belong to the anhydrides and esters [4] [15] . Weak negative absorption bands of C=O appear in the region of 1720 cm−1 - 1670 cm−1, corresponding to alde- hydes and carboxylic acids. At higher temperatures, more anhydrides and esters are formed as a result of the oxida- tion of alkyls and the decomposition (or condensation) reactions of carboxylic acids [15] [17] . In addition, the decomposition and condensation reactions among the existing complexes containing C=O bonds may cause a loss of certain C=O bonds [4] [18] .
3.2. Effect of Oxygen Concentration on the Coal Oxidation
The TG curves for coal samples oxidized at different oxygen concentrations are compared in Figure 5(a).
These curves have similar variation patterns, which al- most overlap at the initial stage. With the increase in oxygen concentration, the mass increase peak rises, whereas the peak temperature decreases. In the higher temperature region, an increase in oxygen concentration results in more significant decrease in the TG curve, in- dicating acceleration in the mass loss rate of a sample. The residual mass at the conclusion of the measurements decreases by ~7 wt% with an increase of O2 concentra- tion from 10 to 40 vol%.
As shown in Figure 5(b), the water evaporation pro- cess contributes to the variation in the DTA curves at the initial stage. At the stage of mass increase of a sample, the rate of heat flow increases more significantly with the increase in O2 concentration, which corresponds to an increased amount of heat evolved. The rate of heat flow decreases slightly at a temperature exceeding ~300˚C, but rebounds at ~360˚C. The rate increment between ~360˚C and 400˚C consistently increases with the increa- se in O2 concentration.
Several parameters are defined to characterize these TG and DTA curves, including three characteristic tem- peratures, the percentage of mass increase at ~275˚C, the amount of heat evolved in association with the sample mass increase, and the percentage of increase in the heat flow rate at 400˚C. The parameter Tc1 is the temperature of the complete water evaporation, i.e. the starting point at which the rate of heat flow becomes positive. Tc2 is the peak temperature at the mass increase stage, whereas Tc3 is the second transition temperature of the exothermic peak in the DTA curve (Figure 5(a) & Figure 5(b)). The per- centage of mass increase at ~275˚C is determined by sub- tracting the minimum sample mass at ~150˚C from the maximum mass between 150˚C and 300˚C, and divided by the minimum sample mass at ~150˚C [16] . The amount of heat evolved in association with the sample mass in- crease is obtained by integrating the exothermic peak area of the DTA curve between Tc1 and Tc3 (Figure 5(b)).

Figure 5. TG (a) and DTA (b) results measured for coal samples oxidized under different oxygen concentrations.
The percentage of increase in the heat flow rate at 400˚C is defined by the heat flow rate at 400˚C minus that at Tc3 and then divided by that at Tc3. The results of these pa- rameters are given in Table 2.
As shown in Table 2, with the increase in oxygen concentration, Tc2 and Tc3 decrease, but the percentage of mass increase at ~275˚C, the associated amount of heat evolved, and the percentage of increase in the heat flow rate at 400˚C increase. For the oxygen concentration va- rying from 10 vol% to 21 vol%, the percentage of mass increase grows from 2.74% to 3.35% (0.61% increase). However, once the oxygen concentration varies from 21 vol% to 40 vol%, the extent of increase is only 0.22%. A continuously increasing trend is observed for the asso- ciated amount of heat evolved. These results suggest no linear dependence between the percentage of mass in- crease and the associated amount of heat evolved at va- rying oxygen concentrations. This is understandable, be- cause the mass increase and the heat release are the com- prehensive performance of a series of exothermic and endothermic reactions taking place during the oxidation process.
Temperature-dependent emission of CO2 for the coal samples oxidized under different oxygen concentrations is shown in Figure 6. For a specific measurement, the absorption intensity of CO2 varies in consistency with the corresponding rate of heat flow (refer to Figure 5(b)), and its variations can be split into two distinct phases. The first phase is between 200˚C and 360˚C for the sam- ple oxidized in air. With the temperature increase, the intensity of the absorption peak grows progressively, fol- lowed by a quasi-steady increase at temperatures > 300˚C. These results somehow reflect the variation trends in the rate of decomposition reactions. In the second phase (³360˚C), the rate of CO2 production undergoes more drastic and persistent increase, indicating the commen- cement of a different mechanism of gas evolution.
Consistency in the patterns of gas evolution at these two consecutive phases has been observed in the mea- surements at various O2 concentrations. By recalling the variation trends of the DTA signals (Figure 5(b)), we confirm that at temperatures > ~360˚C, the gas products may be sourced by an extra formation mechanism, and oxygen plays a role in both promoting the rate of CO2 formation and the amount of heat evolved. There is no doubt that only the direct “burn-off” reaction serves these purposes.
The compositions on coal surfaces traced during the oxidation under 40 vol% O2 by using an in-situ FTIR spectrometer are compared to those under 10 vol% O2 (Figure 7). Curves a1 and a2 are the subtracted FTIR spectra for the samples at ambient temperature from those after heating to 275˚C. With the increase in O2
Table 2. List of the data for Tc2 and Tc3, percentage of mass increase at ~275˚C, the amount of heat evolved in association with the sample mass increase, and the percentage of increase in the heat flow rate at 400˚C.
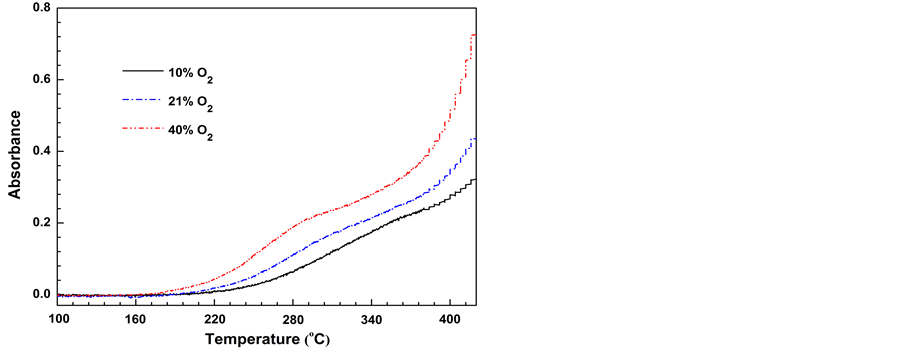
Figure 6. Temperature-dependent FTIR absorbance for CO2 evolved from coal samples oxidized under various oxygen con- centrations.

Figure 7. Comparisons of the subtracted FTIR spectra for the samples oxidized in the atmospheres containing 10 (a1 & b1) and 40 vol% O2 (a2 & b2), respectively. Curves a1 & a2 were obtained by subtracting the spectra of the samples at ambient from those after heating to 275˚C under 10 or 40 vol% O2, and curves b1 & b2 were generated by subtracting the spectra of the samples oxidized to 275˚C from those after heating to 400˚C.
concentration from 10 vol% to 40 vol%, the negative absorption intensity of νC-H bands (3100 cm−1 - 2800 cm−1) increases; meanwhile, the positive absorption inten- sity of νC=O bands (1880 cm−1 -
The phenomena observed above correspond to the fol- lowing reaction steps:
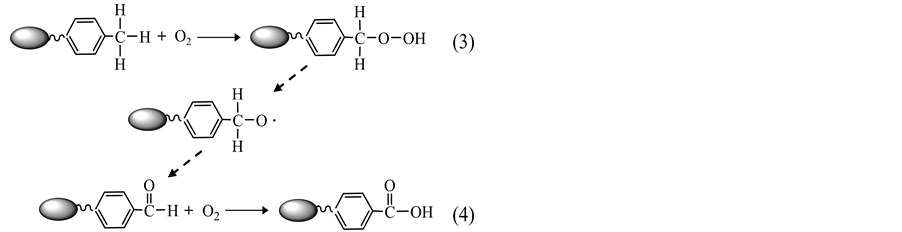
where Reaction 4 contains a few sub-steps in principal, including the activation of carbonyl species by chain carriers (H-O) and the subsequent formation of peroxides at the carbon centers [2] [4] [8] .
It is evident that an increase in the oxygen concentra- tion speeds up the rates of these two reactions. This has been reflected by an increase in the percentage of mass increase at ~275˚C. The increased rates of these reactions implies an increase in the amount of heat released, i.e. the enlarged exothermic peak area on the individual DTA curves (refer to Figure 5(b) and Table 2).
Obvious differences are also observed between the subtracted FTIR spectra for the samples oxidized at 275˚C and those after heating to 400˚C, for example, cur- ve a2 versus b
Following the above statements, it is straightforward to establish that the considerable difference in mass loss at the end of the measurements for the samples oxidized in either an oxygen-leaned or oxygen-enriched environ- ment is essentially contributed by the direct “burn-off” reaction, rather than the chemisorption sequence. This happens only when a shift of the governing reactions is performed from the chemisorption sequence, which is primarily operated at temperatures below 360˚C, to the direct “burn-off” reaction at the temperatures above 360˚C.
3.3. Characterization of the Oxidation Process at Different Temperature Ranges
As demonstrated by the TG and DTA results, identical trends are exhibited for the samples oxidized in various oxygen concentrations (Figure 5). Comparable patterns of the mass change and heat evolution have been re- ported in the literature for various types of coals and biomass using the same experimental approach [6] [7] [12] . Thus, TG/DTA curves are used to characterize the coal oxidation process at different temperature ranges. Based on the TG/DTA curves obtained by oxidation mea- surement in air, the oxidation process can be divided into the following typical stages: 1) water evaporation (T ≤ Tc1), 2) oxygen chemisorption (Tc1 < T ≤ Tc2), 3) signifi- cant decomposition reactions (Tc2 < T ≤ Tc3), and 4) the stage dominated by the direct “burn-off” reaction (T > Tc3) (Figure 8).
As is well known, coal contains certain amount of wa- ter, and during its oxidation below Tc1, the exothermic oxidation reactions and endothermic water evaporation coexist. Given that the amount of heat released by the former is smaller than that absorbed by the later, negative values are presented on the DTA curve at this stage.
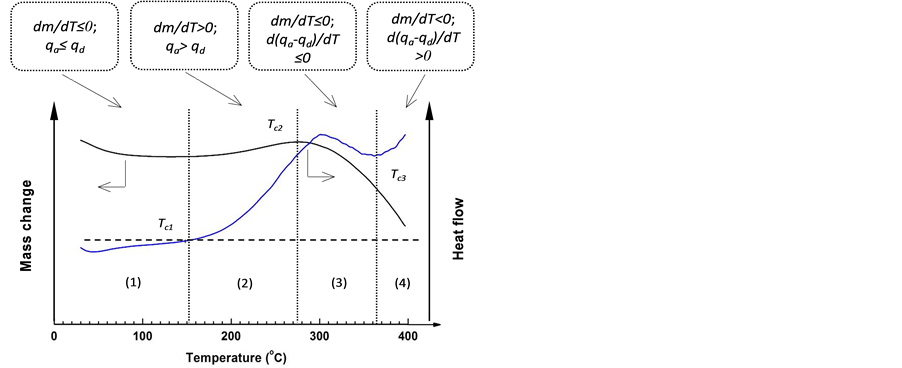
Figure 8. Four stages of coal oxidation up to 400˚C determined by a set of TG/DTA curves: (1) Water evaporation; (2) Oxygen chemisorption; (3) Significant decomposition reactions; and (4) The stage dominated by direct “burn-off” reaction.
Meanwhile, the mass loss led by water evaporation is much larger than the mass increase due to oxygen ad- sorption, thereby resulting in the observed decline in the TG curve.
At the stage of oxygen chemisorption, the internal coal pores begin to expose to the oxidation medium because of water removal; hence, the rate of chemisorption in- creases. The mass increase of a sample reaches the maxi- mum at ~275˚C. At this stage, the decomposition of un- stable oxygenated complexes does occur, and the amount of heat evolved is the compromised result of the instan- taneous heat of exothermic chemisorption reactions (qa) and that of endothermic decomposition reactions (qd). Given that thermal decomposition of unstable oxygen- nated complexes is a relatively slow process at tempera- tures between Tc1 and Tc2, the amount of heat released increases with the temperature rise, which has been dis- played by the DTA curves. The associated infrared spec- tra for solid products also clearly show that these phe- nomena are primarily contributed by the chemisorption of O2 and the formation of the species containing C=O bonds, as a result of interaction of the active groups in coal structure with O2.
Significant decomposition reactions occur at tempera- tures between Tc2 and Tc3, and the rate of heat evolution by oxygen adsorption is not enough to offset that con- sumed by the thermal decomposition reactions in general, i.e. d(qa − qd)/dT ≤ 0. Therefore, the amount of heat re- leased (qa − qd) reduces, which is illustrated by a decline in the rate of heat flow. Accordingly, the sample mass de- creases because of the accelerated decomposition reactions (refer to Figure 5 & Figure 6). These results show that the oxygenated complexes containing C=O bonds are relatively stable below Tc2 (<300˚C), whereas obvious decomposition occurs at temperatures ³ 300˚C, resulting in a reduction of the total amount of heat released. For this reason, Tc2 can be treated as the critical temperature at which a considerable amount of oxygenated complex- es begin to decompose. This understanding is consistent with the statements of Berkowitz [19] regarding the sta- bility of humic acids that contain such functional groups.
As the temperature increases further (>Tc3), the “burn- off” reaction is remarkably accelerated, which contri- butes to the drastic decline in the TG curves and a rapid increase in the DTA signals. Consequently, the stage of significant decomposition reactions is replaced by the stage dominated by the “burn-off” reaction. Worthy of mentioning, a coal sample at this stage is definitely not at the “real” status of combustion or burning, which has been verified by SEM observations on the sample col- lected after heating to 400˚C in air.
In the literature [5] , the characteristic temperatures are determined solely based on TG and the DTG data. As a result, these characteristic temperatures have no direct link to chemical reactions and the associated heat re- lease in coal oxidation. The definition of these characte- ristic temperatures is also questionable. Parameter T1 is named as the “temperature of initial chemisorption”, which is the first transition point at which the TG curve shifts from mass loss to mass gain. In fact, chemisorption starts from the beginning of a test, even though the mass gain by O2 adsorption is concealed by the mass loss be- cause of water evaporation below T1.
Crelling et al. [5] defined the parameter T2 as the “temperature of maximum rate of chemisorptions”, i.e., the first peak temperature on a DTG curve. The oxidation of coal is not a simple oxygen adsorption process, and the phenomenon of mass increase is the overall reflection of a series of reactions leading to mass gain and loss; therefore, we are unable to expect a direct link between the maximum rate of chemisorptions and the maximum rate of mass increase. The “temperature of combustion onset”, T3, is actually the temperature at which a sample mass reaches its maximum, which is equivalent to Tc
Once the rank of coal is very high, its volatile matter content becomes low, which implies a smaller amount of C-H bonds stored in the coal structure and fewer carbon centers available for the oxygen chemisorption reactions. As a result, the stage of significant decomposition reac- tions tends to be limited, which can be seen from the typical DTA or differential scanning calorimeter (DSC) results for the semi-anthracite or anthracite [20] [21] . As the carbon content is maintained at ~90%, the decline segment on the DSC curve (at the temperatures usually £Tc3) may disappear. Under this circumstance, the stage of significant decomposition reactions is then replaced by that dominated by the direct “burn-off” reaction.
The consistent decrease in the values of Tc2 and Tc3 for the samples oxidized under the oxygen concentrations from 10 to 40 vol% is an indication of the role of O2 mo- lecules in altering the oxidation process. The presence of O2 triggers the formation of the transient intermediates (Reaction 3) and their further oxidation into aldehydes and other oxygenated complexes (e.g., Reaction 4). An increase in oxygen concentration implies the accelera- tion in the rates of oxygen chemisorption and formation of solid oxygenated complexes, leading to a growth in both the percentage of mass increase at ~275˚C and the associated amount of heat evolved. In addition, enrich- ment of O
Shift in the governing reactions at various tempera- tures is an overall reflection of the temperature effect on these reactions, which are particularly due to their di- verse requirements of reactants and the energy barriers to overcome. Desorption of water requires overcoming the minimum energy barriers and makes it available for O2 molecules to access the unveiled active carbon centers in coal pores [22] . Because of the lower energy barriers for oxygen adsorption (both physical and chemical), chemi- sorption of oxygen proceeds relatively easily compared with the direct “burn-off” reaction, especially at low tem- peratures [2] [8] . High temperatures (>360˚C) and the deformed coal structure, which is a consequence of the significant decomposition reactions, provide both energy and material basis for rapid progress in the direct “burn- off” reaction.
In engineering practice, coal may not be always ex- posed to a flowing environment, and when water is re- moved to a certain extent, the remaining water could act as a catalyst to the oxygen chemisorption reactions [2] . Oxygen chemisorption reactions provide initial energy for the self-heating of coal in the absence of external heat sources. When the temperature is high enough, the coal eventually moves toward spontaneous combustion be- cause of the significant involvement of the direct “burn- off” reaction. The self-heating and spontaneous combus- tion phenomena of coal not only correspond to two dis- tinct stages in the oxidation process, but also are con- trolled by these two major reactions, respectively. From this standpoint, in the assessment on the propensity of a coal towards self-heating and spontaneous combustion, appropriate methods should be used to focus on either the oxygen adsorption capacity or the capability of coal to participate in the direct “burn-off” reaction.
4. Concluding Remarks
During the oxidation at <~275˚C, the alkyl chains in coal structure are converted into C=O containing species, leading to the increase in sample mass and the associated amount of heat evolution. At temperatures ~400˚C, the direct “burn-off” reaction of hydrocarbon species, which is responsible for the higher rate of CO2 emission of a sample, becomes dominated.
An increase in oxygen concentration in the reaction medium results in an increased amount of heat evolved and a decreased temperature threshold for initiating sig- nificant thermal decomposition reactions. The presence of sufficient oxygen speeds up the oxidation process by primarily promoting oxygen chemisorption, formation and decomposition of the solid complexes containing C=O groups, as well as the direct “burn-off” reaction.
The products both in gas and solid phase, as well as the heat evolution allow the coal to demonstrate distinct characteristics during its oxidation at varying tempera- tures. With the temperature increase, the oxidation pro- cess can be classified into four typical stages, namely, water evaporation, oxygen chemisorption, significant decomposition reactions, and the stage dominated by the direct “burn-off” reaction. Temperature boundaries of these stages can be determined using the parameters de- fined based on a set of TG/DTA data.
5. Acknowledgements
In situ FTIR measurements on solid surfaces were per- formed at the infrared and far-infrared beamline station of National Synchrotron Radiation Laboratory (NSRL) in Hefei, China. We would like to thank Assoc. Prof. Zeming Qi and his colleagues for providing assistance during the measurements.
REFERENCES
[1] van Krevelen, D.W. (1993) Coal: Typology―Chemi- stry―Physics―Constitution. 3rd Edition, Elsevier, New York, 627-658.
[2] Wang, H.-H., Dlugogorski, B.Z. and Kennedy, E.M. (2003) Coal Oxidation at Low Temperatures: Oxygen Consumption, Oxidation Products, Reaction Mechanism and Kinetic Modeling. Progress in Energy and Combus- tion Science, 29, 487-513. http://dx.doi.org/10.1016/S0360-1285(03)00042-X
[3] Carpenter, D.L. and Giddings, D.G. (1964) The Initial Stages of the Oxidation of Coal with Molecular Oxygen. I. Effect of Time, Temperature and Coal Rank on Rate of Oxygen Consumption. Fuel, 43, 247-266.
[4] Clemens, A.H., Matheson, T.W. and Rogers, D.E. (1991) Low Temperature Oxidation Studies of Dried New Zeal- and Coals. Fuel, 70, 215-221. http://dx.doi.org/10.1016/0016-2361(91)90155-4
[5] Crelling, J.C., Hippo, E.J., Woerner, B.A. and West Jr., D.P. (1992) Combustion Characteristics of Selected Whole Coals and Macerals. Fuel, 71, 151-158. http://dx.doi.org/10.1016/0016-2361(92)90003-7
[6] He, Q.-L. and Wang, D.-M. (2005) Comprehensive Study on Coal Oxidation Process by TG-DTA-FTIR Techniques. Journal of China Coal Society, 30, 53-57. (in Chinese)
[7] Wang, J.-R., Deng, C.-B., Shan, Y.-F., Hong, L. and Lu, W.-D. (2008) A New Method for Classifying Tendency of Coals to Spontaneous Combustion. Journal of China Coal Society, 33, 47-50. (in Chinese)
[8] Wang, H.-H., Dlugogorski, B.Z. and Kennedy, E.M. (2003) Analysis of the Mechanism of the Low-Tempera- ture Oxidation of Coal. Combustion and Flame, 134, 107- 117. http://dx.doi.org/10.1016/S0010-2180(03)00086-5
[9] Krishnaswamy, S.K., Gunn, R.D. and Agarwal, P.K. (1996) Low-Temperature Oxidation of Coal. 2. An Expe- rimental and Modeling Investigation Using a Fixed-Bed Isothermal Flow Reactor. Fuel, 75, 344-352. http://dx.doi.org/10.1016/0016-2361(95)00177-8
[10] Wang, H.-H., Dlugogorski, B.Z. and Kennedy, E.M. (1999) Theoretical Analysis of Reaction Regimes in Low- Temperature Oxidation of Coal. Fuel, 78, 1073-1081. http://dx.doi.org/10.1016/S0016-2361(99)00016-2
[11] Banerjee, S.C. and Chakravorty, R.N. (1967) Use of DTA in the Study of Spontaneous Combustion of Coal. Journal of Mines, Metals and Fuels, 15, 1-5.
[12] Li, X.-R., Lim, W.-S., Yusaku, I. and Hiroshi, K. (2009) Safety Evaluation of Sewage-Sludge-Derived Fuels by Comparison with Other Fuels. Fire and Materials, 33, 187-200. http://dx.doi.org/10.1002/fam.991
[13] Carangelo, R.M., Solomon, P.R. and Gerson, D.J. (1987) Application of TG-FT i.r. to Study Hydrocarbon Structure and Kinetics. Fuel, 66, 960-967. http://dx.doi.org/10.1016/0016-2361(87)90336-X
[14] MacPhee, J.A., Giroux, L., Charland, J.-P., Gransden, J.F. and Price, J.T. (2004) Detection of Natural Oxidation of Coking Coal by TG-FTIR―Mechanistic Implications. Fuel, 83, 1855-1860. http://dx.doi.org/10.1016/j.fuel.2004.02.017
[15] Rose, H.R., Smith, D.R. and Vassallo, A.M. (1998) Study of the Oxidation of Oil Shale and Kerogen by Fourier Transform Infrared Emission Spectroscopy. Energy and Fuels, 12, 682-688. http://dx.doi.org/10.1021/ef9701908
[16] Zhan, J., Wang, H.-H., Song, S.-N., Hu, Y. and Li, J. (2011) Role of an Additive in Retarding Coal Oxidation at Moderate Temperatures. Proceedings of the Combus- tion Institute, 33, 2515-2522. http://dx.doi.org/10.1016/j.proci.2010.06.046
[17] Iglesias, M.J., de la Puente, G., Fuente, E. and Pis, J.J. (1998) Compositional and Structural Changes during Aerial Oxidation of Coal and Their Relations with Tech- nological Properties. Vibrational Spectroscopy, 17, 41-52. http://dx.doi.org/10.1016/S0924-2031(98)00017-4
[18] Calemma, V., Rausa, R., Margarit, R. and Girardi, E. (1988) FT-i.r. Study of Coal Oxidation at Low Tempera- ture. Fuel, 67, 764-770. http://dx.doi.org/10.1016/0016-2361(88)90147-0
[19] Berkowitz, N. (1979) An Introduction to Coal Technolo- gy. Elsevier, New York, 95-130.
[20] Pis, J.J., de la Puente, G., Fuente, E., Morán, A. and Ru- biera, F. (1996) A Study of the Self-Heating of Fresh and Oxidized Coals by Differential Thermal Analysis. Ther- mochimica Acta, 279, 93-101. http://dx.doi.org/10.1016/S0040-6031(96)90066-0
[21] Fangxian, L., Shizong, L. and Youzhi, C. (2009) Thermal Analysis Study of the Effect of Coal-Burning Additives on Combustion of Coals. Journal of Thermal Analysis and Calorimetry, 95, 633-638. http://dx.doi.org/10.1007/s10973-008-9124-x
[22] Wang, H.-H. (2007) Kinetic Analysis of Dehydration of a Bituminous Coal Using TGA Technique. Energy and Fu- els, 21, 3070-3075. http://dx.doi.org/10.1021/ef070170y