Open Journal of Fluid Dynamics
Vol.09 No.02(2019), Article ID:92979,21 pages
10.4236/ojfd.2019.92009
CFD Assisted Study of Multi-Chapels Greenhouse Vents Openings Effect on Inside Airflow Circulation and Microclimate Patterns
Allal Senhaji1*, Mhamed Mouqallid1, Hassan Majdoubi1,2
1Equipe de Recherche en Energétique et Mécanique des Fluides, ENSAM, Meknès, Maroc
2CRMEF, Fes-Meknès, Maroc

Copyright © 2019 by author(s) and Scientific Research Publishing Inc.
This work is licensed under the Creative Commons Attribution International License (CC BY 4.0).
http://creativecommons.org/licenses/by/4.0/


Received: May 6, 2019; Accepted: June 9, 2019; Published: June 12, 2019
ABSTRACT
The aim of this work is to study and quantify the air mass flow exchanged between inside and outside of the greenhouse, in order to determine the ventilation openings layout and the design effect on greenhouse airflow and microclimate distribution. The study was conducted over a 945 m2 multi-chapels arched greenhouse with a polyethylene cover and has thirteen crop rows oriented from north to south; the greenhouse was equipped with side wall and roof vents openings. A simulation was performed using different arrangements and configurations of ventilation openings with the same wind direction. Numerical simulation has been adopted in three dimensions (CFD), using the Fluent computer code which relies on the resolution of the Navier-Stokes equations. These equations were solved in the presence of the turbulence model (k - ε) and the Boussinesq model equation adopted to incorporate buoyancy forces. The effects of solar and atmospheric radiation were included by solving the radiative transfer equation (RTE), using Discrete Ordinate (DO) model. The effects of the roof openings, the presence of anti-insect screens and crops orientation were investigated and quantified. In a 3-span greenhouse with an anti-aphid insect screen in the vent openings, combining roof and sidewall vents gave a ventilation rate per unit opening area that was 1.4 times more than with only side vents. In the latter case, the difference of temperature between the inside and the outside of the greenhouse was greater than 3˚C. Numerical simulations with an anti-insect screen having a porosity of 56% showed that the air exchange rate with combined ventilation was reduced by 48%. Finally, the paper focused on the effect of vent arrangement on the efficiency of the ventilation and the distribution of the microclimate inside the greenhouse. Results showed that computed ventilation rates varied from 53.43 to 70.95 kg/s, whereas temperature differences varied from 7.15˚C to 10.14˚C. This study also showed that other characteristics such as climate heterogeneity must be investigated in order to define the best ventilation configuration.
Keywords:
Greenhouse Microclimate, Computational Fluid Dynamics (CFD), Ventilation, Solar Radiation

1. Introduction
Natural ventilation is considered to be one of the most important factors in the greenhouse environment [1] because it directly affects the greenhouse air temperature, humidity and CO2 concentration. The Mediterranean region which is characterized by a large radiating flow, such efficient air conditioning is crucial to reduce the temperature of the greenhouse air and eliminate excess humidity.
The ability to maintain the desired climate in greenhouse production system depends on the design and performance of the ventilation system [2] . Natural ventilation is used by the vast majority of growers in the Mediterranean region because it is the best economical way to regulate microclimate of greenhouses. However, the control of airflow with natural ventilation is limited, so it is necessary to analyze the effectiveness of natural ventilation.
The arrangement of the openings may vary from a greenhouse to another. For most greenhouses, the openings are arranged, continuously or alternatively, along the side walls and/or the roof (Venlo-type greenhouses). However, in some cases, the greenhouse may have only holes in the roof (parral type) or discontinuous openings obtained by separating the plastic cover on either side of a tunnel greenhouse.
To prevent crop pests (whitefly and thrips, for example), especially in the Mediterranean regions, the openings must be equipped with insect-proof screens that strongly influence the ventilation process.
Recently Majdoubi et al. [3] have shown that the insect screen reduced the greenhouse ventilation rate by 46%, and the tomato rows that were oriented perpendicular to the prevailing air movement through the greenhouse reduced the ventilation rate by 50%.
Kittas and Bartzanas [4] have studied the efficiency of two configurations concerning ventilation openings on the greenhouse microclimate during the dehumidification process. The results of the simulations performed for an outside wind direction perpendicular to the greenhouse axis, show clearly the influence of ventilation openings configurations on the velocity, temperature and humidity distribution inside the greenhouse.
In recent years, computational fluid dynamics (CFD) has become an important tool that is widely used in many fields. In numerical modelling of microclimate greenhouse, many researchers have used CFD to study the effects of greenhouse design to improve greenhouse ventilation [5] [6] .
Kacira et al. [7] studied the effect of vent configuration in naturally ventilated greenhouses, they observed that the maximum greenhouse ventilation rates were achieved when rollup type side vents were used in the side walls. The rollup side vents considerably enhanced the ventilation rate in the plant canopy zone. More recently, Bartzanas et al. [8] studied the influence of vent arrangement on windward ventilation of a tunnel greenhouse using commercial fluid dynamics code. They showed that the largest ventilation rate did not necessarily correspond to the best greenhouse air temperature and velocity distribution.
Other studies are interested in the effects of specific elements and of outdoor weather conditions on natural ventilation [9] [10] [11] [12] . Few of these studies have examined the effect of vent used for cooling and dehumidification [9] [13] [14] but their findings provide valuable guidance for the management of the ventilation system; However, they are limited to the specific structures and local climatic conditions.
Results published by Bournet and Boulard [13] shows main factors influencing the movement of air inside the greenhouse -in terms of ventilation efficiency inside it-are examined on the geometry of the greenhouse and the opening arrangement. Other parameters affecting the ventilation, such as wind speed and direction, the addition of anti-insect proofs or shade screens, and interactions with culture, are also discussed.
Another aspect of ventilation investigated concerned the effects of anti-insect screens placed over the vent openings. Insect screening reduces ventilation, which in turn causes air temperature and relative humidity to rise significantly. Molina-Aiz et al. [15] observed a 50% reduction of the ventilation rate for a screen porosity of 39%. For a porosity of 50%, Bartzanas et al. [16] also simulated an induced 50% loss of ventilation efficiency. Considering screens with a 25% porosity, Baeza et al. [9] simulated a reduction of the ventilation rate comprised between 77% and 87%, depending on the number of spans for a parral greenhouse equipped with both sidewall and roof vents. Fatnassi et al. [17] observed that the ventilation rates with anti-thrip (porosity 19%) or anti-aphid (porosity 56%) screens represented 41% and 53%, respectively, of the flow without a net.
The numerical simulation (CFD) is now more developed, integrating the radiative exchange between the atmosphere and the greenhouse environment [5] [18] as well as the transfer of water vapor and heat between culture and air [19] [20] [21] .
However extensive researches in this field, a few studies have included humidity and radiative mechanisms by solving the Radiative Transfer Equation (RTE) for luminance in the greenhouse. Studies using CFD on the effect of the crop rows orientation and the effect of openings arrangement with anti-insect proofs on ventilation and inside climate in a greenhouse are even rarer.
Spurred on by these important issues, the aim of this work is to study the arrangements of ventilation openings effect on both the effectiveness of the ventilation and the distribution of the microclimate inside the screened greenhouse. It seeks a better understanding of the behavior of the greenhouse type to be studied and also the management of the microclimate inside the greenhouse. Airflows established inside the greenhouse were analyzed for different types of geometries. The impact of the combination of openings, the presence of insect screens, the width and number of the openings, the height of the greenhouse and the external wind conditions are carefully examined.
2. Modeling
2.1. Governing Equations
The CFD methods can explicitly calculate the velocity field and the associated temperature field of flow by numerically solving the corresponding transport equations. The three-dimensional conservation equations describing the transport phenomena for steady flows are of the general form [22] :
(1)
Φ represents the concentration of the transport quantity in three momentum conservation equations and the scalars mass and energy conservation equations. u, v and w are the components of velocity vector; Γ is the diffusion coefficient and is the source term [18] . The governing equations are discretized following the procedure described by Patankar [22] . This consists of integrating the governing equations over a control volume. CFD code Fluent 6.3.2 was used to solve Equation (1), using the finite volume numerical scheme to solve the equations of conservation for the different transported quantities in the flow around and in the greenhouse (mass, momentum and energy).
The turbulent stress is modelled using the k-ε model. In Equation (1), Φ also represents the turbulent kinetic energy k (m2/s2) and dissipation of the kinetic energy ε (m2/s3). The Boussinesq model was also activated to take account the effect of gravity, which means that the buoyancy force due to the differences of the density of air is added as a source term in the momentum equation [2] .
2.2. Ventilation Model
There are two possibilities to ventilate greenhouses:
1) Natural ventilation by opening ventilators.
2) Forced ventilation by fans.
Important criteria for ventilation systems are the ventilation rate expressed as follows [23] :
(2)
where Vr is the ventilation rate (h−1), ϕm the mass flow rate (kg/s1), Vg the greenhouse volume and ρ the density of air.
2.3. Turbulence Model
The effect of turbulence on the flow was implemented via the standard k-ε model. According to Nebbali et al. [24] , k-ε model gives the lowest error value and it can be chosen as it represents a good compromise between the complexity of calculation and realism in the simulation of turbulence. The standard k-ε model is a semi-empirical model based on two equations, the turbulent kinetic energy (k) and dissipation rate (ε) [25] . The model constants C1ε, C2ε, Cµ, and σk have been determined from experiments with air and water for fundamental turbulent shear flows including homogeneous shear flows and decaying isotropic grid turbulence [26] :
2.4. Flow through Insect Screens and Plants
To take account of dynamic effects induced by the insect screens (placed over the vents) and the crop, we can model them by means of the porous medium approach governed by the Darcy-Forchheimer equation.
The flow of air through a screens porous jump, used as boundary conditions, can be expressed as:
(3)
The values of coefficients, K(m2) the permeability of the porous medium and Y(−) the non-linear momentum loss coefficient, were obtained from the following equations [27] :
(4)
where φ is the porosity of the porous medium.
The crops were modeled as a rectangular block (with dimensions 22.8 mL × 1 mW × 2 mH) porous media approach by the addition of a momentum source term to the standard fluid flow equations. In this case, the source term was described as [26] :
(5)
C1 = 1/K is the viscous resistance (m−2), C2 is the inertial resistance factor (m−1).
2.3. Radiation Model
Many studies have successfully applied computational fluid dynamics (CFD) in the numerical simulation of a greenhouse in order to get an overview of the resulting climate inside the greenhouse. In the majority of the studies that used CFD, the effect of solar and thermal radiations was taken into account by setting specific wall temperatures or heat fluxes at the physical boundaries of the greenhouse [5] [10] [15] [18] . In this study solar and atmospheric radiations were included by solving the RTE and distinguishing short [0 - 2.4 µm] and long wavelength [2.4 - 100 µm] contributions.
The radiative heat transfer was also calculated by using the non-gray discrete ordinates (DO) radiation model. Considering the ray direction of , the radiative transfer equation for spectral intensity , can be written as [26] :
(6)
where A present the rate of increase in radiation intensity, B is the loss by absorption and out-scattering, C is the gain by emission, and D is the gain by in-scattering. The no-gray model was activated by dividing the radiative spectrum into the solar radiation band [0.4 - 2.4 µm] and the long wave band [2.4 - 100 µm].
In the present study, the power absorption coefficient was chosen in such a way as to get a transmittance of 0.8 in the short wavelength part of the spectrum and to obtain a zero transmittance in the range of long wavelengths. is computed from the absorptivity a using the following relationship in accordance to the media thickness e [28] :
(7)
The beam direction and irradiation were computed by a solar calculator according to a given position, date and time. The flow iteration was set to 10 per radiation iteration. The discrete ordinate (DO) model solution required material thermal and optical parameters, as summarized in Table 1.

Table 1. Materials thermophysical and optical properties able type.
3. Numerical Model
3.1. Description of the Problem Studied
For describing the physical phenomena in the atmospheric boundary layer, a large computational domain (107 m × 75 m × 30 m) composed of a multi-span greenhouse and its surroundings was created by the pre-processing software Gambit 2.4.6.
The 3D computational domain is comprised of three span arched-roof greenhouse (Each one was9 m wide, 35 m length, 4 m high at the gutter and 6 m high at the ridge) equipped with roof and lateral vents at different positions and occupied by 13 rows of tomato crop considered as parallelepipedal blocks (Figure 2). This greenhouse was surrounded by a large enough open space (30 m × 50 m × 20 m) to allow a good definition of the atmospheric boundary layer.
The dimensions of the greenhouse and surrounded environment used in the CFD model were presented in both Figure 1 and Figure 2.

Figure 1. 3D computational domain of a typical arch greenhouse and its surrounding area and over view used mesh in the middle plan.

Figure 2. Geometry of the cropped greenhouse; RW: west roof vent; RC: central roof vent and RE: east roof vent.
A three-span arched-roof of the greenhouse has been considered for simulation. The greenhouse was covered with polyethylene of a thickness 0.1 mm and was equipped with continuous roof vents on the ridge of each span (opening height is 1 m with an angle of 45˚) and two side openings (opening height of 2 m). The greenhouse is cultivated with thirteen rows of tomato crop at a height of1.8 m.
The different simulations are referred to the first June, at midday for Meknes city in Morocco (latitude: 33˚52'N, longitude: 5˚310'W), characterized by solar radiation of 914 w/m2.
3.2. Meshes and Boundary Conditions
The size of the outdoor domain was much larger meshed than the greenhouse (Figure 1). It was meshed with an unstructured grid varying from 788,060 to 2,010,423 pentahedral cells, whereas the indoor domain was meshed with denser grids to map the inside detailed flow field, with 7722 hexahedral cells in the crop and 97,558 pentahedral cells inside the greenhouse. A check for gridde pendency was made with three different mesh numbers (893,340 cells, 1,282,350 cells, and 211,542 cells) to ensure that the grid resolution would not have a noticeable influence on the numerical solution.
A substantial increase in the ventilation rate (11%) between the first and second grids was observed. A small increase in the ventilation rate (1%) between the second and third grids indicates that the grid resolution has almost no influence on the solution. Finally, the grid with 1,282,350 cells was chosen.
A mixed heat transfer boundary condition (combination of radiation and convection with convective heat transfer coefficient, h = 8 W/m2K [28] ) is applied at the ground, with a diffusive radiation-opaque material. Also, the semi-transparent roof cover zone has a fluid region on each side; it is called a “two-sided wall”. To couple the two sides of the wall, a coupled thermal condition is selected (This option will appear in the Wall panel only when the wall is a two-sided wall). No additional thermal boundary conditions are required, because the solver will calculate heat transfer directly from the solution in the adjacent cells, whereas the side walls were treated as coupled and opaque material.
At the inlet of the computational domain a logarithmic inlet velocity profile was considered. The profile was linked to the CFD main module using the user-defined function (UDF).
Inlet velocity was defined as [15] :
(8)
With Uinl the inlet velocity (m/s), u the friction velocity (m/s), K the von Karman constant (K = 0.42), z0 the friction length (m) and y the height in m.
The wind direction was normal to the ridge for the model simulations. A reference velocity was chosen to be 2 m/s at a reference height (2 m). The wall roughness height was 0.01 m. The distributions of turbulent kinetic energy (k) and of the turbulent dissipation rate (ε) in the wind profile are described by the relationships:
(9)
where Cµ is a constant fitting parameter.
The pressure-outlet boundary condition was selected for the domain outlet. The symmetry boundary condition was applied at the north and south of the domain. The wall boundary condition was used at the upper of the computational domain to answer the radiation condition. The fixed temperature (300 K) and absolute humidity (0.012 kg/kg) conditions are imposed at the limits of the domain which are considered to be the temperature and humidity of ambient air around the greenhouse.
3.3. Numerical Procedure
This study utilized the CFD model using software package (Fluent 6.3) to predict natural ventilation and turbulent airflow patterns inside and outside the multi-span greenhouse. The computer used was a PC with a 2 Intel processors 2.6 GHz and 12 GRAM, this software is capable of modeled simulations higher than 100,000 calculation cells.
The Green-Gauss cell based on semi-implicit method for pressure-linked equations (SIMPLE) was adopted to solve the coupled pressure-momentum equations.
The standard scheme was used for the pressure discretization and a second-order upwind discretization scheme was selected for the momentum, turbulence and energy equations.
The convergence criterion for all variables was 10−6, The under-relaxation factors used for the CFD simulation are by default in Fluent except for energy equation which is reduced to 0.7 to dampen the instability introduced by the coupling of energy equation with the radiation equation.
3.4. Simulation of the Ventilation Rate
The mass flow rate through each vent opining surface is computed by summing the value of density multiplied by the dot product of the facet area vector and the facet velocity vector [26] .
(10)
The ventilation rate of the greenhouse was deducted from the mass flow rate using the following Relation (2) described above in Section 2.2
3.5. Vent Configurations Used for Simulations
Three roof-opening and four side wall opening configurations of vent openings were considered in this study (Figure 3):

Figure 3. Side and roof ventilator configurations of the greenhouse.
• Configuration 1 (C1), three roof ventilators are open. Under side west and under side east are open;
• Configuration 2 (C2), three roof ventilators are open. Under side west and upper side east are open;
• Configuration 3 (C3), three roof ventilators are open. Upper side west and under side east are open;
• Configuration 4 (C4), three roof ventilators are open. Upper side west and upper side east are open;
• Configuration 5 (C5), roof windward ventilators in the first span and windward ventilators in the third span are open. Under side west and upper side east are open.
4. Results
In a first step, we used the developing model to investigate the effects of crop rows orientation, the effects of anti-insect screen (used in the vent openings) and the effects of side vents opening(parallel and perpendicular to the incoming vent) on the flow rate, airflow, and temperature patterns in a three-span greenhouse. The effect of the combination of roof openings with side openings in a screening greenhouse was carefully investigated during this step. In order to examine the influence of these parameters on greenhouse microclimate the configuration (C1) has been used with and without roof openings.
The second step was to represented solar radiation, result temperature, result humidity, the total flux at a different element of the house and to evaluate the climate resulted in the greenhouse (in terms of thermal, hydric and dynamic fields), and to study the performance of the aeration system for all cases studied.
4.1. Effect of Insect Screens, Roof Openings and Crops Rows Orientation
Within most crop ecosystems, some pests have no effective biological control agents. However, the anti-insect screen is the one commonly used by growers in Mediterranean countries to limit the entrance of the white fly and aphids species.
Table 2 shows the ventilation rates obtained from simulations with and without the screen over the vents. A large reduction in ventilation rate was observed, which varied between 48.60% and 63.14% (with and without roof openings respectively). This reduction in ventilation rate caused a general increase in temperatures more than 7˚C above the external value. This result is proven by many authors [9] [15] [19] . The placement of insect proof on the ventilation openings reduce the main air velocity in the greenhouse between 86% and 56% (with and without roof openings respectively) and increased the main humidity by 11%.
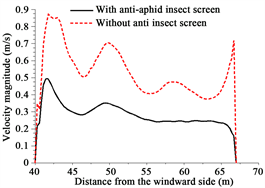
Figure 4(a) and Figure 4(b) present the influence of insect screen on the air velocity and temperature along the greenhouse width, at a height of 2 m above the greenhouse floor, with roof and side openings. The use of an anti-aphid screen reduces the mean air velocity inside the greenhouse by 86% and increased the temperature by 5˚C compared to the values for a greenhouse without screen. The air velocity was lower form the windward to the leeward part of the greenhouse along its width, the lowest temperatures occurred near the air inlet and a temperature gradient was developed along the greenhouse width.
Table 2 presents the results simulations using combined sidewall and roof vents and only side vents. Combined ventilation gave almost 1.2 times more ventilation than side ventilation for a screening greenhouse. Roof ventilation contributed to an 8.7% increase in air velocity, a reduction in this strong temperature gradient and a smoothing of the temperature profile in the width direction (Figure 5).
 (a)
(a)
 (b)
(b)
Figure 4. Air velocity (a) and temperature (b) along the greenhouse width at a height of 2 m above ground greenhouse, with and without anti-aphid insect screen.
Table 2. Influence of insect screen on ventilation rate, mean air temperature, velocity and absolute humidity.
 (a)
(a)
 (b)
(b)
Figure 5. Distribution of the air velocity (a), and corresponding temperature distribution (b) along the greenhouse width at a height of 2 m above ground, with and without roof openings.
Compared with lateral ventilation only, roof ventilation has improved the climate in terms of air exchange rate and climate uniformity, because the air inside is better mixed than in the case of lateral ventilation only.
The influence of the orientation of the crop rows is also very important; a summary of this influence on the efficiency of ventilation in the greenhouse is presented in Table 3, for the greenhouse studied without roof opening.
The crop rows orientation perpendicular to the prevailing air circulation reduces the greenhouse ventilation rate by 24%, the air velocity by 25% and increase the average temperature by 1˚C. However, the combination of crop rows perpendicular and insect proofs effects reduce the greenhouse ventilation rate by 72%, the velocity by 56% and increase the average temperature by 6˚C.
4.2. Radiation Output
Figure 6 shows the distribution of solar radiation at noon on the first day of June in a typical three-span greenhouse at level ground. This distribution inside the greenhouse shows that a mean value of 690 w/m2 and outside value of 814 w/m2. The cover transmissivity of the external solar radiation was about 85%.
Figure 7 illustrates that the distribution of incident radiation inside the greenhouse was identical to the distribution pattern of the crop rows. There was obscured bands (186 w/m2) separated by shaded bands (318 w/m2). The darkness bands due to the crop absorption of solar radiation assumed with an extinction coefficient of 0.71 for the tomato crop. Same figure shows that crop and greenhouse air reduce the incident radiation at soil level by 54% and 73% under crop rows.
Table 4 shows the total average heat flux in the roof, sidewall, outside ground, inside ground and soil under crop. It is similar for each case and represents a high value on the roof compared to the other elements, which exhibits the highest radiative flux. A positive value indicates the flux exited roof wall to inside air.
The other interior surface of the greenhouse structure has low values, explaining the solar radiation flux received by them. Similar results were obtained by an experimental study of Majdoubi et al. [21] .

Figure 6. Solar distribution in a three-span greenhouse at midday on the first June at soil level.

Figure 7. Incident radiation in outside and inside greenhouse at noon on the first June at soil level.
Table 3. Influence of crop rows on ventilation rate, mean air temperature, velocity and absolute humidity.
Table 4. Total flux at cover surface of the greenhouse and soil for configurations C1, C2, C3, C4 and C5.
Result simulated temperature of the wall and soil is referred to as radiation heat flux and cooling performance. Table 5 represents the average temperature of the cover, side wall, outside and inside ground.
4.3. Inside Climate
The convective flux at the soil surface and at the cover is the key parameter to characterize the conditions of the greenhouse microclimate that is influenced by the ventilation rate.
Figure 8 illustrates the calculated mass flow rate for the five tested configurations. The air exchanged through the roof ventilators is relatively low compared to the air flow exchanged by side vent openings. The windward side opening and first roof opening are air inlets, but the leeward side opening and the last two roof openings are air outlets. The location of the side wall vents has had an important influence on mass flow rate in all openings
For all configurations, the side vents exchange between 65% and 75% of the total mass flux rate. However, configurations 3 and 4 corresponding to the largest mass flow exchanged between the inside and outside of the greenhouse. Other configurations are those that less air mass flow exchanged.

Figure 8. Mass flow rate at each five vent opening. RW, RC, and RE: roof vent opening; SW: side west opening and SE: side east opening. Negative values mean inlet air while positive values mean outlet air.
Table 5. Total average temperature resulting for dynamic simulation at cover surface of the greenhouse and soil.
4.4. Effect of Vent Arrangements on Airflow and Temperature Patterns
Velocity profile and corresponding temperature for each configuration, at crops level, are shown in Figure 9(a) and Figure 9(b) respectively. The first observation is that the velocity (Figure 9(a)), in upstream greenhouse, is lower for configurations 3 and 4 compared to the other configurations studied. For configurations 1, 2 and 5, the air enters directly through the lower part of the western side wall, which is open in all these configurations, with a high velocity, but this value decreases rapidly due to the resistance of the crop. At the beginning of the second span, for configurations 3 and 4, the velocity increased due to the air incoming by the roof opening in the first chapel, with oscillation that reflects the presence of crop row. The rapid increase of the speed for configurations 1 and 3 of the greenhouse downstream is proved by the acceleration of the air exit by the lower wall which is open in these configurations.
Figure 9(b) presents the computed air temperature in a horizontal plane near the plant of 1 m above the ground in the middle of the greenhouse. These results indicated that the inside air temperature rapidly decreases from the west side wall to the end of the first span, for configurations 3 and 4, where its value starts to gradually increase. But for configurations 1, 2 and 5 the temperature rapidly increases from the west side wall to the beginning of the second span, where it gradually increases. The strong increase for configurations 2 and 4 of the downstream greenhouse are due to the low air velocity, because in these cases the lower partly of the eastern side wall is closed.
Figure 10(a) shows that the velocity profiles above the plant at 2 m of the soil, the values of the velocity is almost 1.4 times bigger than that obtained inside the crop. For each configuration studied, the profiles have 2 peaks corresponding to the air entry or the air exit by the vent openings; they are located at the beginning of each span and at the exit eastern side opening. For all configurations we find that there is some heterogeneity, which is stronger for configurations 3 and 4 and has very low-velocity values in the first span, because the lower part of the western side wall is closed. For the temperature shown in Figure 10(b), in
 (a)
(a)
 (b)
(b)
Figure 9. Velocity (a) and temperature profile (b) along the greenhouse at 1 m above the ground surface at the middle plan.
 (a)
(a)  (b)
(b)
Figure 10. Velocity (a) and temperature profile (b) along the greenhouse at 2 m above the ground surface at the middle plan.
configurations 3 and 4, the values are lower compared to that in the crop, with as decreasing variation in the first span, them an increasing variation in the rest of the greenhouse. But for configurations 1, 2 and 5, there is an almost linear variation.
4.5. Dynamic, Thermal and Hydric Field at Middle Plan
The dynamic field was represented in Figure 11. For all configurations, the fresh air was entering mainly through the western side and first-span roof openings and exits through the adjacent roof vents and the leeward vent. The western side vent and roof vent openings of the first span acted as the only inlet for fresh air, whereas the eastern side vent and roof vent openings of the second and third spans acted as outlets. Additionally, the air velocity through the inlet openings is much bigger and is damped by plants resistance. The flow inside greenhouse is separated into two unequal air streams flowing. The main strong stream flow (≈ 0.34 m/s) above the plants and the small one flow near them with a lower speed (0.25 m/s).
The flow velocities inside the tomato crop regions are decelerated by the viscous and inertial resistance. Two recirculation patterns are observed in the most efficient configurations. These appear at the top corner of the first and second spans.
For the least efficient configurations (C3 and C4) a bigger reverse circulation appeared at the bottom corner of the first span.
Figure 12 presents the distribution of temperature (in the right) and absolute humidity (in the 336 left). It is clear that temperature and absolute humidity distribution follow the air profile velocity. In regions with small air velocities the air temperature and absolute humidity are bigger compared with outside values, especially in the region covered by the crop and in the corners of greenhouse.
In general, the temperature and absolute humidity, gradually increase along the greenhouse and maintains the high values in the leeward part of greenhouse. Besides the flow dominated by the strong convection of the incoming air through the windward and first roof opening, a cooling zone that is developed along the

Figure 11. Airflow at middle plan inside the greenhouse: (a) C1, (b) C2, (c) C3, (d) C4 and (e) C5.

Figure 12. Temperature and humidity pattern at middle plan inside the greenhouse: ((a) and (b)) C1, ((c) and (d)) C2, ((e) and (f)) C3, ((g) and (h)) C4 and ((i) and (j)) C5.
greenhouse. However, the closing of central roof opening of the greenhouse (configuration 5) allows the air to continue towards the exits east opening of the greenhouse. This convection flow of the incoming air is accompanied by a significant cooling along the greenhouse. For configuration 3 and 4, the clockwise loop airflow in the first span of the greenhouse, leads a strong temperature gradient and height humidity in most part of the first span.
4.6. Ventilation Efficiency
The efficiency of the ventilation was considered by reducing the temperature difference Ti - T0 between inside and outside and by reducing normalized velocity inside the greenhouse. The homogeneity of the temperature, humidity and velocity distribution has been evaluated by reducing the standard deviation ( and ), also the uniformity is calculated by the formula given below. A summary of the main results for the five configurations is presented in Table 6.
The standard deviation of a specified variable on a surface is computed using the mathematical expression below [26] :
(11)
where x is the cell value of the selected variables at each facet and x0 is the mean value of x.
The uniformity index represents how a specified field variable varies over a surface.
The area-weighted uniformity index ( ) of a specified field variable x is calculated using the following equation [26] :
Table 6. Efficiency, homogeneity and uniformity for the five cases study.
(12)
where I is the facet index of a surface with n facet, and is the average value of the field variable over the surface.
The best configuration was thus a compromise between a high ventilation rate and good uniformity of the climatic conditions inside greenhouse especially of the crop.
5. Conclusions
The influence of vent arrangement on windward ventilation of a multi spans greenhouse was numerically investigated using computational fluid dynamics code. The numerical model integrates solar and atmospheric radiation by solving the RTE, that is to say, instead of setting thermal condition (specific wall temperatures or heat fluxes) at the physical boundaries of the greenhouse itself, the effects of solar and thermal radiation are taken into account by setting radiative conditions at the limits of the calculation domain. These results showed that the presence of a crop would act as a barrier to the flow of ventilation air, the crop row orientation relative to the sidewall vents have strong influences on ventilation airflow. The use of an anti-aphid screen reduces the mean air velocity inside the greenhouse and increased the average temperature by 5℃ compared to the values for a greenhouse without screen.
For five configurations of ventilation openings were investigated, the ventilation rates, the airflow, humidity and temperatures patterns are evaluated. These results indicate that the highest ventilation rates are not always the best criterion for evaluating the performance of different ventilation systems in greenhouses. The best criteria are the air velocities in the crop, the temperature difference between inside and outside, the absolute humidity (HA), homogeneity and uniformity of the climate parameters. For the configurations studied in this work, the above criteria show that the best configuration is to place the west side opening at the bottom, the eastern side opening at the top and to close the medium roof opening.
Conflicts of Interest
The authors declare no conflicts of interest regarding the publication of this paper.
Cite this paper
Senhaji, A., Mouqallid, M. and Majdoubi, H. (2019) CFD Assisted Study of Multi-Chapels Greenhouse Vents Openings Effect on Inside Airflow Circulation and Microclimate Patterns. Open Journal of Fluid Dynamics, 9, 119-139. https://doi.org/10.4236/ojfd.2019.92009
References
- 1. Lopez, A., Valera, D.L. and Molina-Aiz, F. (2011) Sonic Anemometry to Measure Natural Ventilation in Greenhouses. Sensors, 11, 9820-9838. https://doi.org/10.3390/s111009820
- 2. Boulard, T., Kittas, C., Roy, J.C. and Wang, S. (2002) Convective and Ventilation Transfers in Greenhouses, Part 2: Determination of the Distributed Greenhouse Climate. Biosystems Engineering, 83, 129-147. https://doi.org/10.1006/bioe.2002.0114
- 3. Majdoubi, H., Boulard, T., Hanafi, A., Fatnassi, H., Demrati, H., Bekkaoui, A., Nya, M. and Bouirden, L. (2007) Winter Time Microclimate in a Large Scale Canary Type Tomato Greenhouse in the South of Morocco. Acta Horticulturae, 747, 139-149. https://doi.org/10.17660/ActaHortic.2007.747.15
- 4. Kittas, C. and Bartzanas, T. (2007) Greenhouse Microclimate and Dehumidification Effectiveness under Different Ventilator Configurations. Biosystems Engineering, 42, 3774-3784. https://doi.org/10.1016/j.buildenv.2006.06.020
- 5. Bournet, P.E., OuldKhaoua, S.A. and Boulard, T. (2007) Numerical Prediction of the Effect of Vent Arrangements on the Ventilation and Energy Transfer in a Multi-Span Glass House Using a Bi-Band Radiation Model. Biosystems Engineering, 98, 224-234. https://doi.org/10.1016/j.biosystemseng.2007.06.007
- 6. Hong, S.W., Lee, I.B., Hwang, H.S., Seo, I.H., Bitog, J.P., Yoo, J.I., Kim, K.S., Lee, S.H., Kim, K.W. and Yoon, N.K. (2008) Numerical Simulation of Ventilation Efficiencies of Naturally Ventilated Multi-Span Greenhouses in Korea. Transactions of the ASABE, 51, 1417-1432. https://doi.org/10.13031/2013.25235
- 7. Kacira, M., Sase, S. and Okushima, L. (2004) Effects of Side Vents and Span Numbers on Wind-Induced Natural Ventilation of a Gothic Multi-Span Greenhouse. Journal of Agricultural Research Quarterly, 38, 227-233. https://doi.org/10.6090/jarq.38.227
- 8. Bartzanas, T., Boulard, T. and Kittas, C. (2004) Effect of Vent Arrangement on Windward Ventilation of a Tunnel Greenhouse. Biosystems Engineering, 88, 479-490. https://doi.org/10.1016/j.biosystemseng.2003.10.006
- 9. Baeza, E.J., Pérez-Parra, J.J., Bailey, B.J., Montero, J.I., Lopez, J.C. and Gazquez, J.C. (2009) Analysis of the Role of Side Wall Vents on Buoyancy-Driven Natural Ventilation in Parral-Type Greenhouses with and without Insect Screens Using Computational Fluid Dynamics. Biosystems Engineering, 104, 86-96. https://doi.org/10.1016/j.biosystemseng.2009.04.008
- 10. Kichah, A., Bournet, P.E., Migeon, C. and Boulard, T. (2012) Measurement and CFD Simulation of Microclimate Characteristics and Transpiration of an Impatiens Pot Plant Crop in a Greenhouse. Biosystems Engineering, 112, 22-34. https://doi.org/10.1016/j.biosystemseng.2012.01.012
- 11. Nebbali, R., Roy, J.C. and Boulard, T. (2012) Dynamic Simulation of the Distributed Radiative and Convective Climate within a Cropped Greenhouse. Renewable Energy, 43, 111-129. https://doi.org/10.1016/j.renene.2011.12.003
- 12. Majdoubi, H., Boulard, T., Fatnassi, H., Senhaji, A., Elbahi, S., Demrati, H., Mouqallid, M. and Bouirden, L. (2016) Canary Greenhouse CFD Nocturnal Climate Simulation. Open Journal of Fluid Dynamics, 6, 88-100. https://doi.org/10.4236/ojfd.2016.62008
- 13. Bournet, P.-E. and Boulard, T. (2010) Effect of Ventilator Configuration on the Distributed Climate of Greenhouses: A Review of Experimental and CFD Studies. Computers and Electronics in Agriculture, 74, 195-217. https://doi.org/10.1016/j.compag.2010.08.007
- 14. He, K., Chen, D., Sun, L., Liu, Z. and Huang, Z. (2015) The Effect of Vent Openings on the Microclimate inside Multi-Span Greenhouses during Summer and Winter Seasons. Engineering Applications of Computational Fluid Mechanics, 9, 399-410. https://doi.org/10.1080/19942060.2015.1061553
- 15. Molina-Aiz, F.D., Valera, D.L. and Alvarez, A.J. (2004) Measurement and Simulation of Climate inside Almeria-Type Greenhouses Using Computational Fluid Dynamics. Agricultural and Forest Meteorology, 125, 33-51. https://doi.org/10.1016/j.agrformet.2004.03.009
- 16. Bartzanas, T., Boulard, T. and Kittas, C. (2002) Numerical Simulation of the Airflow and Temperature Distribution in a Tunnel Greenhouse Equipped with Insect-Proof Screen in the Openings. Computers and Electronics in Agriculture, 34, 207-221. https://doi.org/10.1016/S0168-1699(01)00188-0
- 17. Fatnassi, H., Boulard, T., Demrati, H., Bouirden, L. and Sappe, G. (2002) Ventilation Performance of a Large Canarian Type Greenhouse Equipped with Insect-Proof Nets. Biosystems Engineering, 82, 97-105. https://doi.org/10.1006/bioe.2001.0056
- 18. OuldKhaoua, S.A., Bournet, P.E., Migeon, C., Boulard, T. and Chassériaux, G. (2006) Analysis of Greenhouse Ventilation Efficiency Based on Computational Fluid Dynamics. Biosystems Engineering, 95, 83-98. https://doi.org/10.1016/j.biosystemseng.2006.05.004
- 19. Fatnassi, H., Boulard, T., Poncet, C. and Chave, M. (2006) Optimisation of Greenhouse Insect Screening with Computational Fluid Dynamics. Biosystems Engineering, 93, 301-312. https://doi.org/10.1016/j.biosystemseng.2005.11.014
- 20. Roy, J.C., Vidal, C., Fargues, J. and Boulard, T. (2008) CFD Based Determination of Temperature and Humidity at Leaf Surface. Computers and Electronics in Agriculture, 61, 201-212. https://doi.org/10.1016/j.compag.2007.11.007
- 21. Majdoubi, H., Boulard, T., Fatnassi, H. and Bouirden, L. (2009) Airflow and Microclimate Patterns in a One-Hectare Canary Type Greenhouse: An Experimental and CFD Assisted Study. Agricultural and Forest Meteorology, 149, 1050-1062. https://doi.org/10.1016/j.agrformet.2009.01.002
- 22. Patankar, S.V. (1980) Numerical Heat Transfer and Fluid Flow. Hemisphere Publishing Corporation, New York.
- 23. Boulard, T., Feuilloley, P. and Kittas, C. (1997) Natural Ventilation Performance of Six Greenhouse and Tunnel Types. Journal of Agricultural Engineering Research, 67, 249-266. https://doi.org/10.1006/jaer.1997.0167
- 24. Nebbali, R., Roy, J.C., Boulard, T. and Makhlouf, S. (2006) Comparison of the Accuracy of Different CFD Turbulence Models for the Prediction of the Climatic Parameters in a Tunnel Greenhouse. ActaHorticulturae, 719, 287-294. https://doi.org/10.17660/ActaHortic.2006.719.32
- 25. Launder, B.E. and Spalding, D.B. (1970) The Numerical Computational of Turbulent Flows. Computer Methods in Applied Mechanics and Engineering, 3, 269-289. https://doi.org/10.1016/0045-7825(74)90029-2
- 26. Fluent Inc. (2009) Fluent 6.3 User’s Guide.
- 27. Miguel, F.A. (1998) Airflow through Porous Screens: From Theory to Practical Considerations. Energy and Buildings, 28, 63-69. https://doi.org/10.1016/S0378-7788(97)00065-0
- 28. Baxevanou, C., Fidaros, D., Bartzanas, T. and Kittas, C. (2010) Numerical Simulation of Solar Radiation, Air Flow and Temperature Distribution in a Naturally Ventilated Tunnel Greenhouse. Agricultural Engineering International: CIGR Journal, 12, 48-67.