Open Journal of Fluid Dynamics
Vol.04 No.05(2014), Article ID:52849,7 pages
10.4236/ojfd.2014.45032
Structural Damage Localization by Linear Technique of Acoustic Emission
Md. Tawhidul Islam Khan1*, Nagafuchi Sunichi1, Mehedi Hasan2
1Department of Advanced Technology Fusion, Saga University, Saga, Japan
2Department of Mechanical Engineering, CUET, Chittagong, Bangladesh
Email: *khan@me.saga-u.ac.jp
Copyright © 2014 by authors and Scientific Research Publishing Inc.
This work is licensed under the Creative Commons Attribution International License (CC BY).
http://creativecommons.org/licenses/by/4.0/


Received 23 October 2014; revised 10 November 2014; accepted 7 December 2014
ABSTRACT
Linear source location of acoustic emission (AE) technique has been applied in the present paper for finding the source of material damage under fatigue loading. A plate type structure of ductile cast iron has been used to undergo fatigue damage in a servopulsing machine in the experiment. AE sensors were attached to the specimen for getting the time delay of AE signal propagations through the specimen. After receiving the time delay data of AE signals due to the damage initiation in the material for the provided fatigue loads, linear source location algorithm has been applied and the crack positions are identified. Before applying the technique, a series of pencil lead breaks (PLBs) tests have been conducted upon a ductile cast iron plate of same dimension for verifying the applied algorithm. According to the PLBs varification, the failure location of ductile cast iron (pearlite type) due to the fatigue loading has been characterized. In both experiments, the active ability of the proposed technique for source location of structural damage has been identified clearly and successfully.
Keywords:
Structural Damage, Linear Source Location Technique, Acoustic Emission

1. Introduction
Damage localization in different sensitive equipment or structures like aircraft structure or some internal flow- paths like cooling channels of atomic reactor and so on is a great challenge in NDT (nondestructive testing) for their perfect running. Therefore, getting the perfect information of damage initiation, damage propagation as well as damage location becomes challenging topics to the present scientists and engineers. Although, several methods are also trying to apply for the mentioned problems solution, the acoustic emission (AE) technique plays an important role in finding these structural damage locations or sources as NDT technique as well. It is mentioned more critically that the source location of a damage initiation is often considered as the main goal of acoustic emission technique [1] .
Structural health monitoring (SHM) refers to the structural health assessment technique by involving some non-destructive devices consisting of sensors and relative appliances to monitor the structural condition of integrity, working ability, reliability, safety as well as the performance efficiency of the structural system together [2] . In this system, appropriate processes are involved in monitoring the structure over a period of time by extracting damage sensitive features from AE sensing systems and then identify the conditions of damage intensity, damage propagation, and damage location in an early stage as well as in matured stage [3] . There are various techniques that are involved in SHM such as, vibration monitoring technique, ultrasonic wave propagation technique, acoustic emission technique etc. Acoustic emission technique is one of these non-destructive techniques (NDT) which is widely and successfully used in monitoring structures in aerospace engineering, mechanical engineering and civil engineering fields [4] [5] .
Acoustic emission (AE) is a phenomenon of transient stress wave propagation which is caused due to the sudden release of elastic energy, resulting from mechanical deformations in materials and or due to the initiation and propagation of microcracks, dislocation movement or occurring similar irreversible changes [6] . AE sensors are used in detecting the AE acoustic waves produced by AE events at the surface of the material. The output of AE signals acquisition is featured by its representing properties [7] . Therefore, AE plays an important role in non-destructive testing.
Source location is a powerful tool in AE testing for all engineering applications. In both for laboratory as well as for industrial testing, AE source location algorithms are efficiently used [8] [9] . In laboratory based source location experiments are used to confirm the characteristics of original source and the wave propagations. By applying these information the origin of damage is localized in laboratory application along with the AE feature values.
The main objective of the present research is to clarify the source localization characteristics of acoustic emission technique (linear source location) based on the fatigue damage in ductile cast iron. As ductile cast iron contains carbon globules to increase the ductile properties of the material, the AE wave transformation through this material faces scatterings and anomalousness in propagations. Therefore, two types of experiments were conducted in characterizing the AE source location algorithm. First, the pencil lead fracture (PLF) tests are occurred, and based on that results laboratory experiments are conducted and cracking sources are localized.
Linear source location algorithm has been explained in the next section; after which, the experimental methodologies are discussed. Experimental results and discussions are explained in the following section of the methodologies. Finally, conclusions are presented before the acknowledgements and references.
2. Linear Source Location Algorithm
One of the important advantages of AE structural health monitoring (SHM) system is the ability to locate the damage source. Source localization is an important objective of any types of monitoring system. Therefore, the AE based SHM plays an influential role in health monitoring system as this technique can locate damage source in real time, whereas other methods such as vibration or ultrasound based monitoring techniques detect damage after it has been occurred.
There are several methods in linear source location technique. Out of them, time difference (TD) method which is widely used has applied in the present research as well. The schematics of TD algorithm is shown in Figure 1, where, AE source is mentioned by So. Similarly, s1, s2 and t1, t2 indicate as the AE sensor 1, sensor 2 and time of arrival (TOA) to sensor 1, time of arrival to sensor 2 respectively.
Furthermore, l, l1 and l0 indicate the distance between two sensors (s1, s2), axial distance of AE source to sensor 1 and axial distance between AE source to the midpoint of two AE sensors respectively. The mathematical relations of the TD algorithm are explained as follows [9] [10] :
 (1)
(1)
 (2)
(2)

Figure 1. Modeling of linear source location technique.
where, Dt indicates the time difference between two arrival times to sensor 1 and sensor 2 and v indicates the AE wave velocity which has been measured as:
 (3)
(3)
where, d and t indicate the AE wave travelling distance and travelling time respectively.
3. Experimental Methodology
To characterize the AE source localization technique in ductile cast iron, two major types of experiments have been conducted in the present research. One is the pencil lead fracture experiment, and the other one is the laboratory test under the fatigue loading. Furthermore, before entering into the source location calculations, experiments for identifying the velocity of AE waves through ductile cast iron are conducted. Details of these experiments are explained as follows.
3.1. Measurement of AE Wave Velocity
A ductile cast iron plate with same thickness of the specimen used in PLF or fatigue tests is used for AE wave velocity experiment. For the purpose of getting wave velocity inside the specimen material (described later), two AE sensors, s1 and s2 (detail specification is given in Table 1) are attached upon the specimen with a central distance of d. For getting AE excitation, pencil lead (uni 0.5 B Nano Dia Blended Hi-Quality pencil lead of Mitsubishi Pencil Co. LTD.) with a length of 10 mm and 45 degrees inclination to the specimen surface is fractured. The positions of sensors and the place of PLF is shown in Figure 2. The AE wave travelling time (t) from sensor 1 to sensor 2 is calculated from the AE wave velocity experiments. The schematics of velocity measurement experiment are shown in Figure 3.
3.2. Experiments of PLF
Pencil lead fracture (PLF) tests have been conducted in a noise free environment on the same specimen as is used in fatigue tests. Therefore, the results of PLF experiments are used in calibrating the source location techniques for using in fatigue experiments as well. The details of the specimen preparation and the specimen material properties are discussed as follows.
Specimen for the experiments of PLF and laboratory fatigue tests, pearlite type ductile cast iron (PDI) block has been cast into a block and machined with appropriate size as mentioned in Figure 4. Chemical compositions of the test materials are listed in Table 2. The numerical values in this table are represented by the corresponding values in percent content of carbon (C), silicon (Si), manganese (Mn), phosphorus (P), sulphur (S) and copper (Cu) in percent mass respectively. Mechanical properties of pearlite ductile cast iron are shown in Table 3. The white cast iron is heat treated according to the method of pearlite grain determination test for steel of Japanese Industrial Standards (JISG0552) for converting the hard iron carbide structure into malleable pearlite malleable matrix. The pearlitic structure contains some combined carbons in the matrix which result higher strength and higher hardness than ferritic malleable iron matrix. The specimen is prepared by cutting a central hole and curvatures at the middle position of the specimen to control the crack growth point at the radial surface of this hole. Other endpoint holes are prepared for the attachment to the fatigue loading machines. The determination

Table 1. Specification of AE sensors and preamplifiers.
Table 2. Chemical composition of the specimen (PDI).
Table 3. Mechanical properties of the specimen (PDI).
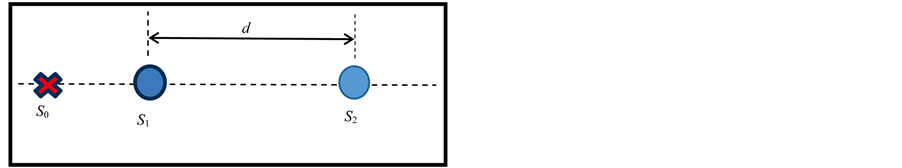
Figure 2. Schematics of sensor positions (s1, s2) and source of PLF (s0).
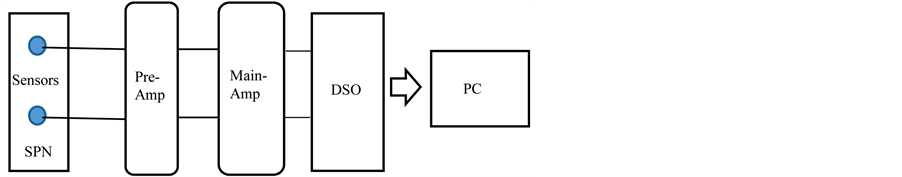
Figure 3. Schematics of experimental apparatus for the measurement of AE wave velocity.

Figure 4. Dimension of specimen with 4 AE sensors (s1 - s4).
of the rate of spherical graphite is carried out in compliance with the spheroidal graphite iron castings of Japanese Industrial Standards (JISZ 5502). The average ferrite grain size (Df), average particle size (Dm), area fraction of graphite (fg) and other related values have been calculated accordingly as well. Then, the specimen has been mirror polished to examine the crack propagation by conducting the microstructural analysis (not mentioned in the present paper). The dimension of the prepared specimen with four AE sensor positions is shown in Figure 4. In PLF tests, lead fractures are done at both sides of the central hole accordingly as shown in this figure. As under fatigue loading, cracks growth generally start at the peripheral sides the central circular hole, in PLF test, therefore, fractures are considered to occur at the same locations. All sensors have been connected with preamplifiers, main amplifiers. Data acquisition device (digital oscilloscope) and finally, the results are saved to a PC for further analysis.
3.3. Experiments of Fatigue Test
The specimen for the fatigue test is attached to the servopulser (fatigue testing machine) for pressing required fatigue loads for attaining the adequate cracks to the specimen and continued until the crack-fracture. Four AE sensors (s1, s2, s3, and s4) are attached to the specimen (SPN). Special silica gel is used between the sensor and specimen for avoiding signal leakage as well as reducing artifacts. Each sensor is connected to a pre-amplifier (Pre.AMP) and then to the 4-channel main AE amplifier (Main.AMP). After applying adequate filtration, the AE signals are stored in a digital storage oscilloscope (DSO) from where the AE data are transferred to the personal computer for the further analysis. Total schematics of the experimental set-up are shown in Figure 5. In this figure the term servopulser is indicated with dotted line where the specimen is attached through four bolts. The controller of servopulser is attached to the system for the controlling of fatigue loads, loading cycles and the power on-off to the machine. The connections of the AE sensing systems in fatigue test are similar to the PLF tests.
In AE experiments, all sensors have been significantly coupled with the specimen for avoiding wave leakage. The preamplifier is setting to the gain of 40 dB. Main amplifier gain is setting to zero. The sampling frequency is selected as 1 MHz as explained above. For avoiding noise, the specimen in PLF tests has mounted upon the acoustic absorbing material. However, for avoiding noise in fatigue tests, special initial thresholds values (1.28 volts in trigger setting) have been applied.
4. Experimental Results and Discussion
Structural damage localization of ductile cast iron (pearlite type) was characterized by the linear source location technique. Several experiments have been conducted to identify and validate the present algorithm.
4.1. PLF Experimental Results
According to the discussions above the PLF experimental results for linear source location have been summarized and shown in Table 4. The results that have been summarized in the table are also based on average data of ten iterations. The results show the source locations satisfactorily (exact source locations are shown in Figure 4).
4.2. Fatigue Experimental Results
Fatigue experiments have been conducted as explained before. All results corresponding to the above experiments are summarized in Table 5. Sensor settings as well as other preparations for this experiment are also based on the same fundamental preparations of PLF experiments.
AE source localization is compared in Figure 6. The comparison shows good agreements, although, some artifacts are observed in channel 2. It is considered that this difference is caused due to the receiving of higher AE energy for having the near location of the damage site in fatigue test. This artifact in channel 2 during the PLF test is relatively less compared to that of fatigue test. The reason that have been considered for getting much AE energy in sensor 2 may not consider in this case, since the intensity is found less in PLB test as well. Moreover, in PBL test the direction of pencil lead fracture may affect the result as well.
4.3. Comparisons of AE Parametric Results
Several sample AE parametric characteristics are shown in the following AE data. The amplitude characteristics of four sensors (s1, s2, s3 and s4) in PLF experiments are shown in Figure 7. It is found that the peak amplitudes of sensor 2 and sensor 3 are higher compared to that of sensors 1 and 4. It is reasoning that since the sensors 2

Figure 5. Schematics of experimental apparatus, in PLF tests as well as fatigue tests.

Figure 6. Comparison of AE sources in PLF and fatigue tests.

Figure 7. AE parametric results (PLF) of sensors, 1, 2, 3, 4 which show the peak amplitude characteristics in volts.
Table 4. Linear source location result in PLF technique.
Table 5. Linear source location result in fatigue tests.
and 3 are placed nearer to the fracture location, it received more AE energy (near field excitation) compared to the sensors 1 and 4 (far field excitation). Same results are also observed in fatigue experiments.
The parametric analysis of AE energy for both PLF and fatigue tests are shown in Figure 8. It is found from this figure that AE energy received from fatigue test is higher than that of PLF test. Furthermore, the sensor located at far field (CH 4) is receiving less AE energy compared to sensors 2 or 3, and it shows the facts that the location of AE source is nearer to the location of sensors 2 or 3, and from the source location results as discussed above also satisfy these techniques validation. Moreover, it is observed that the sensor 1 at fatigue tests received excessive noise from the specimen attachments device since it is located near to the fatigue loading side to the survopulser.
4.4. Discussion
A linear source location technique has been discussed in the present paper for finding the source of fatigue damage in the material. The major advantage of the applied AE technique is its simplicity. For its application no external guided signals are required to insert in identifying internal information of the material. Moreover, as the emitted acoustic waves captured by AE sensors have been generated during the internal changes of the material damage, therefore, impedance loss in travelling is much less compared to other ultrasonic techniques. However, since the AE sensors are attached to the specimen, noise due to vibration and other dynamic effects have easily affected the results in AE technique. Therefore, similar features of data contamination with excessive noise transmissions to the sensors, particularly, to those sensors near to the specimen attachments are observed in the present experimental results (Figure 6). However, in source location of material damage, AE technique still plays important roles and the maximum contaminated noise or dynamic noise are minimized with appropriate thresholds. Thus, suitable thresholds values (maximum 2 volts) have been added in the present experiments as well to minimize the excess noise contaminations from the experimental apparatus (servopulser in fatigue loading) during fatigue experiment.
5. Conclusions
Structural damage localization technique by applying AE linear source location algorithm is successfully implemented and analyzed in the present research.
Two major experiments of PLF and fatigue test are used to discuss the present source location technique. The results of fatigue tests are successfully validated by the PLF technique.
Finally, the damage that has been occurred by fatigue loading in ductile cast iron is successfully identified by the AE source localization technique in the present research.
It is understood that the further improvements in specimen attachment technique to the fatigue loading machine is necessary for avoiding excessive noise transmission to the AE source location technique.

Figure 8. Comparison of AE energy in PLF and fatigue tests for four sensors.
Acknowledgements
This investigation has been supported by a Grant-in-Aid for Scientific Research (KAKENHI 24560297) from Japanese Society for the Promotion of Science. The author is also expressed his gratitude to HINODE Ltd., Japan for supplying the test materials and other related assistance.
References
- Abe, S. (2006) Acoustic Emission Testing. Nondestructive Testing Series I, Japan Society for Non-Destructive Inspection, 4-22. (In Japanese)
- Dawson, B. (1976) Vibration Condition Monitoring Techniques for Rotating Machinery. The Shock and Vibration Digest (London), 8, 3. http://dx.doi.org/10.1177/058310247600801203
- Wilcox, P.D., Lee, C.K., Scholey, J.J., Friswell, M.I., Wisnom, M.R. and Drinkwater, B.W. (2006) Quantitative Structural Health Monitoring Using Acoustic Emission. SPIE, 6173, 1-10.
- Meyendorf, N., Frankenstein, B. and Schubert, L. (2012) Structural Health Monitoring for Aircraft, Ground Transportation Vehicles, Wind Turbines and Pipes-Prognosis. 18th World Conference on Nondestructive Testing, Durban, 16- 20 April 2012.
- Finlayson, R.D., Friesel, M., Carlos, Cole, P. and Lenain, J.C. (2001) Health Monitoring of Aerospace Structures with Acoustic Emission and Acousto-Ultrasonics. Insight, 43, 1-4.
- Beghi, M.G. (2013) Modeling and Measurement for Acoustic Wave and for Acoustic Microdevices. In Tech.
- Theobald, P. and Dar, F. (2006) AE Sensor Calibration for Out-of-Plane and In-Plane Displacement Sensitivity. Journal of Advanced Material Research, 13, 91-98. http://dx.doi.org/10.4028/www.scientific.net/AMR.13-14.91
- Yoshioka, T. and Fujiwara, T. (1982) A New Acoustic Emission Source Locating System for the Study of Rolling Contact Fatigue. Wear, 81, 183-186. http://dx.doi.org/10.1016/0043-1648(82)90314-3
- Baxter, M.G., Pullin, R., Holford, K.M. and Evans, S.L. (2007) Delta T Source Location for Acoustic Emission. Mechanical Systems and Signal Processing, 2007, 1512-1520. http://dx.doi.org/10.1016/j.ymssp.2006.05.003
- Jonathan, J.S., Paul, D.W. and Michael, R.W. (2008) Two-Dimensional Source Location Techniques for Large Composite Plates. Proceedings, EWGAE 2008, 160-165.
NOTES

*Corresponding author.