Open Journal of Fluid Dynamics
Vol.2 No.4A(2012), Article ID:25791,8 pages DOI:10.4236/ojfd.2012.24A020
Effects of Orbital Motion on the Boundary Layer Flow on a Spinning Disk
1Graduate School of Science and Technology, Kumamoto University, Kumamoto, Japan
2Mechanical Engineering Department, Kumamoto University, Kumamoto, Japan
Email: *munekata@gpo.kumamoto-u.ac.jp
Received September 1, 2012; revised October 5, 2012; accepted October 22, 2012
Keywords: Rotating Disk; Transition; Boundary Layer; Flow Visualization; Velocity Measurement
ABSTRACT
The objective of this study is to experimentally examine the effects of orbital motion on the boundary layer flow on a spinning disk. The boundary layer flow on the disk is visualized by the oil flow method, and velocity in the boundary layer is measured by the hot-wire method. For the oil flow pattern in the case of spinning motion only, streaks are clearly observed on the disk as transient vortices, but by adding orbital motion to the spinning motion, we find that streaks are not observed in a certain range of orbital conditions. With increasing orbital motion speed, the laminar region becomes narrower and transition is promoted from the inward region of the disk, regardless of the direction of rotation. Also, with the addition of orbital motion, the velocity profile in the boundary layer becomes more asymmetric with respect to the spin axis of the disk. Furthermore, stationary vortices do not appear on the disk when the orbital speed is beyond a certain critical value. Therefore, the lack of streaks in the oil film pattern when orbital motion is added is due to the spatiotemporal unsteadiness of the flow field on the disk.
1. Introduction
Boundary layer flow on a spinning disk is a flow field representative of a three-dimensional twisted boundary layer. When the spinning speed of a disk increases and the disk diameter is large, the Reynolds number of the boundary layer (which depends on the local radius, the disk rotation speed, and the kinematic viscosity of the fluid) exceeds the critical value, and a boundary layer transition occurs as a result of cross-flow instability [1]. When the Reynolds number further increases downstream, turbulent transition occurs in the boundary layer as a result of the Tollmien-Schlichting secondary instability [1].
When a primary boundary layer transition occurs, about 30 transient vortices are formed in the outer region of the laminar region on the rotating disk [2,3]. The transient vortices corotate and remain stationary on the disk. While horseshoe-shaped vortices are observed along the transient vortices in the secondary transition process [4], those vortices travel along the transient vortices with some nonzero phase speed relative to the wall [1].
In spin coating in semiconductor manufacturing, transient vortices generated on the spinning disk (wafer) prevent the formation of a film with a uniform thickness. Because the vortices are stationary relative to the disk, they form streaks on the film. However, the next-generation of wafers with large diameter and high rotation speed will require techniques for ensuring either that the transient vortices move relative to the disk or that the boundary layer transition is suppressed.
The effects of down-flow and rotational acceleration on the boundary layer transition were investigated in earlier studies [5,6], and a transition suppression method involving the injection of helium gas into the boundary layer of the disk [7] was granted a patent. Here, we focus on adding orbital motion to the spinning disk as a new element technology.
Therefore, the objective of this study is to experimentally characterize the effects of orbital motion on the boundary layer flow on a spinning disk. The effects of orbital motion are investigated by visualization of the boundary layer flow on the disk and velocity measurements at the boundary layer.
2. Experimental Procedure
2.1. Experimental Apparatus
The experimental apparatus (Figure 1) consists of a rotating disk with an added orbital motion similar to that of a planet. In the present work, the orbital rotation radius
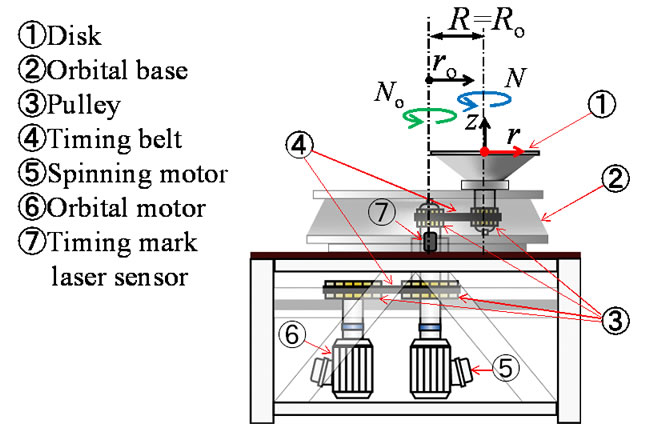
Figure 1. Experimental apparatus.
Ro is 100 mm (= R), the disk diameter is 200 mm (= 2R), and the disk edge thickness is 1 mm. The disk is installed on an orbital rotation base; however, the spinning driveshaft and the orbital driveshaft turn the disk independently. The spinning and orbital angular velocities of the disk are adjusted by controlling the inverter of each motor coupled with the respective driveshaft by using timing belts and pulleys. The counterclockwise direction of rotation is defined as positive.
2.2. Flow Visualization
The boundary layer flow over the spinning disk with added orbital motion is visualized by the oil film method. The coating liquid is prepared from a mixture of black ink and liquid detergent. Initially, the liquid is dropped onto the disk spinning at a low speed, which is held constant for a short period of time to spread the liquid evenly. Then the speeds of spinning and orbital motion are increased to a predefined test speed. Both rotation speeds are maintained for 40 s to allow the film on the disk to dry sufficiently. Finally, both rotational motions of the disk are stopped and the oil flow pattern on the disk is captured with a digital camera.
2.3. Hot Wire Measurement
The velocity field of the boundary layer flow on the disk is measured with a single hot wire at the same orbital angular position by using a timing mark laser sensor. The hot wire is positioned in parallel to the disk surface and aligned in radial direction to measure the tangential (circumferential) velocity component. An A/D converter is triggered by a timing pulse signal from the orbital base, which ensures that the center of each time record represents the same orbital angular position, and velocity data for 1024 points are sampled at every trigger signal during the 250 orbital revolutions at a sampling frequency of 100 kHz. In the spinning-only test, velocity data are sampled during the 250 spinning revolutions in synchronization with spinning by using a timing pulse signal form the spinning disk.
The experiments are performed at a rotation speed N of ±4000 rpm. The radial boundary layer is traversed at a height z from the disk surface of 0.5 mm (= 2.5δ).
3. Results and Discussion
3.1. Visualization of Boundary Layer Flow
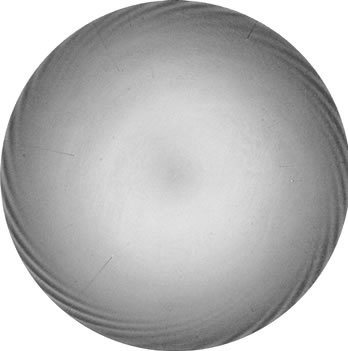
At low values of the local Reynolds number Rer (= r2ω/ν), the resultant oil film shows no streaks since the boundary layer flow is laminar in almost the entire area of the disk. When the spinning speed is lower than 4000 rpm, there are no clear streaks caused by transient vortices on the oil film on the disk, even in the case of the spinning-only test. Typical examples of resultant oil flow patterns on the disk at N = +4000 rpm are shown in Figure 2. The resulting oil flow patterns at N = ±4000 rpm are shown schematically in Figure 3.
Figure 2(a) shows the oil flow pattern for the spinning-only test. Approximately 30 streaks caused by transient vortices can be seen spiraling outward on the disk surface, as reported in previous studies [2,3]. Streaks are observed at positions between around r/R = 0.80 - 85 and the disk edge in the present work, and the critical Reynolds number of the first boundary layer transition as obtained from the flow visualization is Rec = 1.8 × 10⁵ - 2.1 × 10⁵. This value is larger than the critical Reynolds number Rec = 8.2 × 10⁴ theoretically predicted by Malik et al. [8]. The critical Reynolds number obtained through flow visualization tends to be overestimated, because in the onset of the transition to transient vortices causing
 (a)
(a)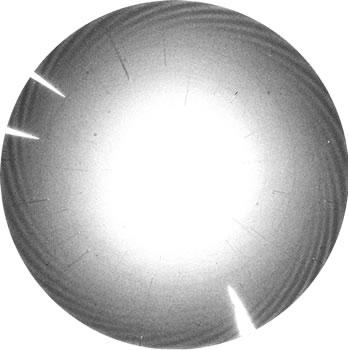 (b)
(b)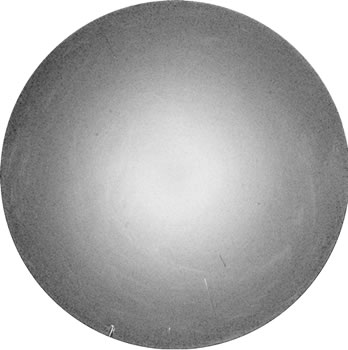 (c)
(c)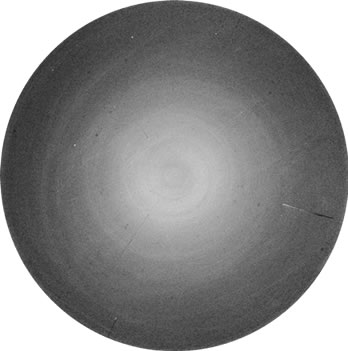 (d)
(d)
Figure 2. Oil flow patterns on the disk at N = +4000 rpm. (a) No = 0 rpm; (b) No = −100 rpm; (c) No = −200 rpm; (d) No = −300 rpm.
 No [rpm]
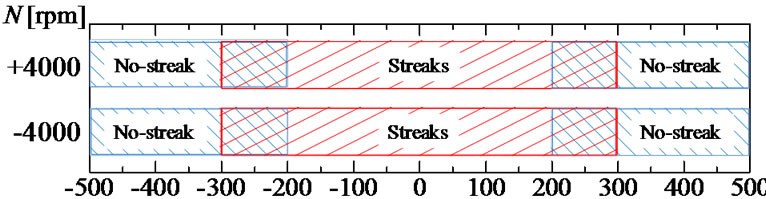
Figure 3. Results obtained with the oil film method at N = ±4000 rpm.
streaks cannot be observed clearly. The Reynolds number based on the disk radius R (= 100 mm) is Re = 2.8 × 10⁵ at N = ±4000 rpm. As reported by Wilkinson & Malik, the transitional Reynolds number of a turbulent breakdown is in the range of 2.9 × 10⁵ < Rec < 3.2 × 10⁵ for a clean disk [9]. Indeed, no turbulent region is observed in the present study.
When orbital motion is added to the spinning disk, at an orbital rotation speed of |No| < 200 rpm, streaks start forming slightly inward as compared with the spinning-only test, as shown in Figure 2(b). This result is similar regardless of the direction of rotation. The promotion of primary transition caused by cross-flow instability is considered to be minimal. However, the streaks in the oil flow pattern become blurred with the increase in orbital rotation speed. At an orbital rotation speed in the range of 200 £ |No| < 300 rpm, no clear streaks are observed. As shown in Figure 2(d), no streaks are observed when the orbital rotation speed is increased even further to |No| £ 300 rpm, regardless of the direction of rotation.
3.2. Tangential Velocity Profile
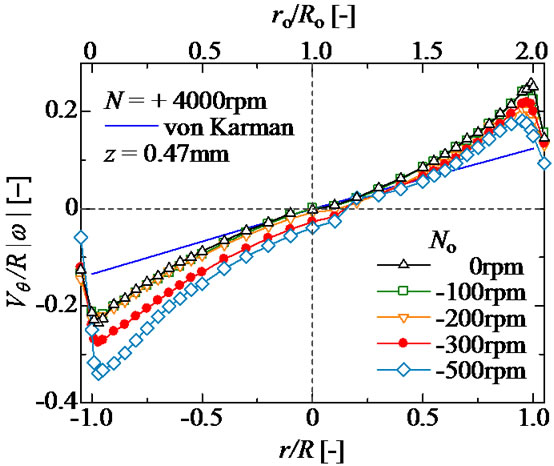
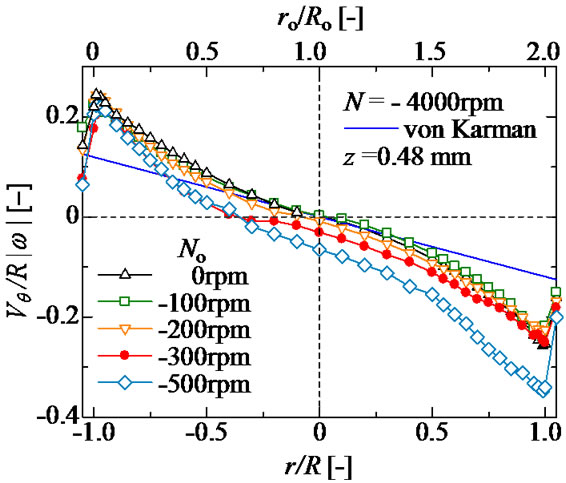
The radial distributions of mean tangential (circumferential) velocity at the same orbital angular position are shown in Figures 4(a) and 5(a). The mean tangential velocity is normalized by the tangential velocity R|ω| of the spinning disk edge. Here, |ω| denotes the absolute value of the angular velocity of the spinning disk. The upper abscissa in the figure denotes the normalized local orbital radius, and the lower abscissa in the figure denotes the normalized local radius of the disk. However, in the inward region of the normalized local orbital radius ro/Ro, the normalized local radius r/R is negative. The solid line in Figure 4 shows the theoretical value in the laminar boundary layer on the spinning-only disk as reported by von Karman [10].
In the case where the direction of spinning of the disk (N = +4000 rpm) is opposite to the direction of orbital motion, the effects of orbital motion on the mean tangential velocity profile are shown in Figure 4(a). At No = −100 rpm, the velocity profile is similar to that in the case of the spinning-only test (No = 0 rpm). With increasing the orbital rotation speed, the velocity profiles at No £ −200 rpm shift down, and the center of spiral flow, where the tangential velocity is 0, is located further out in
 (a)
(a)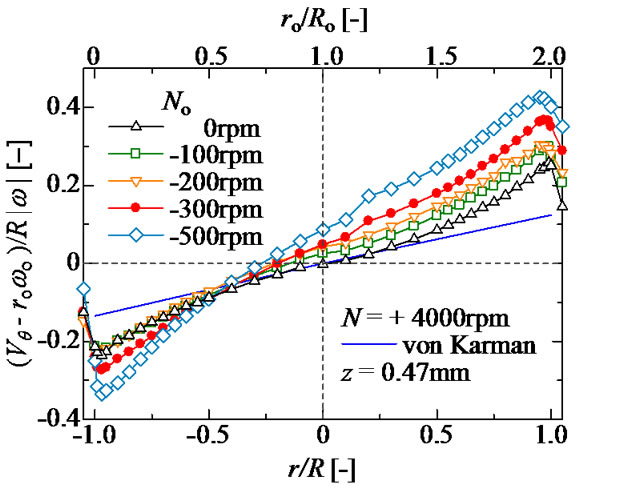 (b)
(b)
Figure 4. Radial distributions of tangential velocity at N = +4000 rpm for opposite directions of spinning and orbital motion (z/δ = 2.5). (a) Actual tangential velocity; (b) Relative tangential velocity to the local orbital velocity.
the orbital radial direction. With the addition of orbital motion in the opposite direction, the tangential velocity increases in the inward region in orbital radial direction within the spiral center and decreases in the outward region.
The relative tangential velocity profiles normalized to the local orbital velocity are shown in Figure 4(b). The relative tangential velocity is estimated by subtracting the orbital velocity at the local orbital radius form the mean tangential velocity, which is the actual velocity. The spiral center of the relative tangential velocity profiles is located inward in orbital radial direction, contrary to the actual tangential velocity. The eccentricity of the spiral center increases with increasing the orbital speed. Furthermore, the magnitude of the relative tangential velocity also increases with increasing the orbital speed. When orbital motion is added in the direction opposite to the direction of spinning, the boundary layer flow is close to the flow at higher Reynolds numbers.
In contrast to the cases of opposite directions of spinning and orbital motion, in the case where the directions of spinning and orbital motion are the same (at N = −4000 rpm), the actual and relative tangential velocities are distributed symmetrically due to the large spinning effect, as shown in Figure 5(a) and (b), respectively. However, the relative tangential velocity profiles around the inflection point near r/R = 0 exhibit a wide region where the velocity gradient in radial direction is extremely small. The relative tangential velocity in the outward region in the orbital radial direction is reduced by adding orbital motion. The swirl intensities on the entire disk are similar to those in the case of the spinning-only test, or tend to be reduced slightly with the addition of orbital motion. We cannot conclude that with the addition of orbital motion the boundary layer flow on the disk with the same directions of spinning and orbital motion is close to the flow at higher Reynolds numbers, contrary to the case of the disk with opposite directions of rotation.
3.3. Fluctuating Tangential Velocity
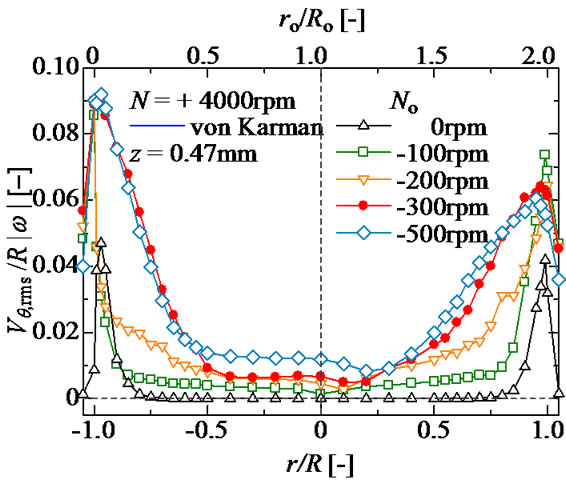
The radial distributions of the root mean square (rms) values of the fluctuating tangential velocity at the same orbital angular position are shown in Figure 6. The velocity in the laminar region around the spinning axis shows slight fluctuation. In the spinning-only test, the
 (a)
(a)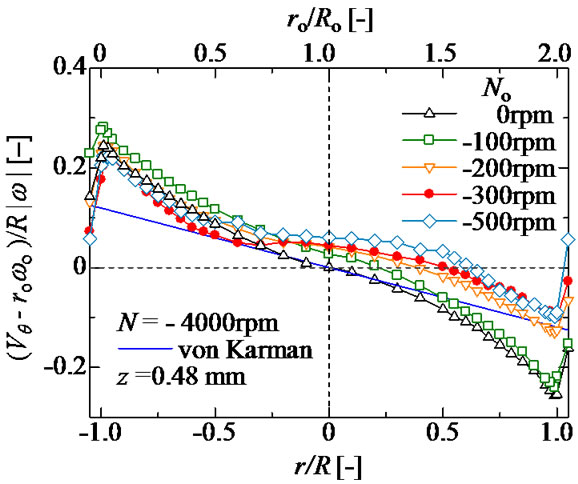 (b)
(b)
Figure 5. Radial distributions of tangential velocity at N = −4000 rpm for coinciding directions of spinning and orbital motion (z/δ = 2.5). (a) Actual tangential velocity; (b) Relative tangential velocity to the local orbital velocity.
 (a)
(a)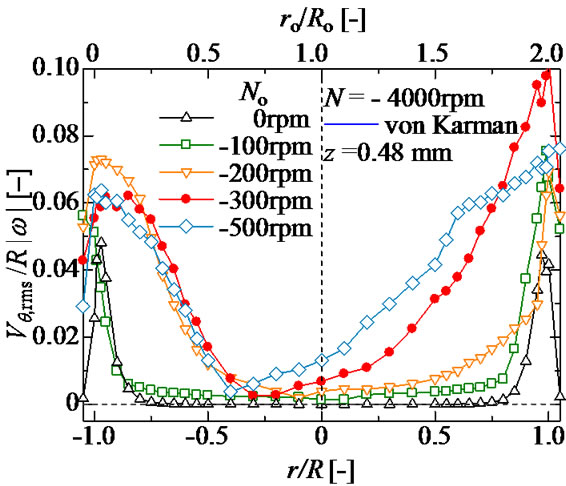 (b)
(b)
Figure 6. Radial distributions of turbulence intensity of tangential velocity at z/δ =2.5. (a) N = +4000 rpm for opposite directions of spinning and orbital motion; (b) N = −4000 rpm for coinciding directions of spinning and orbital motion.
rms of the fluctuating tangential velocity increases rapidly in the region of |r|/R > 0.75. With the addition of orbital motion, the rms of the fluctuating tangential velocity increases from the inward region of the disk, and the laminar region (the small region of fluctuating velocity) shows a narrow distribution with increasing the orbital speed up to 300 rpm. Moreover, the fluctuating velocity in the outward region (r > 0) in orbital radial direction increases from the inward region of the disk in comparison with the inward region (r < 0), regardless of the direction of rotation. The additional centrifugal force due to orbital motion is considered to promote the boundary layer transition since the centrifugal effect due to the orbital motion becomes stronger in the outward region in the orbital radial direction.
3.4. Power Spectral Density of Fluctuating Velocity
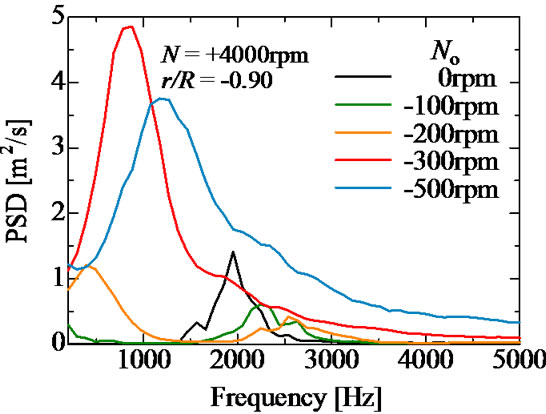
The ensemble-averaged power spectral density (PSD) of the fluctuating tangential velocity at r/R = ±0.90 in the case of opposite directions of rotation (N = +4000 rpm) is shown in Figure 7. The PSD peak at around 2 kHz corresponds to the 30 transient vortices on the spinning disk at N = +4000 rpm. With the addition of orbital motion, the frequency measured at a fixed point is estimated as the apparent frequency. However, the effect of frequency shift with respect to the apparent frequency is relatively small.
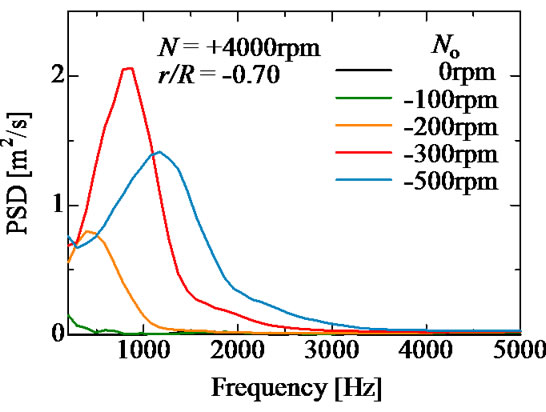
In the frequency range between 2 and 3 kHz, with increasing the orbital speed up to 200 rpm, the peak frequency of PSD at r/R = −0.90 shows a strong shift beyond 2 kHz, and the peak level of PSD decreases, as shown in Figure 7(a). The apparent frequency at r/R = −0.90 in the case of opposite directions of rotation increases slightly, however, beyond that point the increase in frequency is remarkable, although the number of streaks observed in the oil-flow pattern is the same. At No £ −300 rpm, the peak corresponding to the 30 transient vortices is not observed, however, a strong peak at a low frequency is observed in the frequency band up to 2 kHz. The spectrum for No = −200 rpm also shows a peak at a low frequency. Furthermore, the frequency in the low frequency band shifts considerably with increasing the orbital speed. Velocity fluctuation at low frequency is observed from the inward regions of the disk, as shown in Figure 8(a) at r/R = −0.70. It is possible that this velocity fluctuation at a low frequency is caused by streamline-curvature instability due to the centrifugal force since this instability occurs at the lowest Reynolds num-
 (a)
(a) (b)
(b)
Figure 7. Average power spectrum density of Vθ fluctuations at r/R = ±0.90 and z = 0.47 mm (2.5δ). (a) r/R = −0.90; (b) r/R = +0.90.
 (a)
(a)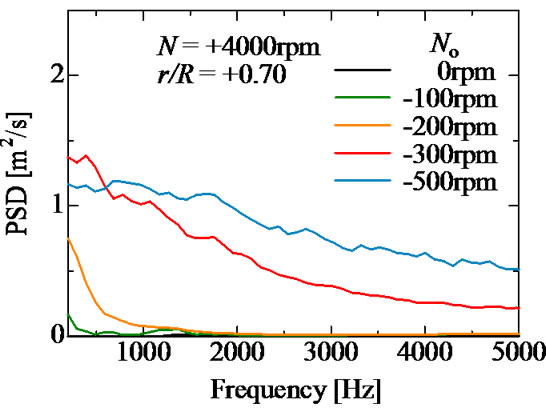 (b)
(b)
Figure 8. Average power spectrum density of Vθ fluctuations at r/R = ±0.70 and z = 0.47 mm (2.5δ). (a) r/R = −0.70; (b) r/R = +0.70.
ber [10]. It has been reported by Wahal et al. that the vortices of streamline-curvature instability are likely to travel [11]. A detailed investigation will be conducted in future work.
The spectra at r/R = +0.90 are shown in Figure 7(b). A PSD peak due to transient vortices is observed at around 1700 Hz at No = −100 rpm. A peak at a low frequency is observed at No = −200, however, the high peak seen in Figure 7(a) is not observed, and the PSD level decreases in the higher frequency band. The spectra at No £ −300 rpm also lack a high peak, and instead maintain a high level over a broad band. This is a characteristic observed after the turbulent transition.
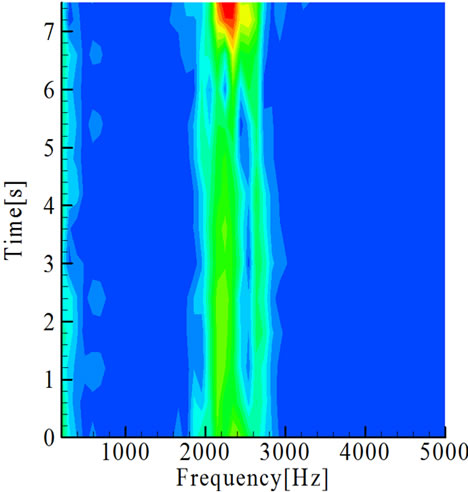
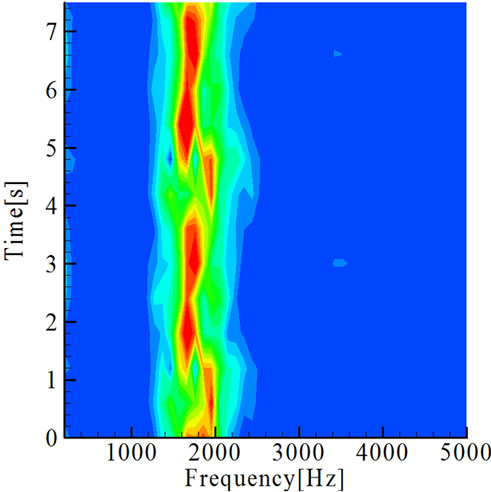
Figure 9 shows the time series of the power spectral density seen in Figure 7. In the spinning-only test, the high-level PSD is distributed evenly at around 2 kHz, which corresponds to the 30 stationary vortices. At No = −100 rpm, the velocity fluctuation with high-level PSD shows an even distribution comparable to that shown in Figures 9(a) and 10(a). Two intermittent frequency bands with a high-level PSD at ro/Ro = 0.1 (r/R = −0.9) are observed with the addition of No = −200 rpm, and at ro/Ro= 1.9 (r/R = +0.9), intermittent fluctuations are observed over a broad band at low frequencies, as shown in Figures 9(b) and 10(b). At No £ −300 rpm and ro/Ro = 0.1 (r/R = −0.9), intermittent velocity fluctuation at a low frequency and a weak intermittent velocity fluctuation in
 (a)
(a)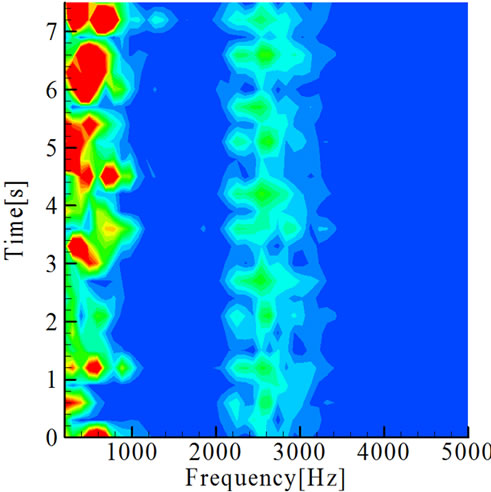 (b)
(b)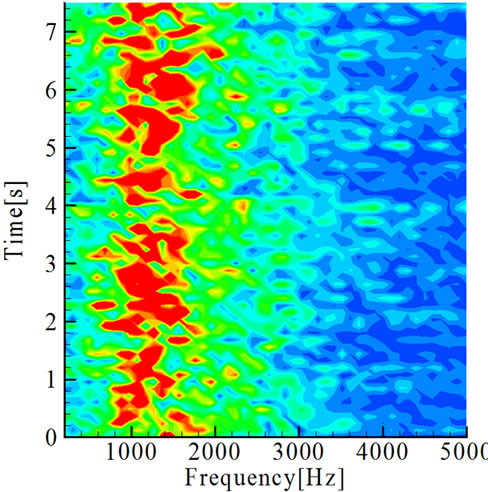 (c)
(c)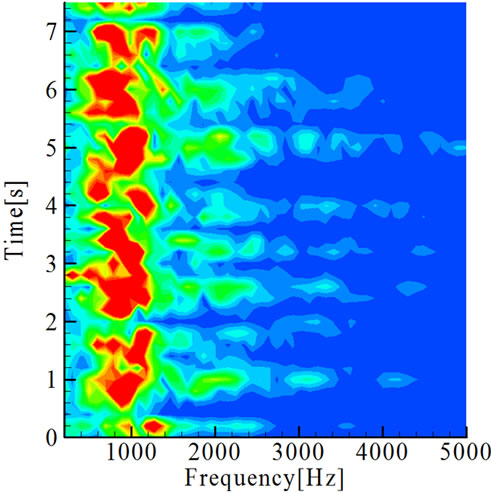 (d)
(d)
Figure 9. Spectrograms of Vq fluctuations at r/R = −0.90, z = 0.47 mm (2.5δ). (a) No = −100 rpm; (b) No = −200 rpm; (c) No = −300 rpm; (d) No = −500 rpm.
the higher frequency band are observed, and the transient vortices are considered to be non-stationary with respect to the disk. At ro/Ro = 1.9 (r/R = +0.9), both the time interval with high-level PSD and the frequency band with the high-level PSD show a random distribution.
Lastly, focusing on the case of No = −300 rpm in the case of opposite directions of rotation at N = +4000 rpm, the intermittent fluctuation at low frequency in the inward region in orbital radial direction (r < 0) is dominant at ro/Ro < 0.5 (r/R < −0.5), even though intermittent transient vortices appear, and discrete fluctuation due to transient vortices is not observed in the outward region, where turbulent transition occurs. The boundary layer flow is found to be extremely asymmetric on the disk, and stationary vortices do not appear on the disk. The lack of streaks in the oil film pattern is attributed to this spatiotemporal unsteadiness. Details regarding the frequency analysis and the vortex structure will be reported elsewhere.
4. Conclusion
In the present work, the effects of orbital motion on the boundary layer flow on a spinning disk have been investigated by flow visualization and hot-wire measurements. With increasing the orbital rotation speed, the laminar region becomes narrower, and transition is promoted from the inward region of the disk, regardless of the direction of rotation. Also, when orbital motion is added, the flow structure in the boundary layer is more asymmetric with respect to the spin axis of the disk. The direction and extent of eccentricity depend on the combination of directions of rotation and the ratio of orbital speed to spinning speed, respectively. It is found that velocity fluctuations at low frequencies depending on the orbital speed are observed intermittently in the region of flow in the eccentric direction relative to the disk. Turbulent transition occurs in the region with flow opposite to the eccentric direction. As a result, stationary vortices do not appear on the disk when the orbital speed is beyond a certain critical value. Therefore, the spatiotemporal unsteadiness in the flow field when orbital motion is added prevents streaks from appearing on the oil film pattern.
5. Acknowledgements
This investigation was supported by the Harada Memorial
 (a)
(a)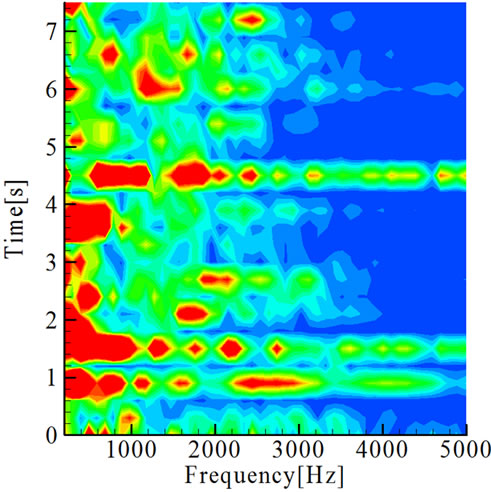 (b)
(b)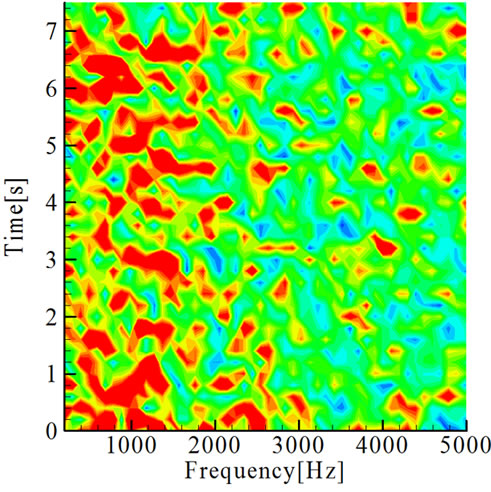 (c)
(c)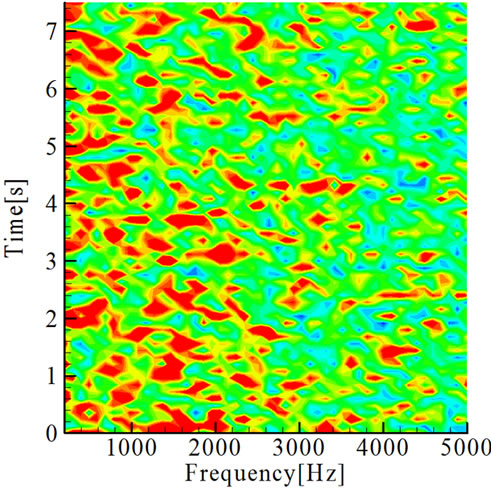 (d)
(d)
Figure 10. Spectrograms of Vq fluctuations at r/R = +0.90, z = 0.47 mm (2.5δ). (a) No = −100 rpm; (b) No = −200 rpm; (c) No = −300 rpm; (d) No = −500 rpm.
Foundation and a Grant-in-Aid for Scientific Research (No. 24560202) from the Japan Society for the Promotion of Science.
REFERENCES
- H. L. Reed and W. S. Saric, “Stability of Three-Dimensional Boundary Layers,” Annual Review of Fluid Mechanics, Vol. 21, No. 1, 1989, pp. 235-284. doi:10.1146/annurev.fl.21.010189.001315
- N. Gregory, J. T. Stuart and W. S. Walker, “On the Stability of Three-Dimensional Boundary Layers with Application to the Flow Due to a Rotating Disk,” Philosophical Transactions of the Royal Society, Vol. 248, No. 943, 1955, pp. 155-199. doi:10.1098/rsta.1955.0013
- Y. Kohama, “Study on Boundary Layer Transition of a Rotating Disk,” Acta Mechanica, Vol. 50, No. 3-4, 1984, pp. 193-199. doi:10.1007/BF01170959
- Y. Kohama, “Turbulent Transition Process of the Spiral Vortices Appearing in the Laminar Boundary Layer of a Rotating Cone,” PhysicoChemical Hydrodynamics, Vol. 6, No. 5-6, 1985, pp. 659-669.
- M. Munekata, S. Kimura, H. Kurishima, J. Tanaka, H. Yoshikawa and H. Ohba, “Effect of the Catch Cup Geometry on the 3D Boundary Layer Flow over the Wafer Surface in a Spin Coating,” Journal of Thermal Science, Vol. 17, No. 1, 2008, pp. 56-60. doi:10.1007/s11630-008-0056-3
- S. Kimura, H. Yoshikawa, M. Munekata, H. Kurishima, S. Yamamoto and H. Ohba, “Effect of Spin-up Acceleration on Onset of Transient Vortices over Rotating Wafer,” Transactions of JSME, Series B, Vol. 74, No. 744, 2008, pp.1735-1740. doi: 10.1299/kikaib.74.1735
- I. Sawada, K. Matsuzaki, T. Tanaka, M. Iwashita and M. Munekata, “Spin Coater and Coating Method,” Japan Patent Kokai 2007-189185, 2007.
- M. R. Malik, S. P. Wilkinson and S. A. Orszag, “Instability and Transition in Rotating Disk Flow,” AIAA Journal, Vol. 19, No. 9, 1981, pp. 1131-1138.
- S. P. Wilkinson and M. R. Malik, “Stability Experiments in the Flow over a Rotating Disk,” AIAA Journal, Vol. 23, No. 4, 1983, pp. 588-595.
- H. Schlichting, “Boundary-Layer Theory,” McGraw-Hill, New York, 1955, pp. 83-89.
- S. Wahal, A. Oztekin, D. E. Bornside, R. A. Brown, P. K. Seidel, P. W. Ackmann and F. T. Geyling, “Visualization of a Gas Flow Instability in Spin Coating Systems,” Applied Physics Letters, Vol. 62, No. 20, 1993, pp. 2584- 2586. doi:10.1063/1.109304.
Nomenclature
r Local radius of disk (m)
ro Local orbital radius (m)
N Spinning velocity (rpm = r/min)
No Orbital velocity (rpm = r/min)
R Disk radius (m)
Ro Orbital radius (m)
Re Local Reynolds number = r2ω/ν
Vq Tangential velocity (m/s)
z Height from the disk surface (m)
Greek Letters
δ Thickness of boundary layer in spinning only = (ν/ω)0.5 (m)
ν Kinematic viscosity of fluid (m2/s)
ω Angular velocity of spinning disk (rad/s)
ωo Angular velocity of orbital motion (rad/s)
NOTES
*Corresponding author.