Advances in Microbiology
Vol.07 No.07(2017), Article ID:77467,20 pages
10.4236/aim.2017.77043
Diet-Induced Alteration of the Murine Intestinal Microbiome Following Antibiotic Ablation
Adam Irvin1, Andrew Cockburn1, Donald A. Primerano2, Jim Denvir2, Goran Boskovic2, Aniello M. Infante3, Gary D. Wu4, Christopher F. Cuff1
1Department of Microbiology, Immunology and Cell Biology, Robert C. Byrd Health Sciences Center, West Virginia University, Morgantown, WV, USA
2Department of Biomedical Sciences, Robert C. Byrd Biotechnology Science Center, Joan C. Edwards School of Medicine, Marshall University, Huntington, WV, USA
3Department of Biostatistics, Robert C. Byrd Health Sciences Center, West Virginia University, Morgantown, WV, USA
4Division of Gastroenterology, Perelman School of Medicine, University of Pennsylvania, Philadelphia, PA, USA

Copyright © 2017 by authors and Scientific Research Publishing Inc.
This work is licensed under the Creative Commons Attribution International License (CC BY 4.0).
http://creativecommons.org/licenses/by/4.0/


Received: May 18, 2017; Accepted: July 4, 2017; Published: July 7, 2017
ABSTRACT
Mouse models of antibiotic-induced ablation of the intestinal microbiome have been used to study the microbiome in health and disease. The fecal microbiomes of mice treated with broad-spectrum antibiotics while being fed different laboratory chows were analyzed by Gram stain, quantitative flow cytometry, bacterial cell culture, next generation sequencing of the V3 regions of the 16S ribosomal RNA (rRNA) gene, microscopy, and sequence analysis of the tuf gene. Noncultivatable gram-positive cocci and cultivatable yeast were the microorganisms most readily detected in feces of antibiotic-treated mice fed a defined diet that utilizes casein as a protein source, maltodextrin 10 and sucrose as sources of carbohydrates, and lard as the major source of fat. High-throughput sequencing of the variable regions of the 16S rRNA gene and tuf gene sequencing identified the major bacterial phylotype as Lactococcus. The mouse chow was heavily laden with noncultivatable Lactococcus, which dominated the intestinal flora after consumption. The microbiome of antibiotic-treated mice fed a grain-based diet (mainly wheat, corn and alfalfa) consisted predominantly of a member of the Enterobacteriaceae identified as Escherichia coli, and yeast was not detected by culture or Gram stain. Appearance of intestinal yeast by culture and Gram stain was dependent on the specific chow, although yeast was not detected by culture or Gram stain in the chow. We conclude that bacteria found in food sources can influence qualitative and quantitative assessments of the fecal microbiome, at least in the context of antibiotic therapy, and potentially confound molecular studies that assess the effects of diet on the intestinal ecology. Not surprisingly, different food sources can influence the microbiome, particularly in the context of antibiotic-mediated ablation of the intestinal microbiome. Whether and how the food-derived dead bacteria alter intestinal physiology needs to be determined.
Keywords:
Mouse, Intestinal Microbiome, Antibiotics, Diet, Lactococcus

1. Introduction
The intestinal microbiome has been identified as a key player in several processes that impact metabolic, nutritional, physiologic and immunologic health [1] . A variety of factors play a role in establishing and maintaining the gut microbiome including age, diet, health, geographic location and genetics [2] - [8] . Dysbiosis within microbiomes has been linked to certain diseases including cancer, obesity, diabetes, atherosclerosis and inflammatory bowel disease [9] [10] .
Murine models of intestinal microbiome disruption are often used to assess the role of normal microbial flora during disease processes. Antibiotics are typically administered either through drinking water or by oral gavages, and are used to selectively target groups of bacteria. Numerous cocktails of antibiotics have been used to either ablate the gut flora of mice or target certain genera of bacteria [11] - [17] .
The present study was undertaken to examine the role of diet in affecting the intestinal microbiome; particularly in the context of antibiotic-induced perturbations in an intestinal ecosystem. We performed quantitative flow cytometric analyses in comparison to previously reported studies that relied on culture methods [17] [18] or qPCR [12] [19] [20] to quantify perturbation of the microbiome. We found and resolved inconsistencies in assays to quantify the numbers of bacteria remaining after antibiotic-induced ablation, and determined that one type of rodent chow contains high numbers of dead Lactococcus, which can affect quantitative analyses and might influence the growth of viable microorganisms in the intestine.
2. Materials and Methods
2.1. Mice
Female C57BL/6 mice, aged 6 weeks old were obtained from The Jackson Laboratory (Bar Harbor, ME) and used under approved protocol number 12-0506.3 from the West Virginia University Institutional Animal Care and Use Committee. Mice were fed D12450B from Research Diets Inc. (New Brunswick, New Jersey) referred to as Open Source chow. This chow contains casein as a protein source, dextromaltan and sucrose as sources of carbohydrates, and lard and soybean oil as main sources of fat. The lot number for chow used for experiments reported in Figure 1, Figure 2, and Figure 4 was not recorded, but lot #1312030 was used during experiments reported in Figure 6, Figure 7, and Figure 8. In some experiments, mice were fed 2018 Teklad Global 18% Protein Rodent Diet chow (EnvigoTeklad, Indianapolis, IN). This chow is grain based and made from wheat, corn, soybeans, and other ingredients. All chow and water were provided ad libitum.
2.2. Antibiotics
Vancomycin (0.5 mg/mL), ampicillin (1.0 mg/mL), metronidazole (1.0 mg/mL) and neomycin (1.0 mg/mL) were dissolved into filtered (0.22 m), sterile water and delivered to mice in light-protected water bottles. All antibiotics were purchased from Sigma Aldrich (St Louis, MO). The commercially available sweetener Equal (Merisant, Chicago, IL) was also added to the antibiotic containing water (3.75 mg/mL) to make the water palatable for the mice. The antibiotic water was made fresh every 48 hours; however, based on minimum inhibitory concentration assays against a laboratory strain of E. coli, it was determined that ampicillin lost 90% of its efficacy within 24 hours in solution.
3. Sample Collection and Processing
3.1. Fecal Pellets
Fresh fecal pellets were collected aseptically, weighed and emulsified in 1 mL of sterile water using a Pellet Pestle Motor from Kimble Chase Kontes (Vineland, NJ). Samples were then centrifuged at 800 × g for 1 minute to remove fecal debris. Five hundred µL of the supernatants were diluted in 500 µL of sterile water for further analysis.
3.2. Mouse Chow
Mouse chow fragments (~50 mg in size) were ground into powder, transferred into 1000 µL of filtered sterile water, and vortexed for 30 seconds. The sample were centrifuged at 10,000 × g for 1 minute, pellets were re-suspended in 1000 µL of filtered sterile water, and centrifuged at 800 × g for 1 minute. The supernatant was transferred to a fresh microcentrifuge tube and centrifuged at 10,000 × g for 1 minute. Pellets were resuspended in 100 µL of filtered sterile water for Gram stain.
3.3. Flow Cytometric Detection and Quantification of Fecal Bacteria
Bacterial cells were quantified using Invitrogen’s Bacteria Counting Kit for flow cytometry (Grand Island, NY, USA). One µL of SYTO BC stain and 10 µL of 1 × 10⁸/mL of microspheres were added to aliquots of fecal samples diluted in filter sterilized 0.15M NaCl and analyzed with a Becton Dickinson FACSCalibur using the following settings: forward scatter E00 gain; side scatter 350 voltage; FL1 412 voltage; FL2 550 voltage and FL3 650 voltage. A region was placed around the beads to capture a quantity of 10,000 beads; another region was placed to capture the number of bacteria that were counted in comparison to the 10,000 beads. WINMDI 2.8 software, (Joe Trotter, Scripps Research Institute, La Jolla, CA) was used to analyze the flow cytometry data. Fresh fecal pellets were collected aseptically, weighed, and emulsified in 1 mL of sterile water using a Pellet Pestle Motor from Kimble Chase Kontes (Vineland, NJ). Samples were then centrifuged at 800 × g for 1 minute to remove fecal debris. Five hundred µL of the supernatants were diluted in 500 µL of sterile water for further analysis.
3.4. Microscopy
Suspensions from fecal pellets were diluted in sterile 0.85% NaCl, and either 1 µL of BacLight Red bacterial stain (Invitrogen, Grand Island, NY, USA) or 1 L of SYTO 9 stain (Invitrogen, Grand Island, NY, USA) was added and incubated for 15 minutes at room temperature in the dark. Stained samples were mounted on glass microscope slides with 1 drop of ProLong Gold (Invitrogen, Grand Island, NY, USA) and cover slipped. The slides were incubated for 24 hours at room temperature in the dark and were examined by confocal microscopy.
For electron microscopy, samples were prepared as described above and then dehydrated through an ascending alcohol series. One hundred μL were placed on corresponding stubs, and then stubs were incubated for 12 hours in sterile Petri dishes to allow for evaporation. The samples were then sputter-coated with gold at a thickness of 3 nm and imaged on a Jeol SEM system (JSM-6610LV; JEOL Ltd., Tokyo, Japan). Acceleration voltage of the SEM was 15 kV.
3.5. DNA Purification and Amplification for 16S Sequencing
Bacterial DNA was isolated from fecal pellets using a QIAamp DNA Stool Mini Kit from Qiagen (Valencia, CA, USA) following the manufacturer’s instructions and stored at −20˚C. The PCR primer sequences, the conditions for amplification of the V3 region of the 16S ribosomal RNA gene, and the multiplexed DNA sequencing strategy were as described [21] unless otherwise indicated. High- pressure liquid chromatography purified PCR primers for the V3 region were obtained from Integrated DNA Technologies (Coral-ville, IA, USA). Bacterial DNA was amplified using an AccuPrime PCR Kit (Invitrogen Life Technologies, Grand Island, NY, USA) on a Techne Genius Model FGEN02TP Thermal Cycler using the following conditions: 95˚C for 6 minutes denature; 95˚C for 2 minutes, 50˚C for 2 minutes, 72˚C for 2 minutes 30 cycles; 72˚C for 4 minutes extend. Each reaction contained 1 U Taq polymerase, 5 μL 10× buffer 1 (600 mM Tris- SO4 (pH 8.9), 180 mM (NH4)2SO4, 20 mM MgSO4, 2 mM deoxyguanosine triphosphate, 2 mM deoxyadenosine triphosphate, 2 mM deoxythymidine triphosphate, 2 mM deoxycytosine triphosphate, thermostable AccuPrime™ protein, 10% glycerol), 1 μL each of 25 μM forward primer and 25 μM reverse primer, and up to 60 ng DNA in a total volume of 50 μL. PCR reactions were performed in triplicate and reaction products were pooled prior to purification. Pooled PCR products were purified by electrophoresis through 2% agarose in Tris/acetate/ ethylene diamine tetraacetic acid gels, and the bands corresponding to approximately 300 base pairs were excised and purified using a QIAquick Gel Extraction Kit (Qiagen, Valencia, CA, USA) according to the manufacturer’s directions. The amplicon of the V3 region ranged from 296 to 327 base pairs, of which 160 base pairs were the primers.
3.6. PCR Amplification with Genus Specific Primers
Bacterial DNA was amplified with Lactococcus or Enterococcus-specific primers using the following conditions: 95˚C for 6 minutes denature; 95˚C for 2 minutes, 50˚C for 2 minutes, 72˚C for 2 minutes 20 cycles; 72˚C for 4 minutes extend. Each reaction contained 1 U Taqpolymerase, 5 μL 10× buffer 1 (600 mM Tris- SO4 (pH 8.9), 180 mM (NH4)2SO4, 20 mM MgSO4, 2 mM deoxyguanosine tri- phosphate, 2 mM deoxyadenosine triphosphate, 2 mM deoxythymidine triphosphate, 2 mM deoxycytosine triphosphate, thermostable AccuPrime™ protein, 10% glycerol), 1 μL each of 25 μM forward primer and 25 μM reverse primer, and up to 100 ng DNA in a total volume of 50 μL. Sequences for the Lactococcus- specific primers were as follows: forward primer―(5’-GTACTTGTACCGACTG- GAT-3’), reverse primer―(5’-GGGATCATCTTTGAGTGAT-3’) [22] . Sequen- ces for Enterococcus-specific primers were as follows: forward primer―(5’- TACTGACAAACCATTCATGATG-3’), reverse primer―(5’-AACTTCGTCA- CCAACGCGAAC-3’) [23] . Sanger sequencing was performed by the Molecular Medicine Core Facility at West Virginia University.
3.7. Illumina HiSeq High Throughput Sequencing
Ribosomal RNA libraries were sequenced in a 2 × 150 base pair paired-end strategy in the Rapid Run mode on an Illumina HiSeq1500 in the Marshall University Genomics Core Facility, so that the forward and reverse reads could be assembled into a single contig. Indexed libraries were pooled so that 12 libraries were sequenced in each lane of the flow cell. Eight picomoles of the pooled libraries were clustered onto an Illumina v2 sequencing flow cell using an Illumina cBOT. Reads were converted from Illumina bcl format to fastq format and separated into bins based on exact match to the index using CASAVA 1.8.2 (Illumina, San Diego CA, USA). A similar workflow and data analysis pipeline (described below) was used to sequence and analyze DNA samples by the WVU Genomics core facility using an Illumina MiSeq. Forward and reverse reads from samples generated on the MiSeq were analyzed independently and yielded essentially identical results.
3.8. HiSeq Data Processing
Sequence files were initially processed by removing sequences corresponding to linkers and primers by automated batch processing using scripts written in- house. In an effort to reduce artifacts generated by sequencing errors, a strict quality filtering protocol was employed as previously described [24] . Scripts written in-house in Biopython were used to convert the filtered Illumina data to the FASTA format for analysis using the open source program Quantitative Insights Into Microbial Ecology (QIIME) [25] for taxonomic assignment and measurements of microbial diversity as previously described [24] . The resulting table of operational taxonomic units (OTUs) was filtered to remove any sequences that appeared less than 100 times.
3.9. Tuf Gene Analysis
The tuf gene encoding elongation factor Tu was amplified with the tuf forward primer: (5’-CCAATGCCACAAACTCGT-3’) and the tuf reverse primer (5’- CCTGAACCAACAGTACGT-3’) [26] . Cloning of the tuf gene was carried out using a TOPO® TA For Sequencing kit from Invitrogen (Grand Island, NY, USA) according to the manufacturer’s instructions. The 830 bptuf gene was amplified by PCR using the following conditions: 95˚C for 6 minutes denature; 95˚C for 2 minutes, 50˚C for 2 minutes, 72˚C for 2 minutes 30 cycles; 72˚C for 4 minutes extend. Each reaction contained 0.5 μL Taq polymerase, 5 μL 10× buffer 1 (600 mM Tris-SO4 (pH 8.9), 180 mM (NH4)2SO4, 20 mM MgSO4, 2 mM deoxyguanosine triphosphate, 2 mM deoxyadenosine triphosphate, 2 mM deoxythymidine triphosphate, 2 mM deoxycytosine triphosphate, thermostable AccuPrime™ protein, 10% glycerol), 1 μL each of 20 μM forward primer and 20 μM reverse primer, and up to 60 ng DNA in a total volume of 50 μL. Plasmids from transformants were extracted using the Mini-Prep 96 from MacConnell Research [San Diego, CA, USA] according to the manufacturer’s instructions. Plasmid inserts were sequenced by WVU Genomics Core Facility by Sanger sequencing.
4. Results
4.1. Gram Stains of Suspensions from Fecal Pellets from Control Mice and Antibiotic-Treated Mice
Initial experiments were performed on the effect of diet on the intestinal microbiome, and casein-containing Open Source chow (Research Diets Inc., New Brunswick, New Jersey) was being used as a food source. Fecal pellets from both control and antibiotic-treated mice that were fed Open Source chow were collected after two weeks of treatment and analyzed by Gram stain. Samples from control mice displayed a diverse population of bacteria, which consisted of both Gram-positive and Gram-negative rods and cocci, and was consistent with normal gastrointestinal microbiota (Figure 1). Gram stains of samples from the antibiotic-treated mice showed distinctly homogeneous Gram-positive cocci, as well as some yeast, demonstrating that antibiotic treatment altered the normal intestinal microbiota.
4.2. Quantitative Flow Cytometry from Antibiotic-Treated and Control Mice
Quantitative cell counts were performed on suspensions of fecal bacteria by flow cytometry (Figure 2). As was observed on the Gram stains, the control mice had a diverse population of bacteria as determined by forward scatter, while the

Figure 1. Gram stains from fecal pellets from control mice (left) and antibiotic-treated mice (right) fed Open Source chow. Photos are taken at 630×.

Figure 2. Quantitative flow cytometry on fecal suspensions from control and antibiotic-treated mice fed Open Source chow. A heterogeneous population of cells was found in the control sample (Control: region i. bacteria), when compared to the antibiotic-treated sample (Antibiotic: region i. bacteria), which yielded a homogenous population of bacteria. Samples from 10 mice per group yielded an average of a 1-log10 difference in bacterial load following antibiotic treatment, p < 0.001 (Quantitation). (i) Bacterial cells, (ii) microspheres added to each sample for quantitation, (iii) debris.
antibiotic-treated mice had a homogeneous population. Ten samples from each group were analyzed, and an approximate 1-log10 reduction in the concentration of bacteria was found in the antibiotic-treated samples when compared to the control samples. By qPCR for 16S gene copy number, an approximately 3-log10 reduction was observed in samples from antibiotic-treated mice compared to controls, confirming previously published data [12] , and raising the possibility that the material identified as “bacteria” by flow cytometry and Gram stain was debris. To confirm that the Gram stain and flow cytometric assays were detecting bacteria, samples were stained with dual fluorescent stains for DNA and peptidoglycan (Figure 3) and examined using confocal microscopy. Results indicate that the putative bacteria contain nucleic acid and peptidoglycan.

Figure 3. Fluorescence microscopy of fecal suspensions stained for bacterial identification using stains specific for nucleic acid (left) and peptidoglycan (right). Photos are taken at 630×.
4.3. V3 16S rRNA DNA Sequencing from Antibiotic-Treated and Control Mice
Paired-end sequencing of the V3 region of the 16S rRNA gene was performed to identify the Gram-positive cocci in the antibiotic-treated mice, and characterize the fecal microbiomes of the treated and nontreated mice (Figure 4). Analysis of normalized data using Metastats [27] identified a statistically significant difference in levels of Lactococcus (p < 0.05). Diversity measurements indicated a statistically significant decrease in the Shannon indices in samples from antibiotic- treated mice. In these samples, 89% - 95% of the Lactococcus-specific OTUs from both the antibiotic-treated and nontreated mice were from a single identical sequence.
4.4. Bacterial Culture
Numerous attempts at culturing the cocci that were observed by Gram stain in the antibiotic-treated samples yielded predominantly yeast (Figure 5), which was confirmed by microscopic examination of wet mount preparations of isolated colonies. Upon closer examination, there were also scant pinpoint colonies. These colonies were isolated and sub-cultured on blood agar plates, yielding alpha-hemolytic colonies (Figure 5). From these colonies, DNA was extracted and the entire 16S rRNA gene was PCR-amplified and sequenced. Sequence analysis identified the alpha-hemolytic colonies as Enterococcus casseliflavus, not Lactococcus. Additional molecular analyses were carried out to resolve why strong Lactococcus genetic signatures were detected, but the only cultivated Gram- positive cocci were identified as Enterococcus.
4.5. Cloning and Sequencing of Tuf Gene
Sequence variation in the tuf gene, a prokaryotic elongation factor, has been previously used to differentiate species of Gram-positive cocci [26] . Therefore,

Figure 4. Taxonomic assignment of bacterial phylotypes found in feces from control and antibiotic-treated mice at the genus level by V3 region 16S rRNA sequence analysis. Each bar represents one mouse that was either non-treated (NT) or antibiotic-treated (ABX). The total height of the bar represents 100% of the assigned sequences after quality filtering, and the height of the individually colored bars represents the relative contribution of the class of organisms. Minor populations not identified in the decoder include the following: pink: Firmicutes (Clostridia), green: Cyanobacteria, red: Unassigned bacteria. Shannon index analysis demonstrates a statistically significant difference between groups.
fecal DNA from antibiotic-treated mice was amplified using degenerate tuf- specific primers, cloned, and sequenced. Fourteen of 14 samples yielded a 99% match with Lactococcus through BLAST. These results confirmed the results from the V3 sequencing data. Culture of a small fragment of a fecal pellet from an antibiotic-treated mouse demonstrated the appearance of Enterococcus-specific PCR product after 16 hours of culture, and appearance of bacteria and yeast in Gram stains of milk after 24 hours of culture. Lactococcus- specific signal by PCR was detected throughout the culture but did not increase (Appendix 1). These results are consistent with the interpretation that dead lactococci and low levels of viable enterococci and yeast were present in the fecal sample. Collectively, the culture and DNA analysis indicated that there was a low level of viable Enterococcus casseliflavus in the fecal samples, but this species was not responsible for the strong Lactococcus signals found in the high throughput sequencing and tuf gene analysis, and probably did not account for the large number of noncultivatable bacteria in the morphometric analyses.
 (a)
(a) (b)
(b)
Figure 5. Cultures of feces from antibiotic-treated mice. Aerobic cultures of the fecal pellets from antibiotic-treated mice yielded an abundant growth of yeast. Samples from two separate mice are shown (a); Upon closer examination, there were pinpoint α-hemolytic colonies that were subcultured for isolation on 5% sheep blood agar (b). The streptococci were identified as Enterococcus casseliflavis by 16S gene sequencing.
4.6. Analysis of Chow
To identify the source of the noncultivatable Lactococcus, a sample of the Open Source chow was processed and Gram stained (Figure 6). The Gram stain results demonstrated that the Open Source chow was heavily laden with Gram- positivecocci, with no yeast observed. In contrast, no bacteria were visualized on the Gram stain of 2018 Teklad Global 18% Protein Rodent Diet chow, which is routinely used in the vivarium. To determine if the bacteria from the Open Source chow was Lactococcus, PCR reactions were performed on both the Open Source chow and the 2018 Teklad Global 18% Protein Rodent Diet chow with both Lactococcus-specific and universal primers for the V4 segment of the 16S rRNA gene (Figure 7). The results demonstrated that both the 2018 Teklad Global 18% Protein Rodent Diet chow and the Open Source chow contained DNA from bacteria; however only the Open Source Chow contained Lactococcus DNA.

Figure 6. Gram stain analysis of Open Source (left) and 2018 Teklad Global 18% Protein Rodent Diet chow (right). The Gram stain showed homogenous Gram-positive cocci in the Open Source diet that resembles the organism from the fecal samples, whereas no bacterial cells were observed in the 2018 Teklad Global chow.

Figure 7. PCR analysis identified Lactococcus DNA in the Open Source Diet chow. The Open Source Diet chow and the 2018 Teklad Global chow were emulsified in sterile, distilled water and PCR reactions were performed using 16S rRNA and Lactococcus-specific primers.
The Open Source and 2018 Teklad Global 18% Protein Rodent Diet chows were analyzed by flow cytometry to compare the forward scatter characteristics of bacteria in the chow with bacteria in the fecal samples of antibiotic-treated mice. The Open Source chow had a distinct bacterial population that resembled the fecal samples from the antibiotic-treated mice, while the 2018 Teklad Global 18% Protein Rodent Diet chow otic-treated mice, while the 2018 Teklad Global 18% Protein Rodent Diet chow lacked a distinct population (Figure 8). A pure culture of Lactococcus was also analyzed for comparison. Finally, examination of the chow by scanning electron microscopy confirmed the presence of easily detected particles that had morphology consistent with bacterial cocci, which were observed in the Gram stains of the mouse chow (Figure 9). Following discussion with scientists at Research Diets, it was determined that Lactococcus is used by a supplier in the manufacture of casein that provides the source of protein in the formulation of chow used in these studies. A sample of casein used in the manufacture of the chow was provided by Research Diets and analyzed by Gram stain.

Figure 8. Flow cytometric analysis of chow. Open Source Diet (left) has a distinct bacterial population that resembles the fecal samples from the antibiotic-treated mice and this population is absent in 2018 Teklad Global chow (center). An analysis on a purified culture of Lactococcus is shown in (right) for comparison.

Figure 9. SEM images of Open Source mouse chow showing particles with morphology that is consistent with Lactococcus. Dashed box in the left hand panel shows the area of magnification in the right hand panel.
The casein contains a high level of Gram-positive cocci as a residual of the manufacturing process (Appendix 2).
4.7. Sequence Analysis on Fecal Suspensions from Antibiotic-Treated Mice Fed Teklad Chow
Ten additional C57BL/6 mice were fed 2018 Teklad Global 18% Protein Rodent Diet chow and treated (or not) with antibiotics. DNA extracted from fecal pellets from both antibiotic-treated and control mice were amplified using V3 16S rRNA primers and sequenced using an Illumina MiSeq. The different source of chow resulted in the appearance of Proteobacteria (Enterobacteriaceae) that dominated the bacterial microbiome (Figure 10). Analysis of normalized data using Metastats [27] identified a statistically significant difference in levels of Proteobacteria (p < 0.01), and analysis of Shannon indices confirmed a

Figure 10. Fecal bacteria microbiome analysis from antibiotic-treated and control mice fed 2018 Teklad Global chow. The total height of the bar represents 100% of the assigned sequences and the height of the individually colored bars represents the relative percentage of organisms. Shannon indices are significantly different between groups. Data represent forward reads of paired end sequences. Reverse reads yielded identical results.
significant reduction in diversity. The antibiotic-treated mice produced an overwhelming dominance―>95% in all 5 mice―of a lactose-fermenting facultative bacterial species that was identified as Escherichia coli by biochemical testing at the WVU Hospital clinical microbiology laboratory, and found to be highly antibiotic resistant. No Lactococcus was detected by microscopic examination, and molecular analysis yielded <0.3% Lactococcus signal (of total identified OTUs) in all samples tested. Ingestion of the 2018 Teklad Global 18% Protein Rodent Diet chow not only produced dominant Enterobacteriaceae, but also failed to promote the growth of yeast. Yeast was not detected in the feces of the mice that were fed 2018 Teklad Global 18% Protein Rodent Diet chow and antibiotic treatment for 10 weeks by either culture or Gram stain. Another group of mice that were on antibiotic treatment and fed the 2018 Teklad Global 18% Protein Rodent Diet chow for 3 weeks and then converted to Open Source chow for the remaining 7 weeks also produced the Enterobacteriaceae with no yeast (data not shown). In comparison, the mice that were on antibiotic treatment and the Open Source chow displayed yeast by culture and Gram stain after 2 weeks.
4.8. Flow Cytometric Analysis of Fecal Bacteria from Antibiotic-Treated Mice Fed Teklad Chow
Fecal suspensions from control and antibiotic-treated mice fed Teklad chow were analyzed by quantitative flow cytometry. In these mice, antibiotic-treatment reduced the concentration of bacteria >100 fold, and the distinct bacterial population of chow-derived Lactococcus was absent (Figure 11).
5. Discussion
This project was undertaken to examine the role of diet in affecting the intestinal microbiome; particularly in the context of antibiotic-induced perturbations in an intestinal ecosystem. The goal was to add quantitative analysis to previously reported studies that relied on culture methods or qPCR in studies of the microbiome. The present experiments, and results previously published by Dollive et al. [12] indicated that by qPCR, antibiotic treatment using this regimen reduced the total fecal bacterial counts by >3 orders of magnitude, whereas yeast greatly outnumbered bacteria. However, quantitative flow cytometry revealed an average of a 1-log10 decrease in bacteria in the fecal samples from antibiotic-treated mice when compared to the control fecal samples. Initially we hypothesized that this disparity was due to variation in the number of 16S rRNA gene copies in bacteria in the altered microbiome; the number of copies can vary from 1 to 15 [28] . Thus, if remaining bacteria have a disproportionately low copy number of 16S gene, then this could partially account for the discrepancy. This hypothesis was rejected because it failed to adequately account for the 2-log10 discrepancy in the quantitative results. Alternative explanations included: 1) the organism was Archaea that resembled bacteria morphologically but had ribosomal RNA-en- coding genes that were not amplified with V3-specific primers; 2) material identified as a microorganism by flow cytometer and Gram stain was actually debris; 3) the Gram-positive organism was dead.
The idea that the organism could be Archaea was provocative since Methanobrevibacter smithii is known to colonize the human gut [29] . Very low signals

Figure 11. Flow cytometric analysis of fecal suspensions from control and antibiotic-treated mice fed Teklad Global chow. A heterogeneous population of cells is displayed in the control sample (top left quadrant of Control), when compared to the antibiotic-treated sample (right panel Teklad). Of note, most of the cells counted in the antibiotic-treated sample in the top left quadrant of the samples from antibiotic-treated mice appear to be debris. Boxed region represents counting beads that were added to the sample for quantitation.
for Archaea were detected in samples from antibiotic-treated mice but not control mice when amplified with universal primers specific for the V4 region of the 16S gene, which should have amplified archaeal DNA. However, PCR analysis of the fecal suspensions of the antibiotic-treated mice failed to amplify with Archaea- specific primers. The microorganisms were bacterial inasmuch as they stained with stains for DNA and peptidoglycan.
Sequence analysis of the V3 region of the 16S rRNA gene indicated that the fecal microbiome in antibiotic-treated mice was dominated by Lactococcus and the presence of Lactococcus was confirmed by PCR amplification of fecal DNA with Lactococcus specific primers and sequencing of the tuf gene. Since the rodent chow was heavily laden with nonliving Lactococcus, it is apparent that the chow was the source of this bacterial signal. This is the same conclusion reached by Dollive et al. [12] , however that study reported a bacterial load of 5 × 10⁴ bacteria/per fecal pellet based on qPCR analysis, which was inconsistent with the flow cytometry and image analysis of fecal suspensions and food pellets. A likely explanation for this disparity in calculated values using qPCR and flow cytometry is that the DNA within the dead Lactococcus is partially degraded and fails to amplify quantitatively by qPCR, in spite of the fact that the nucleic acid stain is still capable of binding to the DNA making it detectable by flow cytometry. Given this scenario, the dead Lactococcus could be thought of as nearly empty shells that facilitate transport of its degraded DNA throughout the intestinal tract. As indicated on product information published by Science Diets, Inc., the major source of protein in the Open Source chow is casein. Casein is commonly produced in food processing procedures by precipitation of milk proteins as a result of acidification by introduced Lactococcuslactis. The casein is then heated, which kills the lactococci. Because Gram stain analysis of a sample of casein demonstrated Gram-positive cocci, we conclude that the source of the Lactococcus in the feces is undoubtedly from the casein that is present in the Open Source chow, but absent from the plant-based Teklad chow.
After the discovery of the Lactococcus in the Open Source chow, the microbiome analysis was repeated with mice fed Teklad Global 2018 chow that was confirmed to be negative for Lactococcus. Firmicutes and Bacteroidetes represented the majority of the bacteria in samples from control mice (no antibiotics) that were fed Open Source chow. The ratio of Firmicutes to Bacteroidetes was essentially flipped in control mice fed the Teklad Global chow. The finding that antibiotic-resistant Enterobacteriaceae dominated in Teklad-fed, antibiotic-treated mice confirms a finding from Hill et al. [19] .
Yeast were observed in Gram stains of every antibiotic-treated mouse fed Open Source diet, confirming the previous study of Dollive et al. Interestingly, although yeast (and low levels of Enterococcus casseliflavis) was consistently detectable in feces from antibiotic-treated mice fed Open Source chow, there was no yeast recovered from the feces of the antibiotic-treated mice that were fed the Teklad Global show, even after 10 weeks of antibiotic treatment. In addition to casein, Open Source chow consists of 35% sucrose. Sucrose has been shown to enhance growth and biofilm formation by Candida albicans [30] [31] , and enhance resistance to apolactoferrin [32] . These factors likely promoted the outgrowth of Candida seen here and previously [12] [29] . In the mice that were fed solely the Open Source chow, we speculate that the additional sucrose supported the growth of Candida, which out-competed antibiotic-resistant bacteria from colonizing the intestine. We further speculate that the ecologic environment in the intestines from mice fed the Teklad Global chow provided antibiotic resistant bacteria the opportunity to colonize and flourish to out-compete the yeast once the Open Source chow was introduced. The Teklad chow is plant-based, and it is possible that components of the chow (such as plant-derived fatty acids) inhibit the growth of yeast. These hypotheses are testable and such work is ongoing.
6. Conclusion
Our results demonstrate that ingestion of chow laden with nonviable Lactococcus is capable of passage through the intestinal tract and appears as the dominant bacteria within the feces in this model of antibiotic-ablation of the intestinal microbiome, albeit at approximately 10% of the concentration of bacteria in mice that are not treated with antibiotics. Thus, it is possible for bacteria in food to influence studies focused on the intestinal microbiome. The results of our study have paved the way for potential future studies of whether and/or to what extent food-derived; nonviable bacteria can alter intestinal physiology.
Acknowledgements
This work was supported by awards from the National Center for Research Resources/Nation Institute of General Medical Sciences (P20RR016477/P20GM- 103434) to the WV-IDeA Network of Biomedical Research Excellence (WV- INBRE). The content is solely the responsibility of the authors and does not necessarily represent the official views of the National Institutes of Health. High throughput DNA sequencing for microbiome analyses was performed at both the Marshall University Genomics Core Facility, which is supported in part by the WV-INBRE grant (P20GM103434), the WVU Genomics Core Facility, which is supported in part by P30GM103488 and P30GM103503, and the Molecular Medicine Core Facility of the Mary Babb Randolph Cancer Center. Flow cytometric analyses were performed in the Flow Cytometry Core Facility, and imaging was performed in the Microscope Imaging Facility of the Mary Babb Randolph Cancer Center, which are supported in part by NIH grants P30GM- 103488, S10OD016165, and S10RR020866. C.F.C was also supported by AI08- 3423 from the National Institutes of Health. The authors thank Dr. Kathleen Brundage, Dr. Jing Jie Yu, and Mr. Ryan Percifield for their technical help. The authors also thank Michael Pellizzon (Research Diets) for critically important discussions, and providing samples of casein for analysis, and Ms. Kaltume Usman Ndayako for help with Gram stains of casein samples.
Cite this paper
Irvin, A., Cockburn, A., Primerano, D.A., Denvir, J., Bos- kovic, G., Infante, A.M., Wu, G.D. and Cuff, C.F. (2017) Diet-Induced Alteration of the Murine Intestinal Microbiome Following Antibiotic Ablation. Advances in Microbiology, 7, 545-564. https://doi.org/10.4236/aim.2017.77043
References
- 1. O'Hara, A.M. and Shanahan, F. (2006) The Gut Flora as a Forgotten Organ. EMBO Reports, 7, 688-693. https://doi.org/10.1038/sj.embor.7400731
- 2. De Filippo, C., Cavalieri, D., Di, P.M., Ramazzotti, M., Poullet, J.B., Massart, S., et al. (2010) Impact of Diet in Shaping Gut Microbiota Revealed by a Comparative Study in Children from Europe and Rural Africa. PNAS, 107, 14691-14696. https://doi.org/10.1073/pnas.1005963107
- 3. Hopkins M.J., Sharp, R. and Macfarlane, G.T. (2001) Age and Disease Related Changes in Intestinal Bacterial Populations Assessed by Cell Culture, 16S rRNA Abundance, and Community Cellular Fatty Acid Profiles. Gut, 48, 198-205. https://doi.org/10.1136/gut.48.2.198
- 4. Khachatryan, Z.A., Ktsoyan, Z.A., Manukyan, G.P., Kelly, D., Ghazaryan, K.A. and Aminov, R.I. (2008) Predominant Role of Host Genetics in Controlling the Composition of Gut Microbiota. PLOS ONE, 3, 3064. https://doi.org/10.1371/journal.pone.0003064
- 5. Turnbaugh, P.J., Ridaura, V.K., Faith, J.J., Rey, F.E., Knight, R. and Gordon, J.I. (2009) The Effect of Diet on the Human Gut Microbiome: A Metagenomic Analysis in Humanized Gnotobiotic Mice. Science Translational Medicine, 1, 6ra14. https://doi.org/10.1126/scitranslmed.3000322
- 6. Turnbaugh, P.J., Quince, C., Faith, J.J., McHardy, A.C., Yatsunenko, T., Niazi, F. et al. (2010) Organismal, Genetic, and Transcriptional Variation in the Deeply Sequenced Gut Microbiomes of Identical Twins. PNAS, 107, 7503-7508. https://doi.org/10.1073/pnas.1002355107
- 7. Yatsunenko, T., Rey, F.E., Manary, M.J., Trehan, I., Dominguez-Bello, M.G., Contreras, M., et al. (2012) Human Gut Microbiome Viewed across Age and Geography. Nature, 486, 222-227.
https://doi.org/10.1038/nature11053 - 8. Shetty, S.A., Marathe, N.P. and Shouche, Y.S. (2013) Opportunities and Challenges for Gut Microbiome Studies in the Indian Population. Microbiome, 1, 24.
https://doi.org/10.1186/2049-2618-1-24 - 9. Hooper, L.V. and Gordon, J.I. (2001) Commensal Host-Bacterial Relationships in the Gut. Science, 292, 1115-1118. https://doi.org/10.1126/science.1058709
- 10. Zackular, J.P., Baxter, N.T., Iverson, K.D., Sadler, W.D., Petrosino, J.F., Chen, G.Y., et al. (2013) The Gut Microbiome Modulates Colon Tumorigenesis. MBIO, 4, Article ID: e00692-13.
https://doi.org/10.1128/mbio.00692-13 - 11. Asahara, T., Shimizu, K., Takada, T., Kado, S., Yuki, N., Morotomi, M., et al. (2011) Protective Effect of Lactobacillus Casei Strain Shirota against Lethal Infection with Multi-Drug Resistant Salmonella Entericaserovar Typhimurium DT104 in Mice. Journal of Applied Microbiology, 110, 163-173. https://doi.org/10.1111/j.1365-2672.2010.04884.x
- 12. Dollive, S., Chen, Y.Y., Grunberg, S., Bittinger, K., Hoffmann, C., Vandivier, L., et al. (2013) Fungi of the Murine Gut: Episodic Variation and Proliferation during Antibiotic Treatment. PLOS ONE, 8, e71806. https://doi.org/10.1371/journal.pone.0071806
- 13. Sekirov, I., Tam, N.M., Jogova, M., Robertson, M.L., Li, Y., Lupp, C., et al. (2008) Antibiotic-Induced Perturbations of the Intestinal Microbiota Alter Host Susceptibility to Enteric Infection. InfectImmun, 76, 4726-4736. https://doi.org/10.1128/IAI.00319-08
- 14. Antonopoulos, D.A., Huse, S.M., Morrison, H.G., Schmidt, T.M., Sogin, M.L. and Young, V.B. (2009) Reproducible Community Dynamics of the Gastrointestinal Microbiota Following Antibiotic Perturbation. InfectImmun, 77, 2367-2375. https://doi.org/10.1128/iai.01520-08
- 15. Croswell, A., Amir, E., Teggatz, P., Barman, M. and Salzman, N.H. (2009) Prolonged Impact of Antibiotics on Intestinal Microbial Ecology and Susceptibility to Enteric Salmonella Infection. InfectImmun, 77, 2741-2753. https://doi.org/10.1128/IAI.00006-09
- 16. Garner, C.D., Antonopoulos, D.A., Wagner, B., Duhamel, G.E., Keresztes, I., Ross, D.A., et al. (2009) Perturbation of the Small Intestine Microbial Ecology by Streptomycin Alters Pathology in a Salmonella Enterica Serovar Typhimurium Murine Model of Infection. InfectImmun, 77, 2691-2702. https://doi.org/10.1128/IAI.01570-08
- 17. Lawley, T.D., Clare, S., Walker, A.W., Goulding, D., Stabler, R.A., Croucher, N., et al. (2009) Antibiotic Treatment of Clostridium Difficile Carrier Mice Triggers a Supershedder State, Spore-Mediated Transmission, and Severe Disease in Immunocompromised Hosts. InfectImmun, 77, 3661-3669. https://doi.org/10.1128/IAI.00558-09
- 18. Goodman, A.L., Kallstrom, G., Faith, J.J., Reyes, A., Moore, A., Dantas, G., et al. (2011) Extensive Personal Human Gut Microbiota Culture Collections Characterized and Manipulated in Gnotobiotic Mice. PNAS, 108, 6252-6257. https://doi.org/10.1073/pnas.1102938108
- 19. Hill, D.A., Hoffmann, C., Abt, M.C., Du, Y., Kobuley, D., Kirn, T.J., et al. (2010) Metagenomic Analyses Reveal Antibiotic-Induced Temporal and Spatial Changes in Intestinal Microbiota with Associated Alterations in Immune Cell Homeostasis. MucosalImmunol, 3, 148-158.
https://doi.org/10.1038/mi.2009.132 - 20. Buffie, C.G. and Pamer, E.G. (2013) Microbiota-Mediated Colonization Resistance against Intestinal Pathogens. Nature Reviews Immunology, 13, 790-801.
https://doi.org/10.1038/nri3535 - 21. Bartram, A.K., Lynch, M.D., Stearns, J.C., Moreno-Hagelsieb, G. and Neufeld, J.D. (2011) Generation of Multimillion-Sequence 16S rRNA Gene Libraries from Complex Microbial Communities by Assembling Paired-End Illumina Reads. Applied and Environmental Microbiology, 77, 3846-3852. https://doi.org/10.1128/AEM.02772-10
- 22. Pu, Z.Y., Dobos, M., Limsowtin, G.K. and Powell, I.B. (2002) Integrated Polymerase Chain Reaction-Based Procedures for the Detection and Identification of Species and Subspecies of the Gram-Positive Bacterial Genus Lactococcus. Journal of Applied Microbiology, 93, 353-361.
https://doi.org/10.1046/j.1365-2672.2002.01688.x - 23. Ke, D., Picard, F.J., Martineau, F., Menard, C., Roy, P.H., Ouellette, M., et al. (1999) Development of a PCR Assay for Rapid Detection of Enterococci. Journal of Clinical Microbiology, 37, 3497-3503.
- 24. Cockburn, A.F., Dehlin, J.M., Ngan, T., Crout, R., Boskovic, G., Denvir, J., et al. (2012) High Throughput DNA Sequencing to Detect Differences in the Subgingival Plaque Microbiome in Elderly Subjects with and without Dementia. Investigative Genetics, 3, 19.
https://doi.org/10.1186/2041-2223-3-19 - 25. Caporaso, J.G., Kuczynski, J., Stombaugh, J., Bittinger, K., Bushman, F.D., Costello, E.K., et al. (2010) QIIME Allows Analysis of High-Throughput Community Sequencing Data. Nature Methods, 7, 335-336. https://doi.org/10.1038/nmeth.f.303
- 26. Li, X., Xing, J., Li, B., Wang, P. and Liu, J. (2012) Use of Tuf as a Target for Sequence-Based Identification of Gram-Positive Cocci of the Genus Enterococcus, Streptococcus, Coagulase-Negative Staphylococcus, and Lactococcus. Annals of Clinical Microbiology and Antimicrobials, 11, 31. https://doi.org/10.1186/1476-0711-11-31
- 27. White, J.R., Nagarajan, N. and Pop, M. (2009) Statistical Methods for Detecting Differentially Abundant Features in Clinical Metagenomic Samples. PLOS Computational Biology, 5, Article ID: e1000352. https://doi.org/10.1371/journal.pcbi.1000352
- 28. Kembel, S.W., Wu, M., Eisen, J.A. and Green, J.L. (2012) Incorporating 16S Gene Copy Number Information Improves Estimates of Microbial Diversity and Abundance. PLOS Computational Biology, 8, Article ID: e1002743. https://doi.org/10.1371/journal.pcbi.1002743
- 29. Hoffmann, C., Dollive, S., Grunberg, S., Chen, J., Li, H., Wu, G.D., et al. (2013) Archaea and Fungi of the Human Gut Microbiome: Correlations with Diet and Bacterial Residents. PLOS ONE, 8, e66019. https://doi.org/10.1371/journal.pone.0066019
- 30. Santana, I.L., Goncalves, L.M., de Vasconcellos, A.A., da Silva, W.J., Cury, J.A. and Del Bel Cury, A.A. (2013) Dietary Carbohydrates Modulate Candida Albicans Biofilm Development on the Denture Surface. PLOS ONE, 8, e64645. https://doi.org/10.1371/journal.pone.0064645
- 31. Pemmaraju, S.C., Pruthi, P.A., Prasad, R. and Pruthi, V. (2016) Modulation of Candida Albicans Biofilm by Different Carbon Sources. Mycopathologia, 181, 341-352.
https://doi.org/10.1007/s11046-016-9992-8 - 32. Nikawa, H., Samaranayake, L.P. and Hamada, T. (1995) Modulation of the Anti-Candida Activity of Apo-Lactoferrin by Dietary Sucrose and Tunicamycin in Vitro. Archives of Oral Biology, 40, 581-584. https://doi.org/10.1016/0003-9969(94)00195-H
Appendix
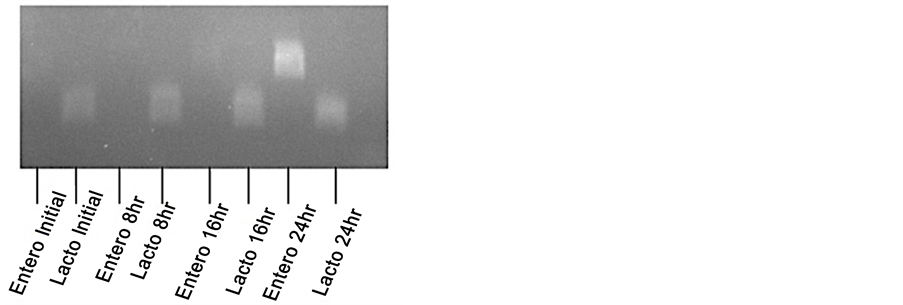
Appendix 1. Culture of fecal pellets in milk. A small fragment of a mouse pellet from an antibiotic-treated mouse was cultured for 24-hour in condensed milk and analyzed by PCR with Lactococcus or Enterococcus―specific primers at 0, 8, 16 and 24-hour time points.
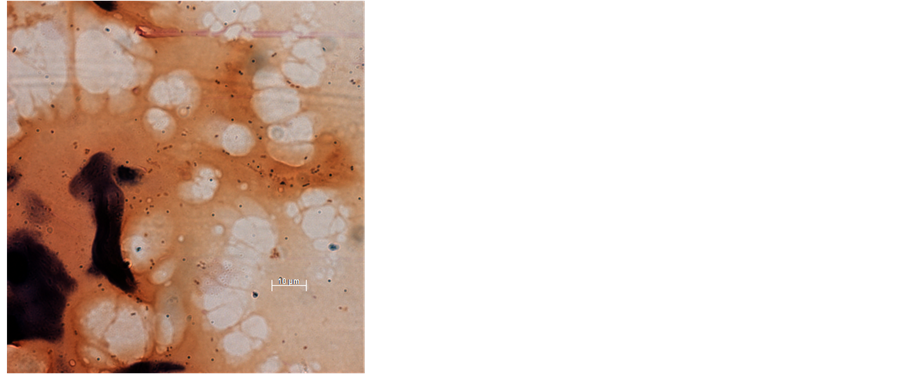
Appendix 2. Gram stain of casein used to produce Open Source chow demonstrates the presence of Gram-positive cocci, which are introduced into milk to precipitate the casein (magnification ×630).

Submit or recommend next manuscript to SCIRP and we will provide best service for you:
Accepting pre-submission inquiries through Email, Facebook, LinkedIn, Twitter, etc.
A wide selection of journals (inclusive of 9 subjects, more than 200 journals)
Providing 24-hour high-quality service
User-friendly online submission system
Fair and swift peer-review system
Efficient typesetting and proofreading procedure
Display of the result of downloads and visits, as well as the number of cited articles
Maximum dissemination of your research work
Submit your manuscript at: http://papersubmission.scirp.org/
Or contact aim@scirp.org