Advances in Microbiology
Vol.07 No.01(2017), Article ID:73277,12 pages
10.4236/aim.2017.71002
Bacterial Fecal Microbiota in Healthy Subjects and Inpatients with Clostridium difficile Infection
Thaís Flecher Barbosa1, Danielle Angst Secco1, Raquel Silva Peixoto1, Alexandre Soares Rosado1, Flavia Lima do Carmo1, Hugo Emiliano de Jesus1, Leandro Araujo Lobo1, Luis Caetano Martha Antunes2, Karla Rodrigues Miranda1,3*, Geraldo Renato de Paula4, Regina Maria Cavalcanti Pilotto Domingues1
1Instituto de Microbiologia Paulo de Góes, Universidade Federal do Rio de Janeiro, Rio de Janeiro, RJ, Brazil
2Escola Nacional de Saúde Pública Sergio Arouca, Fundação Oswaldo Cruz, Rio de Janeiro, RJ, Brazil
3Faculdade de Farmácia, Universidade Federal do Rio de Janeiro―Campus Macaé, Macaé, RJ, Brazil
4Departamento de Tecnologia Farmacêutica, Universidade Federal Fluminense, Niterói, RJ, Brazil

Copyright © 2017 by authors and Scientific Research Publishing Inc.
This work is licensed under the Creative Commons Attribution International License (CC BY 4.0).
http://creativecommons.org/licenses/by/4.0/


Received: October 22, 2016; Accepted: January 1, 2017; Published: January 4, 2017
ABSTRACT
Clostridium difficile is a nosocomial enteric pathogen, considered the main etiological agent of antibiotic-associated diarrhea in hospitals. C. difficile is resistant to several antimicrobial agents used in empiric treatment protocols, which confers selective advantages to this species as compared with other members of the intestinal microbiota. The aim of this study was to evaluate and identify possible alterations of the intestinal microbiota population resulting from the use of antimicrobials associated with infections by C. difficile (CDI). Denaturing Gradient Gel Electrophoresis (DGGE) was used to evaluate fecal samples from two groups: healthy subjects and patients with C. difficile-associated diarrhea (CDAD). A decrease in bacterial diversity was highlighted by the low number of bands in samples from CDAD patients, compared with healthy subjects. This may indicate that antibiotic treatment would affect bacterial diversity, leading to a significant difference between the intestinal microbiota of these two groups, but further studies are still needed. Firmicutes and Verrucomicrobia phyla were detected mainly in healthy individuals, and these could be related to protection factors against the CDI. Klebsiella variicola/K. pneumoniae were found mostly in samples from CDI patients. This study shows the effects of antimicrobials and the CDI itself on human intestinal microbiota.
Keywords:
Clostridium difficile, DGGE, Microbiota, CDAD, Antimicrobials

1. Introduction
The gut microbiota has the most diverse microbial community of all human body sites; it is dominated mainly by two bacterial phyla, the Firmicutes and Bacteroidetes, with a few other phyla, namely Proteobacteria, Actinobacteria and Verrucomicrobia, making up for most of the remaining composition [1] [2] . The healthy intestinal microbiota has an active communication with the host and it is a source of health throughout multiple beneficial interactions. Some researchers have designated this relationship between the human body and its gut microbiota as a “superorganism”, which involves both bacterial and human genes [1] [3] .
The use of antimicrobial agents disturbs the composition of the gut microbiota by shifting the relative proportions of community members. This disturbance allows opportunistic bacteria, such as Clostridium difficile, to establish in this environment [1] . C. difficile is a spore-forming, Gram-positive anaerobe. Also, it is a toxin-producing nosocomial pathogen, described previously as a commensal in the fecal microbiota of neonates [4] [5] . C. difficile infection (CDI) is associated with broad-spectrum antibiotic therapy and elderly hospitalized patients [6] . C. difficile-associated disease (CDAD) is the most important cause of hospital-acquired diarrhea and it is a concern in healthcare management. CDAD incidence has been reported as 10-fold higher among elderly than in young adults [7] [8] [9] . The microbiota composition from the elderly is distinct from that of young adults. Older adults’ microbiota is outlined by an outstanding diversity and marked by an uncommon bacterial distribution, especially among Bacteroides spp. and Clostridium clusters [10] .
Identifying the dominant bacterial species that compose the gut microbiota as per different host conditions and the extent to which these are influenced by antibiotic therapy and host factors is important to unravel the impact of the gut microbiota upon human health and how this microbial community behaves when facing an infection [11] . In the light of this event, current investigation aims to evaluate potential alterations of the intestinal microbiota resulting from the use of antimicrobials and infections by C. difficile.
2. Materials and Methods
2.1. Fecal Samples
A case-control study was conducted. Fecal samples were obtained from 10 healthy individuals, between 61 and 86 years old, who were not undergoing antimicrobial therapy and not hospitalized for at least the previous two months, and from 10 patients, between 64 and 98 years old, who had been diagnosed with CDI at the moment of stool collection (Table 1). Stool samples were stored at −20˚C until used. All samples were taken under patient consent (Research Ethics Committee protocol number 927/07).
2.2. DNA Extraction
DNA was extracted from stool samples using the QIAamp DNA Stool Mini-Kit (Qiagen) according to the manufacturer’s instructions.
2.3. C. difficile Detection
Fecal samples from healthy subjects were inoculated directly or after an alcohol shock procedure on the selective medium cycloserine-cefoxitin-fructose agar (CCFA) and incubated in anaerobic jars for 48 hours at 37˚C (80% N2, 10% CO2 and 10% H2) [12] . Characteristic yellow colonies grown on this medium are identified as C. difficile. Polymerase chain reaction (PCR) targeting the species-specific triose phosphate isomerase gene, tpi, was also employed to verify the presence or absence of C. difficile in stool samples [13] . All fecal samples were also tested for the presence of toxins A and B by the Ridascreen® C. difficile Toxin A/B (r-biopharm) immunoenzymatic assay (ELISA), according to the manufacturer’s instructions. The presence of C. difficile in stool samples from patients diagnosed with CDI (Table 1) was confirmed.
2.4. 16S rDNA Amplification
Two universal (bacteria-specific) primers, L1401R (CGG TGT GTA CAA GGC CCG GGA ACG) and U968F-CG (CGC CCG GGG CGC GCC CCG GGC GGG GCG GGG GCA CGG GGG GAA CGC GAA GAA CCT TAC), were used to amplify the 16S rRNA gene coding region [14] . Amplification reactions were performed in a total volume of 50 µL containing 50 ng of DNA that was extracted from each fecal sample, 10 μM of each primer, 2.5 U of Taq DNA polymerase (Promega), 0.2 mM of each dNTP, 50 mM Tris-HCl (pH 8.3), 40 mM KCl, 5 µg Bovine Serum Albumin (1 mg/mL), 0.5 µL

Table 1. Characteristics of healthy subjects and patients with CDI and antibiotics administered.
aSH: systemic hypertension; DM: diabetes mellitus; EVA: hemorrhagic encephalic vascular accident; ARDS: acute respiratory distress syndrome; CAD: coronary artery disease; UGIB: upper gastrointestinal bleeding; DVT: deep vein thrombosis; *ND: not determined; bVAN: vancomycin; MTZ: metronidazole; MOX: moxifloxacin; LVX: levofloxacin; CIP: ciprofloxacin; MEM: meropenem; TZP: piperacillin-tazobactam; FEP: cefepime; TEC: teicoplanin; TBZ: thiabendazole; IPM: imipenem; LZD: linezolid; ETP: Ertapenem; RIF: rifampin; CLR: clarithromycin; FLC: fluconazole; AMK: Amikacin; CXM: cefuroxime; AMC: amoxicillin-clavulanic acid; CFG: caspofungin.
formamide and 2.5 mM MgCl2. The PCR amplifications were performed in a Veriti® Thermal Cycler (Applied Biosystems) using the following procedure: 94˚C for 4 minutes, followed by 35 cycles of 94˚C for 1 minute, 58˚C for 1 minute, 72˚C for 2 minutes, and a final extension period of 72˚C for 10 minutes. PCR products were visualized on 1.5% (w/v) agarose gels stained with Blue Green Loading Dye I (LGC Biotecnologia) under UV light (MiniBis Pro®, Dnr Bio-Imaging System). PCR amplification products were stored at −20˚C.
2.5. Denaturing Gradient Gel Electrophoresis (DGGE)
DGGEs were carried out using the D-Code system from Bio-Rad Laboratories. PCR products (10 - 15 μl) were loaded onto 6% (w/v), 1 mm thick, polyacrylamide gels, in 1X TAE buffer (20 mM Tris-acetate, pH 7.4, 10 mM acetate, 0.5 mM disodium EDTA), containing a denaturing gradient of urea and formamide varying from 45% to 65%. Electrophoresis was performed at a constant voltage of 75 V for 16 hours. After electrophoresis, the gels were stained for 40 min with SYBR Green I nucleic acid gel stain (Molecular Probes). The gel bands were visualized and digitized using a STORM apparatus (Amersham Pharmacia Biotech). Some bands were retrieved from the gels, reamplified and sequenced. A dendrogram was constructed based on the presence and absence of bands with the unweighted pair group method (UPGMA) with mathematical averages and similarity coefficient of Jaccard (tolerance and optimization of 1%) using the BioNumerics software (Applied Maths).
2.6. Sequencing of Excised DGGE Bands and Bioinformatic Analysis
Bands excised from the DGGE gels were eluted in 30 μL of water (4˚C overnight). Each supernatant (1 μL) was used as the PCR template with primers U968F (without the GC clamp) and L1401R, as described above but without BSA and formamide. PCR amplicons were purified with the GFX PCR DNA & Gel Band (GE Healthcare) kit. The purified products were ligated into a pGEM® T-Easy plasmid vector (Invitrogen) and then transformed into competent Escherichia coli DH10B cells. After bacterial transformation, DNA from selected clones was used as the template in an amplification reaction using M13 primers. The amplicons obtained were purified (Illustra GFXTM PCR DNA and Gel Band Purification Kit, GE Healthcare) and sequenced with an ABI Prism 3100 automatic sequencer (Applied Biosystems Inc.). Sequence quality was analyzed using Codon Code, and nucleotides with a Phred score less than 10 were discarded. Qualified sequences were manually edited using the BioEdit software to remove vector and primer sequences. The resulting sequences were identified by BLASTN analyses using the GenBank database (http://blast.ncbi.nlm.nih.gov/Blast.cgi).
2.7. Statistical Analysis
From the DGGE profiles, a qualitative numerical matrix was generated to non-metric multidimensional scaling (NMDS) using the Bray-Curtis similarity coefficient. To test the significance of the two groups, ANOSIM and PERMANOVA tests were performed using the Past 3.07 software (HAMMER, HARPER & RYAN, 2001). The total number of bands found for each sample was determined and the average was calculated and analyzed by Mann-Whitney test with the Statistical Package for Social Science (SPSS) software version 11.5 (IBM, Chicago, USA).
3. Results
3.1. C. difficile Detection
Samples obtained from healthy subjects were confirmed as negative for the presence of C. difficile and its toxins. On the other hand, samples from individuals diagnosed with CDI had the presence of C. difficile and toxins confirmed.
3.2. Study Samples
All samples used in this study were from subjects older than 61 years, with the same proportion of females and males in both the healthy (average of 72 years of age) and CDI groups (average of 82 years of age), to minimize differences regarding age or gender. All individuals from the CDI group presented one or more clinical conditions, with predominance of respiratory syndromes. These inpatients were submitted to a range of antibiotic therapies, but we observed that metronidazole, vancomycin, carbapenems and/or fluoroquinolones were administered to all individuals (Table 1).
3.3. DGGE Profiles
DGGE analysis of the bacterial 16S rRNA gene was performed to obtain an overview of the community structure. DNA extracted from fecal samples was used as template for PCRs. The amplified 16S rDNA (expected size of 463 bp) were used for DGGE analysis. DGGE profiles containing the group of healthy individuals presented a similar pattern between samples, and this was also observed in the CDI group. Digitalized images obtained for each group were analyzed with BioNumerics 6.5 (Applied Maths NV) software, which allowed marking and counting of bands, as presented in Figure 1. After analysis with Bionumerics it was possible to observe that bacterial diversity was reduced in the CDI group, in comparison to the healthy group. The average of the number of bands was calculated for the healthy (13.5 ± 2.97) and CDI (7.4 ± 2.5) groups (Figure 2). Statistical non-parametric Mann-Whitney test was applied (p value < 0.001) and showed a significant reduction of the number of bands in the CDI samples. A dendrogram showed five main clusters, but an outstanding similarity among samples from the same group, with low similarity between both groups. In general, the similarity observed was higher in the healthy group (70%) when compared to the CDI group (50%). Comparing the two groups, the similarity was very low (30%) (Figure 1). In Figure 3, following the NMDS analysis the samples of the healthy group showed a different behavior from the CDI group, which was confirmed through the ANOSIM and PERMANOVA (p < 0.0001). All these data confirm the differences between the two groups, although a more expressive similarity is highlighted in samples from the healthy group.
3.4. Sequence Analysis of Dominant DGGE Bands
One of the principles of the DGGE technique is that each sample with a different DNA sequence will denature at a different position. So, in theory every band in the gel will represent a distinct bacterium in the studied community. The intensity of the bands of the same sample also gives information about the amount of DNA present, where darker bands are composed of a higher amount of DNA than lighter bands. In this study, the DGGE profiles obtained demonstrated the presence of dominant bands,

Figure 1. Clustering tree based on Jaccard and UPGMA correlations of the DGGE profiles in the health (S1-S10) and CDI group (D1, D4, D5, D6, D7, D9, D10, D11, D17, D33). Letters A-H indicates dominant bands. The bands denoted by arrows were excised and identified by sequencing.
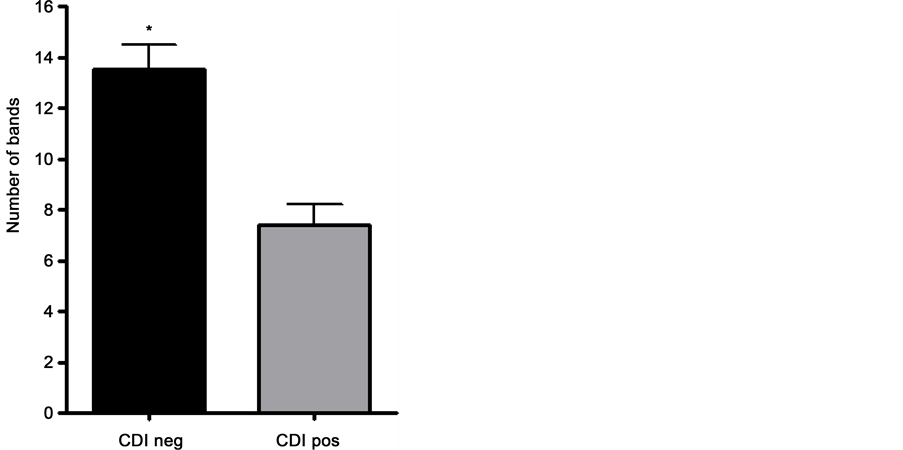
Figure 2. Statistical analysis with the Mann-Whitney test showed differences in the number of bands found in the two groups. The number of bands found in the CDI negative (CDI neg: healthy) and CDI positive (CDI pos: with CDI disease) groups are presented with the standard deviation. Values were presented as units of bands counted in each DGGE profile to show the remarkable difference between the two groups (*p < 0.001).

Figure 3. NMS from DGGE profiles with healthy (black dot) and CDI group (gray dot) confirmed with ANOSIM and PERMANOVA tests (p < 0.0001).
represented by the letters A, B, C, D, E, F, G and H in Figure 1. Table 2 shows the occurrence of these bands. The total incidence was calculated by the number of bands that appeared at the same time in the gel divided by the total of 20 samples. The occurrence in the healthy group was calculated by the number of bands that appeared at the same time in the gel, divided by the 10 CDI negative samples. The same was done for the CDI group. The data in Table 2 shows that bands A and B are exclusive to the healthy group and the CDI positive group had no unique bands. There are bands present in both groups, but with a higher occurrence in the healthy group, such as bands C, E and H. Bands A and B represented bacteria present in most samples of the healthy group and absent in the CDI group. The D band occurred equally in both groups. The F band represents bacteria that appear in higher amounts in the CDI group when compared to the healthy group.
Taking advantage of these results, twenty-six bands (indicated with letters and numbers in Figure 1) from the DGGE profiles corresponding to the healthy and CDAD patients were extracted from DGGE gels, reamplified, cloned and sequenced. Table 2 presents summarized results generated by the NCBI BLAST tool for each of the sequenced bands. Most of the dominant bands A and E from the healthy group were identified as uncultured organisms, whereas band B was identified as a Eubacterium rectale. Furthermore, bands F, G and H were mainly identified as Akkermansia mucinophila. Nevertheless, although some bands were present in both clusters, the identified species was different for each group. For instance, Klebsiella variicola and Klebsiella pneumoniae (band D) were exclusively found in CDI samples.
As can be seen in Table 3, after editing the sequences, BLASTN analyses revealed that three bands (D6, D7 and D17) from the CDI group were closely related to a species
Table 2. Frequency of bacterial groups identified in dominant bands in the DGGE profiles from the healthy and CDI group.
Table 3. BLAST identification of the excised DGGE dominant bands.
from the Proteobacteria phylum, particularly the member of the Enterobacteriaceae family, Klebsiella variicola/K. pneumonia. One band (F1) was identified as belonging to the Firmicutes phylum, an uncultured Ruminococcaceae, and the remaining sequences C4d and D4 were affiliated with Ruminococcus torques and uncultured bacteria, respectively. Concerning the healthy group, the dominating phyla were Firmicutes, represented by the Lachnospiracea family, Eubacterium rectale (B7) and Eubacterium eligens (A5) species, followed by Verrucomicrobia, with Akkermansia sp. being the most representative microorganism. Uncultured Lachnospiraceae (A4 and A8), Lachnospiraceae (B6 and C3), uncultured Clostridia (E2), Akkermansia mucinophila (C4, F4, F8, G6, H3 and H8), uncultured Roseburia (C2), and uncultured bacteria (B3, D5, E4, F6, F17 and H1) were also found.
4. Discussion
The present study evaluated differences in the fecal microbiota of healthy subjects and patients with CDI. It has been reported that administration of broad-spectrum antibiotics, such as carbapenems, metronidazole and vancomycin, leads to a major disturbance in the gut microbiota composition. These alterations result in a large reduction in Firmicutes and Bacteroidetes, and a corresponding remarkable increase of Proteobacteria. The Enterobacteriaceae family was described as the most dramatically altered subgroup of Proteobacteria during antibiotic therapy [15] [16] . Our results showed that the CDI group was characterized by a higher frequency of detection of Klebsiella sp., which was in line with the effect of microbiota disruption through antibiotic treatment in the Enterobacteriaceae family. Although inpatients with CDI were treated with a set of antimicrobials, we could observe a positive correlation between the presence of this Enterobacteriacea family member and administration of metronidazole and vancomycin (Table 1 and Table 3). Rousseau et al. [17] reported that K. pneumonia was frequent in infants colonized by C. difficile. It is possible that this genus may be associated with CDI favoring the colonization by and subsequent pathogenesis of C. difficile. Another microorganism detected in these samples was uncultured Ruminococcaceae, belonging to the Firmicutes phylum. Eubacterium rectale and members from Ruminococcaceae are amylolytic bacteria that increase in response to diets rich in resistant starch [11] .
Many bacterial groups have been associated with protection against C. difficile colonization. Akkermansia sp., together with members of the Clostridiales order, was basically found dominating the healthy gut microbiota [18] . A. mucinophila is a gram- negative, mucin-degradin bacterium and a common member of the human intestinal tract (Derrien et al., 2004). This microorganism has been isolated from fecal samples from healthy adults, infants and elderly. This species co-colonizes the mucosal environment with Ruminococcus, and represents the enterotype 3 previously described [19] [20] [21] .
The detection limit of the DGGE method is estimated to approach 1% of the total population or 106 CFU/g of feces [22] . Advances in next-generation sequencing technologies have emerged in gut microbiota studies, but limitations notwithstanding, DGGE can also provide good qualitative analyses of bacterial compositions and can reveal the major populations of the studied communities. In this work, it was remarkable how bacterial diversity in the intestine from individuals submitted to antimicrobial therapy was dramatically affected, which was previously reported [23] [24] [25] . This dysbiosis allows that the intestinal environment becomes susceptible to opportunistic pathogens like C. difficile, leading to a CDAD.
Acknowledgements
This work was supported by grants from the following Brazilian institutions: Coordenação de Aperfeiçoamento de Pessoal de Nível Superior (CAPES), Fundação Carlos Chagas Filho de Amparo à Pesquisa do Estado do Rio de Janeiro (FAPERJ) and Ministério da Ciência e Tecnologia/Conselho Nacional de Desenvolvimento Científico e Tecnológico (MCT/CNPq).
Cite this paper
Barbosa, T.F., Secco, D.A., Peixoto, R.S., Rosado, A.S., do Carmo, F.L., de Jesus, H.E., Lobo, L.A., Antunes, L.C.M., Miranda, K.R., de Paula, G.R. and Domingues, R.M.C.P. (2017) Bac- terial Fecal Microbiota in Healthy Subjects and Inpatients with Clostridium difficile Infection. Advances in Microbiology, 7, 10- 21. http://dx.doi.org/10.4236/aim.2017.71002
References
- 1. Bien, J., Palagani, V. and Bozko, P. (2013) The Intestinal Microbiota Dysbiosis and Clostridium difficile Infection: Is There a Relationship with Inflammatory Bowel Disease? Therapeutic Advances in Gastroenterology, 6, 53-58. https://doi.org/10.1177/1756283X12454590
- 2. Donaldson, G.P., Lee, S.M. and Mazmanian, S.K. (2016) Gut Biogeography of the Bacterial Microbiota. Nature Reviews Microbiology, 14, 20-32. https://doi.org/10.1038/nrmicro3552
- 3. Ley, R.E., Turnbaugh, P.J., Klein, S. and Gordon, J.I. (2006) Microbial Ecology: Human Gut Microbes Associated with Obesity. Nature, 444, 1022-1023. https://doi.org/10.1038/4441022a
- 4. Rupnik, M., Wilcox, M.H. and Gerding, D.N. (2009) Clostridium difficile Infection: New Developments in Epidemiology and Pathogenesis. Nature Reviews Microbiology, 7, 526-536.
https://doi.org/10.1038/nrmicro2164 - 5. Bartlett, J.G. (1994) Clostridium difficile: History of Its Role as an Enteric Pathogen and the Current State of Knowledge about the Organism. Clinical Infectious Diseases, 18, 265-272. https://doi.org/10.1093/clinids/18.Supplement_4.S265
- 6. Leclair, M.A., Allard, C., Lesur, O. and Pépin, J. (2010) Clostridium difficile Infection in the Intensive Care Unit. Journal of Intensive Care Medicine, 25, 23-30.
https://doi.org/10.1177/0885066609350871 - 7. Balassiano, I.T., dos Santos-Filho, J., de Oliveira, M.P., Ramos, M.C., Japiassu, A.M., dos Reis, A.M., Brazier, J.S., Ferreira, E.O. and Domingues, R.M. (2010) An Outbreak Case of Clostridium difficile-Associated Diarrhea among Elderly Inpatients of an Intensive Care Unit of a Tertiary Hospital in Rio de Janeiro, Brazil. Diagnostic Microbiology and Infectious Disease, 68, 449-455.
https://doi.org/10.1016/j.diagmicrobio.2010.07.017 - 8. Graf, K., Cohrs, A., Gastmeier, P., Kola, A., Vonberg, R.P., Mattner, F., Sohr, D. and Chaberny, I.F. (2009) An Outbreak of Clostridium difficile-Associated Disease (CDAD) in a German University Hospital. European Journal of Clinical Microbiology & Infectious Diseases, 28, 543-545. https://doi.org/10.1007/s10096-008-0655-7
- 9. Gravel, D., Miller, M., Simor, A., Taylor, G., Gardam, M., McGeer, A., Hutchinson, J., Moore, D., Kelly, S., Boyd, D., Mulvey, M. and Canadian Nosocomial Infection Surveillance Program (2009) Health Care-Associated Clostridium difficile Infection in Adults Admitted to Acute Care Hospitals in Canada: A Canadian Nosocomial Infection Surveillance Program Study. Clinical Infectious Disease, 48, 568-576. https://doi.org/10.1086/596703
- 10. Claesson, M.J., Cusack, S., O’Sullivan, O., Greene-Diniz, R., de Weerd, H., Flannery, E., et al. (2011) Composition, Variability, and Temporal Stability of the Intestinal Microbiota of the Elderly. Proceedings of National Academy of Sciences of the United States of America, 108, 4586-4591. https://doi.org/10.1073/pnas.1000097107
- 11. Walker, A.W., Ince, J., Duncan, S.H., Webster, L.M., Holtrop, G., Ze, X., Brown, D., Stares, M.D., Scott, P., Bergerat, A., Louis, P., McIntosh, F., Johnstone, A.M., Lobley, G.E., Parkhill, J. and Flint, H.J. (2011) Dominant and Diet-Responsive Groups of Bacteria within the Human Colonic Microbiota. The ISME Journal, 5, 220-223. https://doi.org/10.1038/ismej.2010.118
- 12. Jousimies-Somer, H.R., Summanen, P., Ciron, D.M., Baron, E.J., Wexler, H.M. and Finegold, S.M. (2002) Anaerobic Bacteriology Manual. Star Publishing Company, Belmont.
- 13. Lemee, L., Dhalluin, A., Testelin, S., Mattrat, M., Maillard, K., Lemeland, J.F. and Pons, J.L. (2004) Multiplex PCR Targeting tpi (Triose Phosphate Isomerase), tcdA (Toxin A), and tcdB Genes for Toxigenic Culture of Clostridium difficile. Journal of Clinical Microbiology, 42, 5710-5714. https://doi.org/10.1128/JCM.42.12.5710-5714.2004
- 14. Nübel, U., Engelen, B., Felske, A., Snaidr, J., Wieshuber, A., Amann, R.I., Ludwig, W. and Backhaus, H. (1996) Sequence Heterogeneities of Genes Encoding 16S rRNAs in Paenibacibacillus polymyxa Detected by Temperature Gradient Gel Electrophoresis. Journal of Bacteriology, 178, 5636-5643. https://doi.org/10.1128/jb.178.19.5636-5643.1996
- 15. Rea, M.C., Dobson, A., O’Sullivan, O., Crispie, F., Fouhy, F., Cotter, P.D., Shanahan, F., Kiely, B., Hill, C. and Ross, R.P. (2011) Effect of Broad- and Narrow-Spectrum Antimicrobials on Clostridium difficile and Microbial Diversity in a Model of the Distal Colon. Proceedings of National Academy of Sciences of the United States of America, 108, 4639-4644.
https://doi.org/10.1073/pnas.1001224107 - 16. Cotter, P.D., Stanton, C., Ross, R.P. and Hill, C. (2012) The Impact of Antibiotics on the Gut Microbiota as Revealed by High Throughput DNA Sequencing. Discovery Medicine, 13, 193-199.
- 17. Rousseau, C., Levenez, F., Fouqueray, C., Doré, J., Collignon, A. and Lepage, P. (2011) Clostridium difficile Colonization in Early Infancy Is Accompanied by Changes in Intestinal Microbiota Composition. Journal of Clinical Microbiology, 49, 858-865.
https://doi.org/10.1128/JCM.01507-10 - 18. Seekatz, A.M. and Young, V.B. (2014) Clostridium difficile and the Microbiota. Journal of Clinical Investigation, 124, 4182-4189. https://doi.org/10.1172/JCI72336
- 19. Derrien, M., Vaughan, E.E., Plugge, C.M. and de Vos, W.M. (2004) Akkermansia muciniphila gen. nov., sp. nov., a Human Intestinal Mucin-Degrading Bacterium. International Journal of Systematic and Evolutionary Microbiology, 54, 1469-1476.
https://doi.org/10.1099/ijs.0.02873-0 - 20. Arumugam, M., Raes, J., Pelletier, E., Le Paslier, D., Yamada, T., Mende, D.R., et al. (2011) Enterotypes of the Human Microbiome Gut Microbiome. Nature, 473, 174-180.
https://doi.org/10.1038/nature09944 - 21. Collado, M.C., Derrien, M., Isolauri, E., de Vos, W.M. and Salminen, S. (2007) Intestinal Integrity and Akkermansia muciniphila, a Mucin-Degrading Member of the Intestinal Microbiota Present in Infants, Adults, and the Elderly. Applied and Environmental Microbiology, 73, 7767-7770. https://doi.org/10.1128/AEM.01477-07
- 22. Vael, C., Vanheirstraeten, L., Desager, K.N. and Goossens, H. (2011) Denaturing Gradient Gel Electrophoresis of Neonatal Intestinal Microbiota in Relation to the Development of Asthma. BMC Microbiology, 11, 68-74. https://doi.org/10.1186/1471-2180-11-68
- 23. Hopkins, M.J. and Macfarlane, G.T. (2002) Changes in Predominant Bacterial Populations in Human Faeces with Age and with Clostridium difficile Infection. Journal of Medical Microbiology, l51, 448-454. https://doi.org/10.1099/0022-1317-51-5-448
- 24. Gu, S., Chen, Y., Zhang, X., Lu, H., Lv, T., Shen, P., Lv, L., Zheng, B., Jiang, X. and Li, L. (2016) Identification of Key Taxa That Favor Intestinal Colonization of Clostridium difficile in an Adult Chinese Population. Microbes and Infection, 18, 30-38.
https://doi.org/10.1016/j.micinf.2015.09.008 - 25. Yassour, M., Vatanen, T., Siljander, H., Hamalainen, A.M., Harkonen, T., Ryhanen, S.J., Franzosa, E.A., Vlamakis, H., Huttenhower, C., Gevers, D., Lander, E.S., Knip, M., on Behalf of the DIABIMMUNE Study Group and Xavier, R.J. (2016) Natural History of the Infant Gut Microbiome and Impact of Antibiotic Treatment on Bacterial Strain Diversity and Stability. Science Translational Medicine, 8, 343-381. https://doi.org/10.1126/scitranslmed.aad0917