Advances in Microbiology
Vol.3 No.6(2013), Article ID:38157,11 pages DOI:10.4236/aim.2013.36064
Development of Medium and Kinetic Modeling for Enhanced Production of Cutinase from Pseudomonas cepacia NRRL B-2320
Biochemical Engineering Laboratory, Department of Biotechnology, Indian Institute of Technology Guwahati, Guwahati, India
Email: *veeranki@iitg.ernet.in
Copyright © 2013 Kasturi Dutta et al. This is an open access article distributed under the Creative Commons Attribution License, which permits unrestricted use, distribution, and reproduction in any medium, provided the original work is properly cited.
Received August 10, 2013; revised September 9, 2013; accepted September 19, 2013
Keywords: Cutinase; Kinetics; Bioprocessing; Optimization; Parameter Identification
ABSTRACT
The development of medium for the production of cutinase from Pseudomonas cepacia NRRL B 2320 was carried out using Plackett-Burman experimental design followed by central composite design. The medium components were screened by Plackett-Burman experimental design which suggested that cutin, peptone, KCl and MgSO4·7H2O have influenced the cutinase production significantly with very high confidence levels. The concentration levels of these four components were optimized using 24 full factorial central composite design. An optimum combination of 10.06 g·L−1 of cutin, 17.77 g·L−1 of peptone, 0.635 g·L−1 of KCl and 5.455 g·L−1 of MgSO4·7H2O in the medium gave a maximum cutinase activity of 336 U·mL−1. An overall 2 fold increase in the production of cutinase was observed in the optimized medium. Growth and production of cutinase from P. cepacia NRRL B 2320 have been studied in shake flask and batch bioreactor. Time course of cell growth and enzyme production was fitted to the existing kinetic models reported in the literature to estimate the biokinetic parameters. These models suggested that the production of cutinase is growth associated in shake flask and it is a mixed growth type in a batch bioreactor.
1. Introduction
Cutinases (3.1.1.74) are hydrolytic enzymes, the smallest member of α/β hydrolase family [1], that degrade cutin, which is the cuticular polymer of higher plants, composed of hydroxy and epoxy fatty acids polyester [2,3]. Cutinase is a versatile enzyme and shows several properties, which is used in various industries. In addition to hydrolysis, it also catalyzes esterification and transesterification reactions that make it a highly potential industrial enzyme. Cutinase has potential use in dairy industry for hydrolysis of milk fat, house hold detergents, oleochemical industry, synthesis of structured triglycerides, polymers and surfactants [4], synthesis of ingredients for personal-care products, synthesis of pharmaceuticals and agrochemicals containing one or more chiral centers [5,6]. At low water activities transesterification of fats and oils or stereo selective esterification of alcohols can be achieved using cutinase.
Previously, we have screened different Pseudomonas strains for potential cutinase producer using cutin as sole carbon source and inducer (data not shown). Among tested microorganisms, Pseudomonas cepacia NRRL B-2320 was found to be the best producer and selected for further optimization of medium components. Screening and assessment of nutritional requirements of microorganism are important steps for bioprocess development. An optimization study using the one-variable-ata-time approach is tedious and also fails to explain the effects of interaction among the factors and might lead to misinterpretation of results. In contrast, statistical methodologies are generally preferred due to their advantages [7,8] such as reducing the number of experiments and allowing extraction of more information about possible interaction effects among the factors. Statistically designed experiments can also reduce the error in determining the effect of parameters in an economical manner [9]. Process optimization plays a major role in industrial production processes in which even small improvements would be crucial for commercial success. In any bioprocess, the improvement in productivity of any metabolite would be achieved through manipulation of nutritional and physical parameters. The Plackett-Burman experimental design is applied for screening the most significantly influencing parameters from a pool of a large number of process variables. So, these designs are pretty useful in preliminary studies in which the principal aim is to select variables that can be fixed or removed for further optimization processes such as response surface methodology (RSM), which is an efficient strategic experimental tool by which the optimal conditions of a multivariable system would be determined.
In the present study, the statistical experimental design techniques were applied for the development of media and enhanced production of cutinase from P. cepacia NRRL B 2320. Initially, the medium components were screened by using the Plackett-Burman experimental design. The optimal levels of significantly influencing medium components were determined by using the central composite experimental design. The time course of cell growth and enzyme production was fitted to the existing kinetic models.
2. Materials and Methods
2.1. Preparation of Cutin
Cutin was prepared from fresh tomato peels using the method described by [10]. In brief, tomato peels collected from fresh tomatoes were boiled in oxalic acid/ ammonium oxalate buffer for 3 - 4 hours. After cooling to room temperature, the peels were digested with enzymes (cellulase and pectinase) to remove pectin and cellulose and subjected to extensive solvent extraction with methanol-chloroform in soxhlet apparatus to remove the embedded waxes and then dried in an oven at 40˚C. These dried peels were ground to powder (<20 mesh) to get cutin.
2.2. Microorganisms and Its Maintenance
The bacterium used throughout the study, P. cepacia NRRL B 2320 (also known as Burkholderia cepacia) was procured from Agricultural Research Service (ARSCulture collection), USDA, Peoria, USA. The organism was grown on nutrient agar medium at 28˚C. The organism was sub-cultured every month and maintained at 4˚C ± 1˚C.
2.3. Seed Culture Medium
The medium used for the development of seed culture contained (g·L−1): glucose 6.0, beef extract 3.0, peptone 15.0, urea 6.0, KH2PO4 2.0, KCl 0.5, MgSO4·7H2O 5.0 and pH 7 [11]. The seed culture medium was inoculated with a loop full of pure culture grown on nutrient agar slant. The culture was then incubated for 10 h (to reach culture OD at 600 nm: 0.6 - 0.8) at 28˚C and 180 rpm.
2.4. Production Medium
The following medium was used for the production of cutinase (g·L−1): beef extract 3.0, peptone 15.0, urea 6.0, KH2PO4 2.0, KCl 0.5, MgSO4·7H2O 5.0 and cutin 4.0. The pH of the medium was adjusted to 7. A 2% of inoculum from the above seed culture was added to 50 ml of the medium in 250 ml Erlenmeyer flasks. The flasks were incubated in a shaking incubator at 28˚C and 180 rpm. Samples were withdrawn at regular interval of time and measured for cutinase production. Experiments were conducted in duplicates and enzymatic assay was performed in duplicates for each sample.
2.5. Cutinase Assay
Samples were centrifuged at 10,000 × g for 10 min at 4˚C ± 1˚C. The supernatant was separated and used for assaying cutinase activity. The activity was measured by following the hydrolysis of p-nitrophenyl butyrate (pNPB) (Sigma) as substrate. An aliquot of (0.020 ml) culture supernatant was added to 0.98 ml of reaction mixture, which was prepared by adding 1 ml 23 mM pNPB in tetrahydrofuran to 40 ml of 50 mM potassium phosphate buffer containing 11.5 M sodium deoxycholate. The reaction was monitored for 15 minutes at 37˚C and absorbance of released p-nitrophenol measured at 410 nm. One enzyme unit is defined as the amount of enzyme required to release one µMol of p-nitrophenol min−1 under assay condition.
The production of cutinase was confirmed by cutinase assay using cutinase specific substrate, p-nitrophenyl (16-methyl sulphone ester) hexadecanoate (p-NMSH)). p-NMSH was prepared in our laboratory according to the method described [12]. Assay was performed using the method described in enzyme assay, with the change in incubation period for 1 hour instead of 5 min at 55˚C. One unit of enzyme activity is defined as release of 1 µmol of p-nitrophenol per min. Specific activity is defined as the activity of an enzyme per milligram of total protein (expressed in μmol/min/mg).
2.6. Growth Measurement
Due to the presence of cutin, cell dry-weight concentration could not be measured directly and therefore, intracellular protein concentration was measured [13]. The relationship with cell dry weight and intracellular protein was established as:

2.7. Protein Determination
The total protein contents of the samples were determined according to the method described by Lowry’s method to determine the specific activity of cutinase. The bovine serum albumin (Sigma) was used as standard.
2.8. Optimization Procedure
The optimization of medium constituents for maximization of cutinase production by P. cepacia NRRL B 2320 was carried out in two stages.
2.8.1. Screening of Significantly Influencing Medium Components by Plackett-Burman Experimental Design Technique
The Plackett-Burman experimental design was applied to screen the significantly influencing medium components to maximize the production of cutinase [14]. Total of seven parameters viz., cutin, peptone, beef extract, urea, KH2PO4, KCl and MgSO4·7H2O have been considered for screening experiment. The data range was varied based on the original medium composition as shown in Table 1. Each variable is represented at two levels, i.e., a high (+) and low (−). According to Plackett-Burman experimental design a total of 12 experiments were performed. The levels of variables and design matrix in the coded levels and real values are shown in the Table 1. Plackett-Burman experimental design is based on the first order polynomial model:
 (1)
(1)
where, Y is the response (enzyme activity), b0 is the model intercept, bi is the linear coefficient, and xi is the level of the independent variable. The significance of each variable was determined using student’s t-test. All experiments were conducted in duplicates and averages of the results were taken as the response.
2.8.2. Optimization of Screened Medium Components for the Production of Cutinase from P. cepacia NRRL B2320
The central composite experimental design [15] has been applied to optimize the levels and explain the combined effect of the significantly influencing medium constituents, viz. cutin, peptone, KCl and MgSO4·7H2O on the production of cutinase from P. cepacia NRRL B 2320. Each variable (medium component) was assessed at five coded levels (−2, −1, 0, +1, and +2) with 30 (=2k + 2k + 6) treatment combinations, where, k is the number of independent variables [16]. Twenty four experiments were augmented with six replications at the center points to evaluate the pure error. The minimum and maximum ranges of the variables were used and the full experimental plan with regard to their values in actual and coded form is provided in Table 3. The quadratic model for predicting the optimal levels was expressed according to the Equation (2).
 (2)
(2)
where, Y is the predicted response, k is the number of factor variables, Xi and Xj are independent variables, β0 is the offset term, βi is the ith linear coefficient, βii is the ith
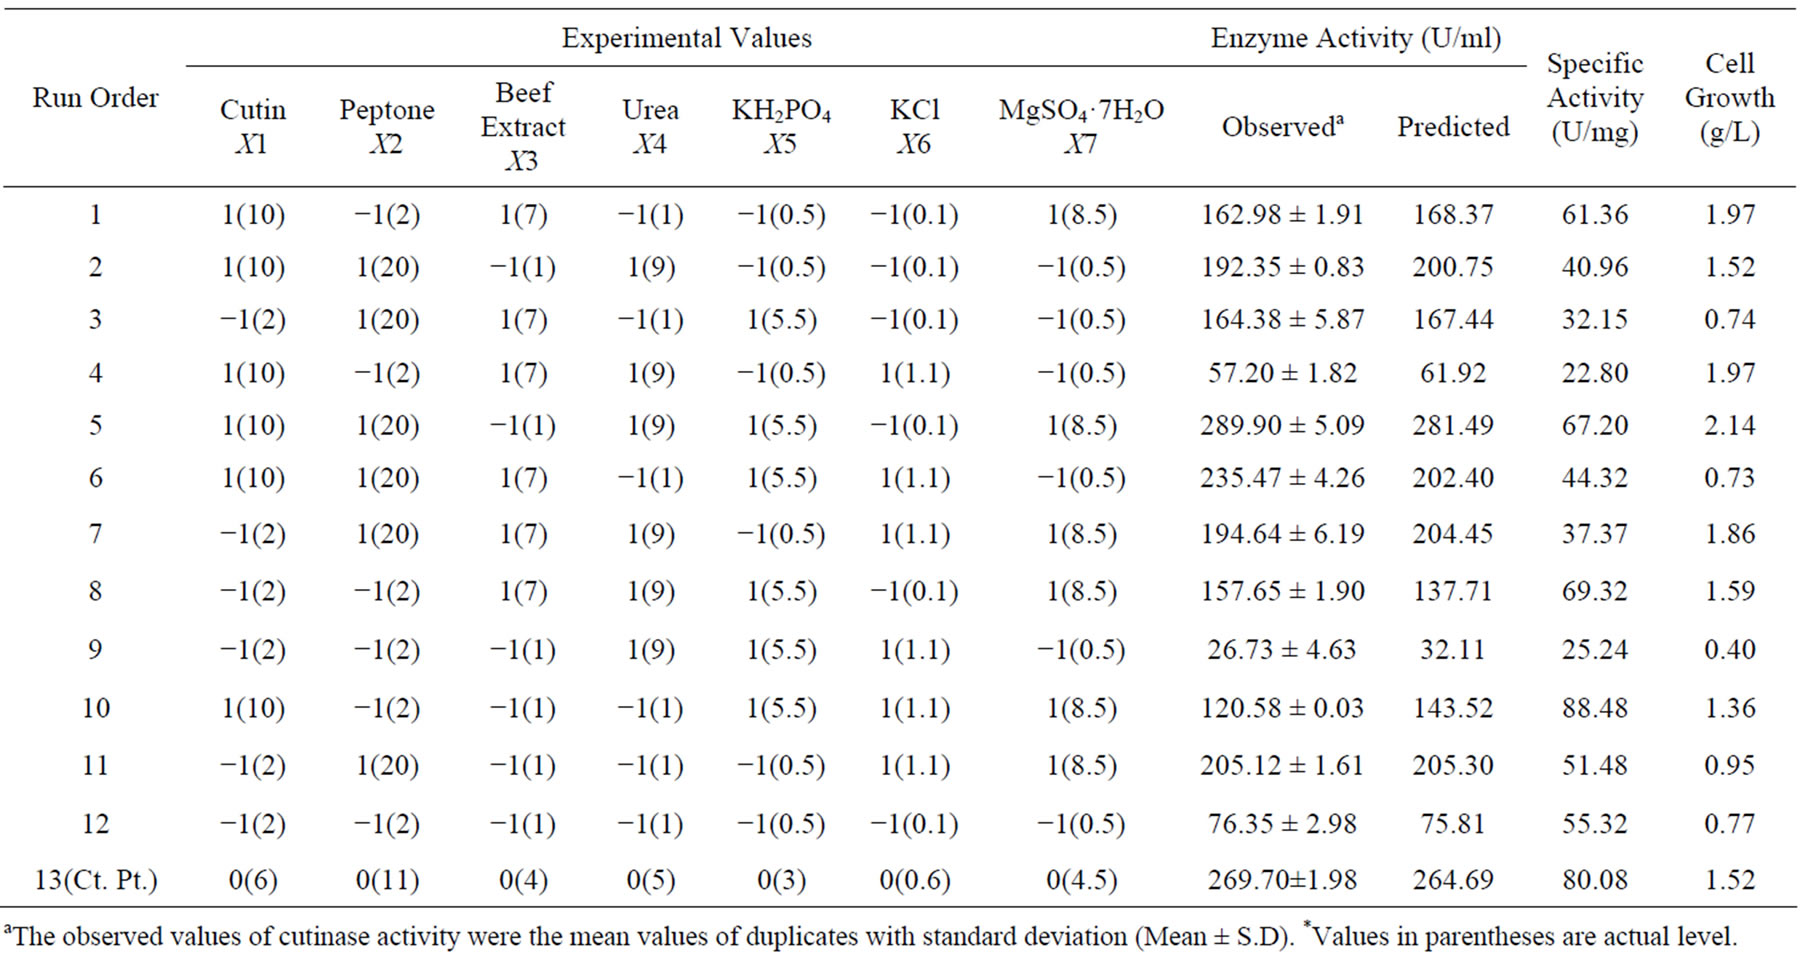
Table 1. Plackett-Burman design matrix with coded and actual values along with the observed and predicted cutinase production.
aThe observed values of cutinase activity were the mean values of duplicates with standard deviation (Mean ± S.D). *Values in parentheses are actual level.
quadratic coefficient and βij is the ijth interaction coefficient. The statistical software package, MINITAB® Release 15.1, PA, USA was used for the regression analysis of the experimental data, and also to plot the response surface graphs.
2.9. Unstructured Model Prediction
To estimate the biokinetic constants involved in the microbial growth and cutinase production process, various unstructured models reported in the literature were used to fit the experimental data on cutinase production and biomass growth of P. cepacia. The equations used for growth and production kinetics are given below.
Logistic model for growth [17]
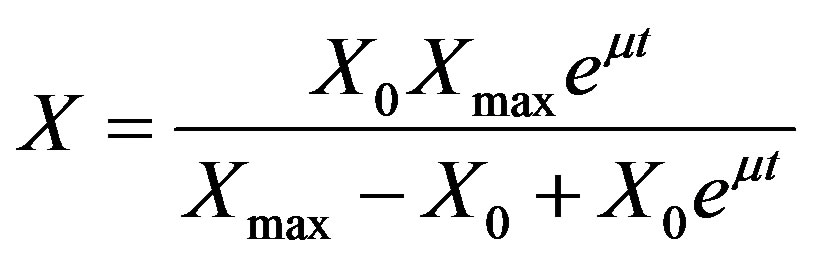 (3)
(3)
where, X is cell biomass (g·L−1), X0 is initial biomass (g·L−1), Xmax is the maximum biomass in (g·L−1) and μ is specific growth rate (h−1).
Logistic Model for production [17]
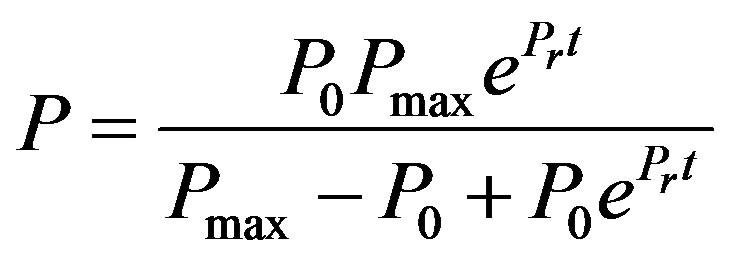 (4)
(4)
where, P is the cutinase activity (U·mL−1), P0 is the initial cutinase activity (U·mL−1), Pmax is the maximum cutinase activity (U·mL−1) and Pr ratio between the initial volumetric rate of product formation and the initial product concentration P0.
Luedeking-Piret Model for Production [18]
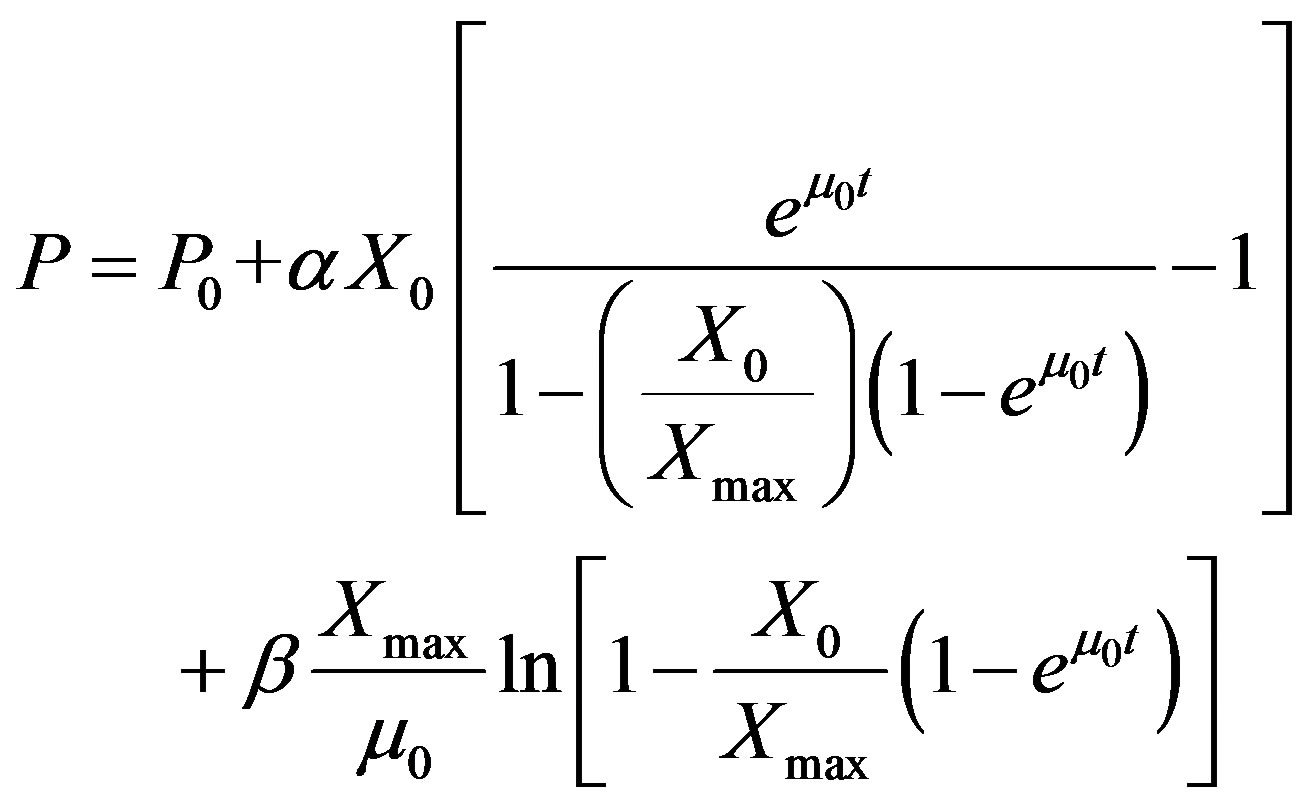 (5)
(5)
where, P is the cutinase activity (U·mL−1), P0 is the initial cutinase activity (U·mL−1), X is cell biomass (g·L−1), X0 is initial biomass (g·L−1), Xmax is the maximum biomass in (g·L−1) and μ0 is specific growth rate (h−1), and α is growth associated term (UgX−1) and β is non-growth associated term (UgX−1h−1).
3. Results and Discussion
3.1. Production of Cutinase
Initially, basal medium containing tomato cutin was used for the production of cutinase from P. cepacia NRRL B 2320. The cutinase activity was first checked with p-NPB and it was further confirmed with specific substrate, p-NMSH. The enzyme activity towards p-NPB was found to be 190 U·mL−1 in the unoptimized medium. To further enhance the cutinase activity, screening and optimization of medium components were carried out.
3.2. Screening of Significantly Influencing Medium Components
The experiments were conducted in 12 runs (in duplicate) to evaluate the effect of most significantly influencing medium components on the production of cutinase. The design matrix selected for the screening of significant variables for cutinase production and the corresponding responses are shown in the Table 1. Production of cutinase from P. cepacia varied from 30 to 293.5 U·mL−1 inferring that the strong influence of medium components on the production. This variation reflects the significance of medium optimization to achieve higher production. To assess the significance of each individual factor on the cutinase activity, a student’s t-test was performed and the results are given in Table 2. Generally, a large t value and lesser p value indicate a high significance of the corresponding model term. Factors evidencing p-values of less than 0.04 [8] were considered to have significant effects on the response, and were therefore selected for further optimization studies. The lower probability values indicate the more significant factors on the production of cutinase. A positive sign indicates that at higher level of variables setting results in a higher response than the lower level variable setting. Alternatively, a negative sign indicates that the lower level of variable setting results in a higher response than the high level variable setting [8]. The significant medium components screened by Plackett-Burman design are cutin, peptone, MgSO4·7H2O (with positive effect) and KCl (with negative effect). The nitrogen source in the medium also regulates the growth and fermentation process for cutinase production. Previously,
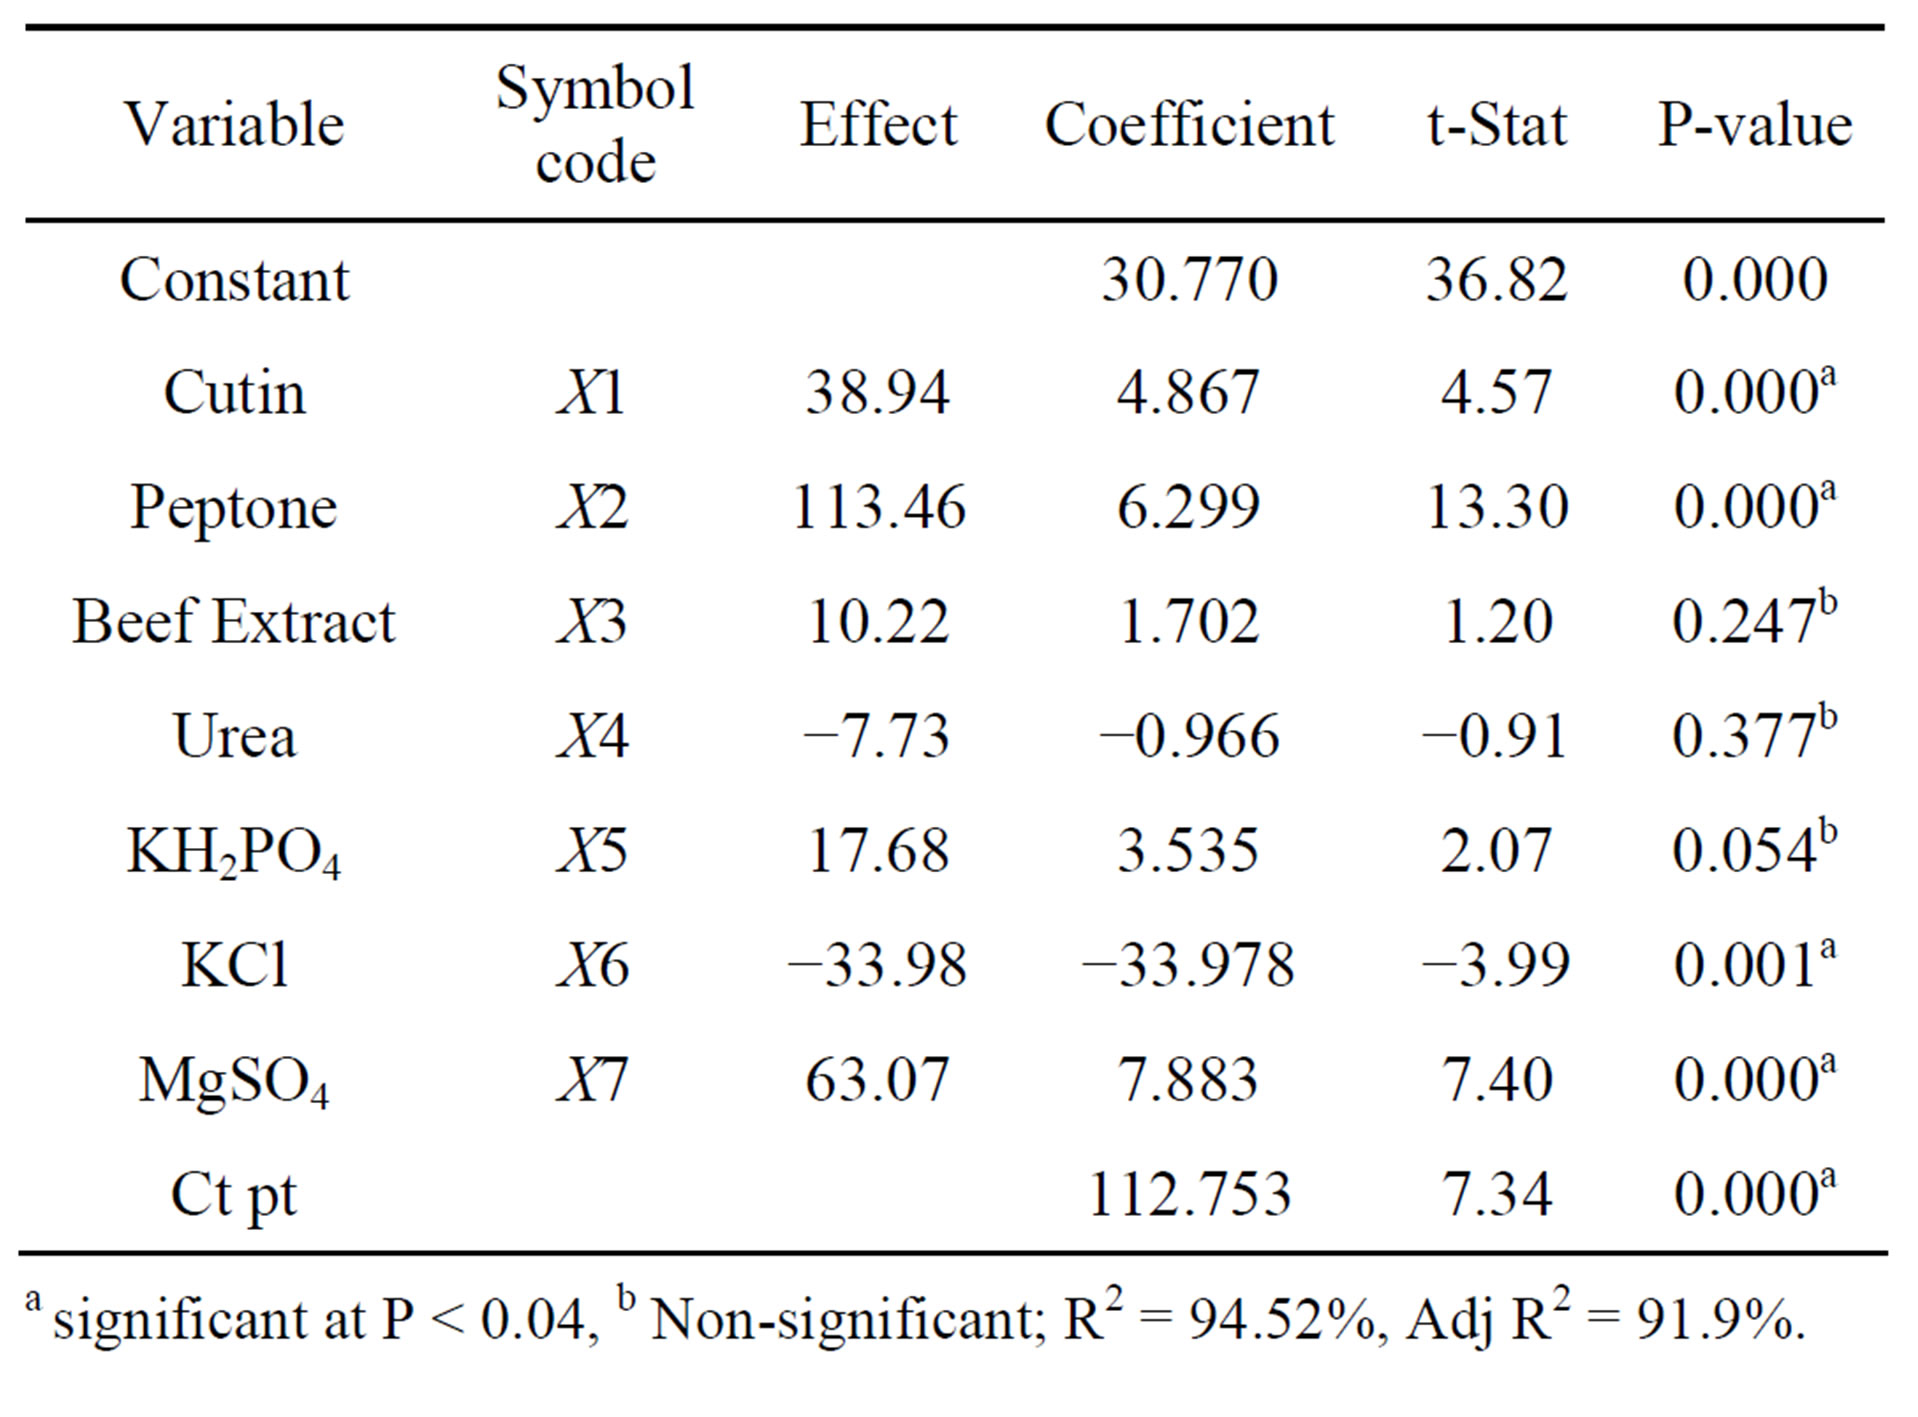
Table 2. Statistical analysis of Plackett-Burman design showing effect, coefficient values, t and P-value for each variable.
a significant at P < 0.04, b Non-significant; R2 = 94.52%, Adj R2 = 91.9%.
cutinase production was reported from P. putida cocultured with nitrogen fixing bacteria clostridium [19]. Although, except peptone other nitrogen sources have not shown much significant influence on the production of cutinase, KCl and MgSO4·7H2O were shown impact on the cutinase production. Increment of KCl concentration resulted in fall in cutinase production, whereas increment in MgSO4·7H2O lead to higher cutinase activity. Pio and Macedo and Rispoli and shah [20,21], reported that MgSO4·7H2O had minimal effect on cutinase production from C. lindemuthianum and F. oxysporium, respectively, which is contradictory to our result. The reason behind may be that, the cutinases from bacterial and fungal source differed widely in respect of their pH and temperature stability and salt tolerance [1,19]. Though KCl and urea have shown negative effect on the production of cutinase in the selected range, but they are necessary for maximum cutinase production. The necessity of presence was checked by removing these components from the medium, which results in reduced enzyme production.
Neglecting the terms which were insignificant, the model equation for cutinase production is as follows:
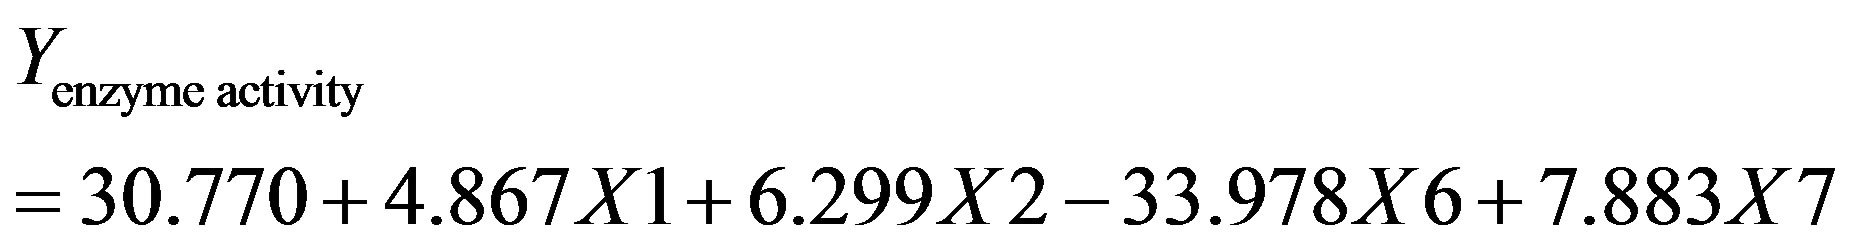 (6)
(6)
where, X1, X2, X6 and X7 are the cutin, peptone, KCl and MgSO4·7H2O, respectively.
Pareto chart (Figure 1) shows the ranking of variables according to the absolute values of standardized effect, important in the design of the experiment for optimization and it is a convenient way to view the results of a Plackett-Burman experimental design. The reference line (2.11) indicates that effects were significant with α value of 0.05. The variables effects, which extend past the line, were known to be significant at particular α. The standardized effects were the t statistics shown in Figure 1. The t statistics were calculated by dividing each coefficient by its standard error. The variables cutin, peptone, KCl and MgSO4·7H2O were influencing the production of cutinase very significantly (Figure 1). The effect of other insignificant variables were not included in the next optimization experiment, but instead were used in all experiments at their middle level (centre point). Plackett-Burman design of experiment is very useful statistical tool for screening of significant media components. Previously experiments were carried out to observe the effect of different carbon sources on the cutinase production (data not shown), but no other carbon source except cutin was able to induce the cutinase. Among the seven medium components, peptone, cutin, KCl and MgSO4·7H2O were found to be significant with high (>99%) confidence level. The major factor for expression
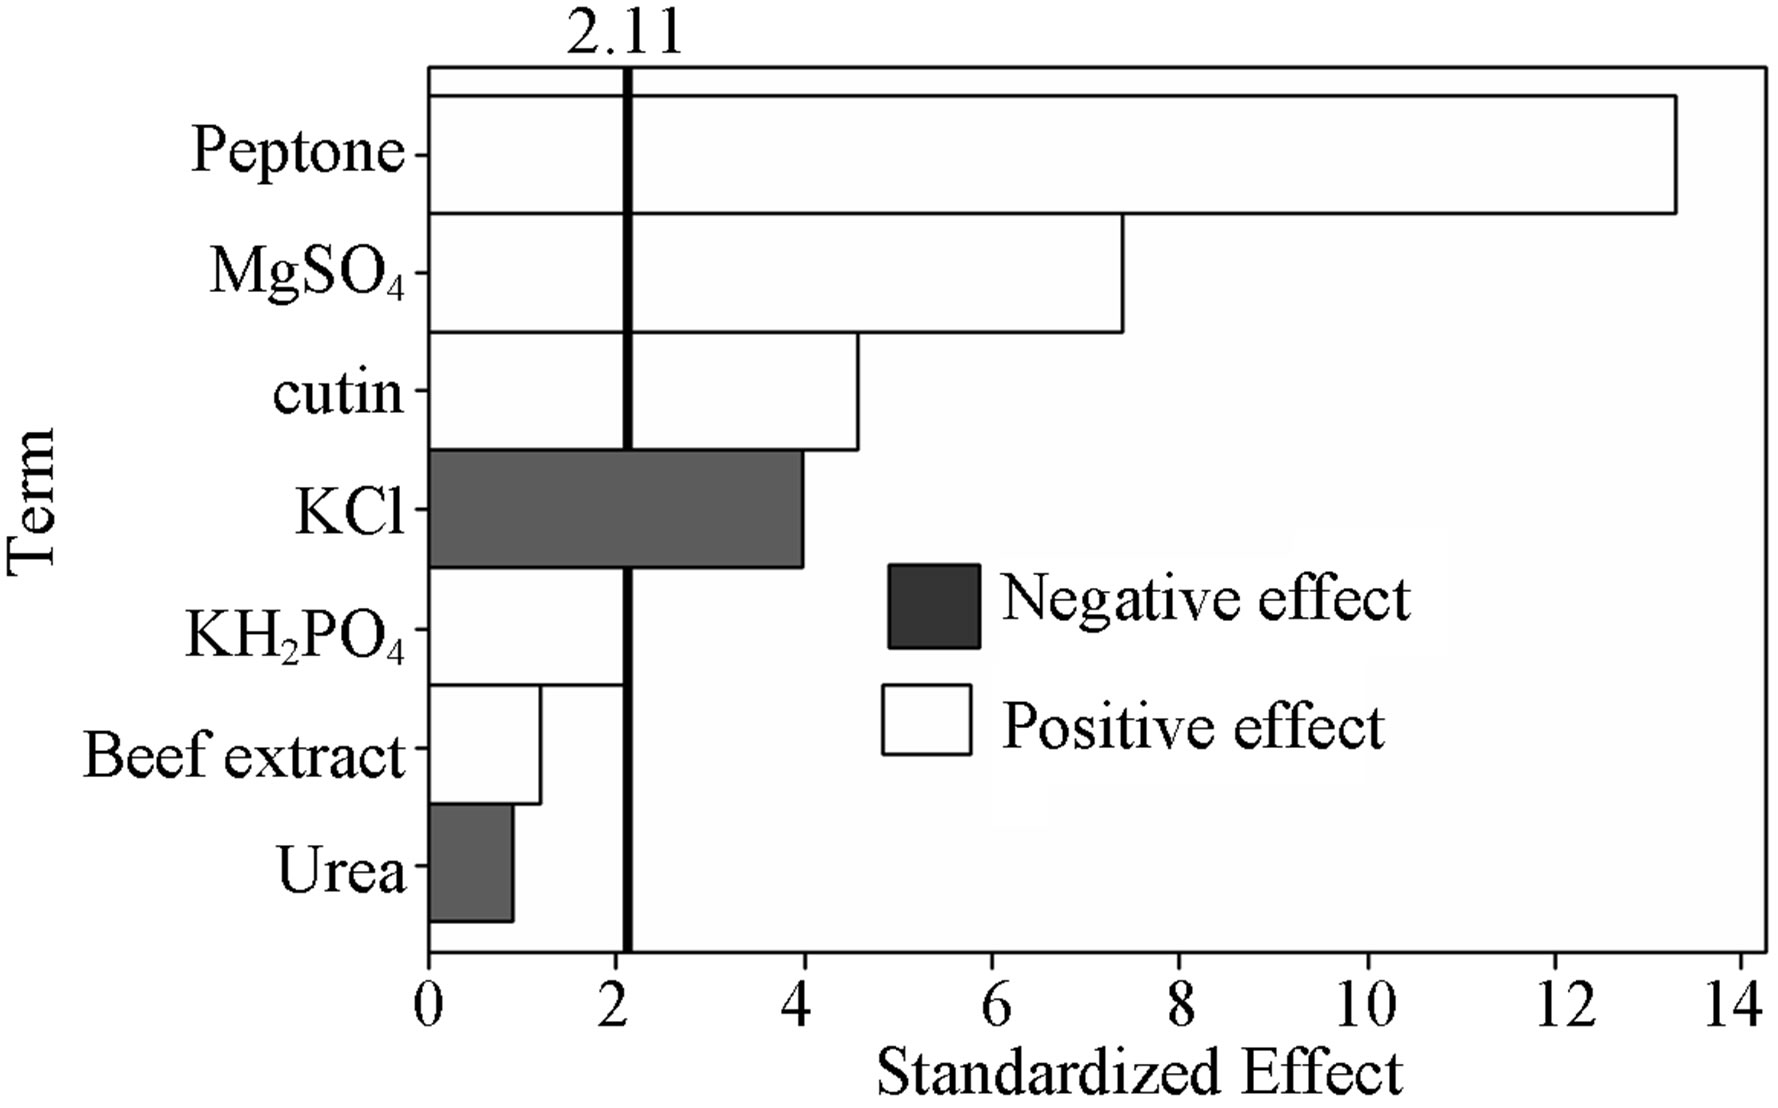
Figure 1. Pareto chart of standardized effects of the factors on cutinase production.
of cutinase is the carbon source since cutinases are inducible enzymes and thus produced in the presence of cutin as an essential carbon source.
3.3. Optimization of Screened Medium Constituents for Cutinase Production
The screened medium constituents (cutin, peptone, KCl, MgSO4·7H2O) were optimized using central composite experimental design (CCD). The design matrix and the corresponding results of CCD experiments to determine the effects of four independent variables (cutin, peptone, KCl, MgSO4·7H2O) are shown in Table 3, along with the mean predicted values. Using the experimental results of CCD, regression model equation was developed for predicting the maximum cutinase activity given by Equation (7).
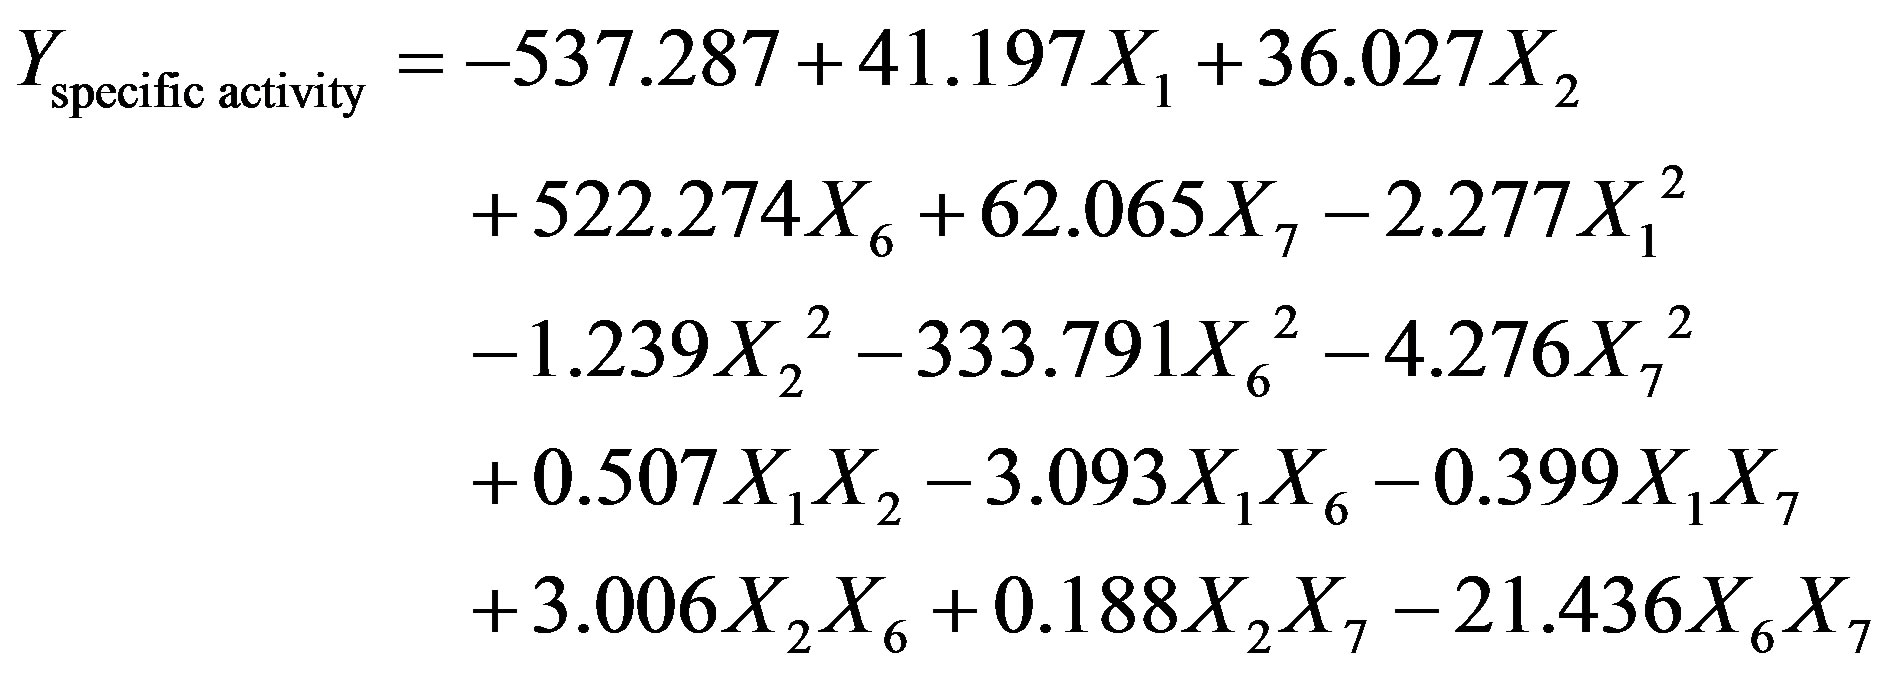 (7)
(7)
where, X1, X2, X6 and X7 are the cutin, peptone, KCl and MgSO4·7H2O, respectively.
The results were analyzed in the form of analysis of variance (ANOVA), which is a statistical technique that subdivides the total variation in a set of data into component parts associated with specific sources of variation for the purpose of testing hypotheses on the parameters of the model. Table 4 represents the ANOVA for cutinase activity. The mean sum of squares (MS) of the model term is obtained from the ratio of sum of squares (SS) and degrees of freedom (df). The Fisher’s F value is calculated by dividing the MS owing to the model by the MS owing to error. Table 4 also shows a term for error, the MS value, which indicates that the amount of variation in the response data is low. The high Fisher’s F
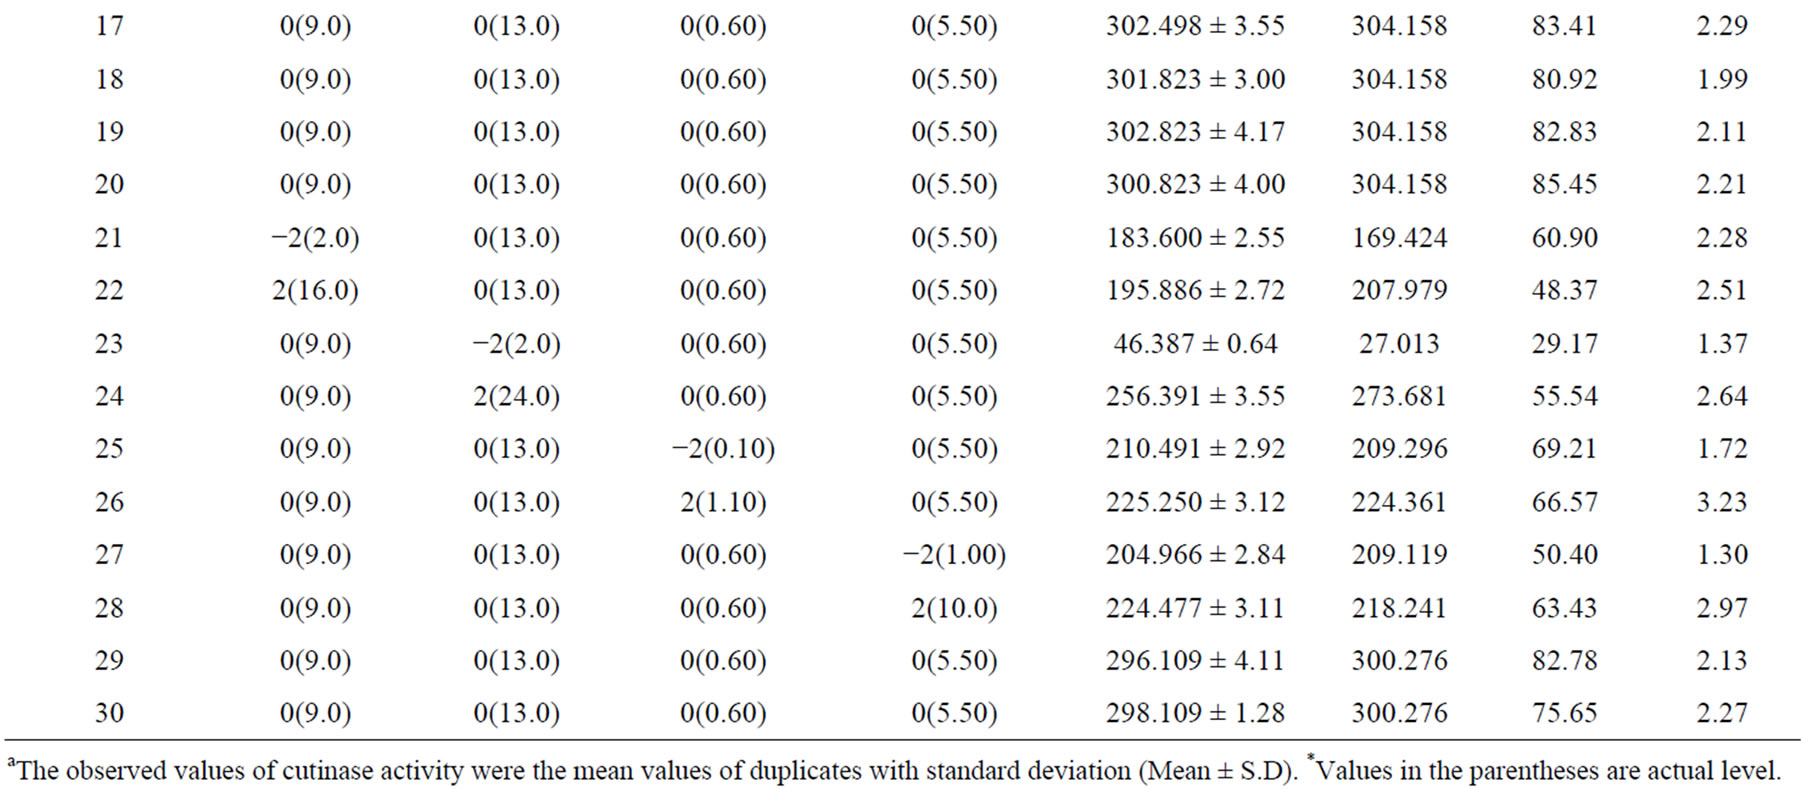
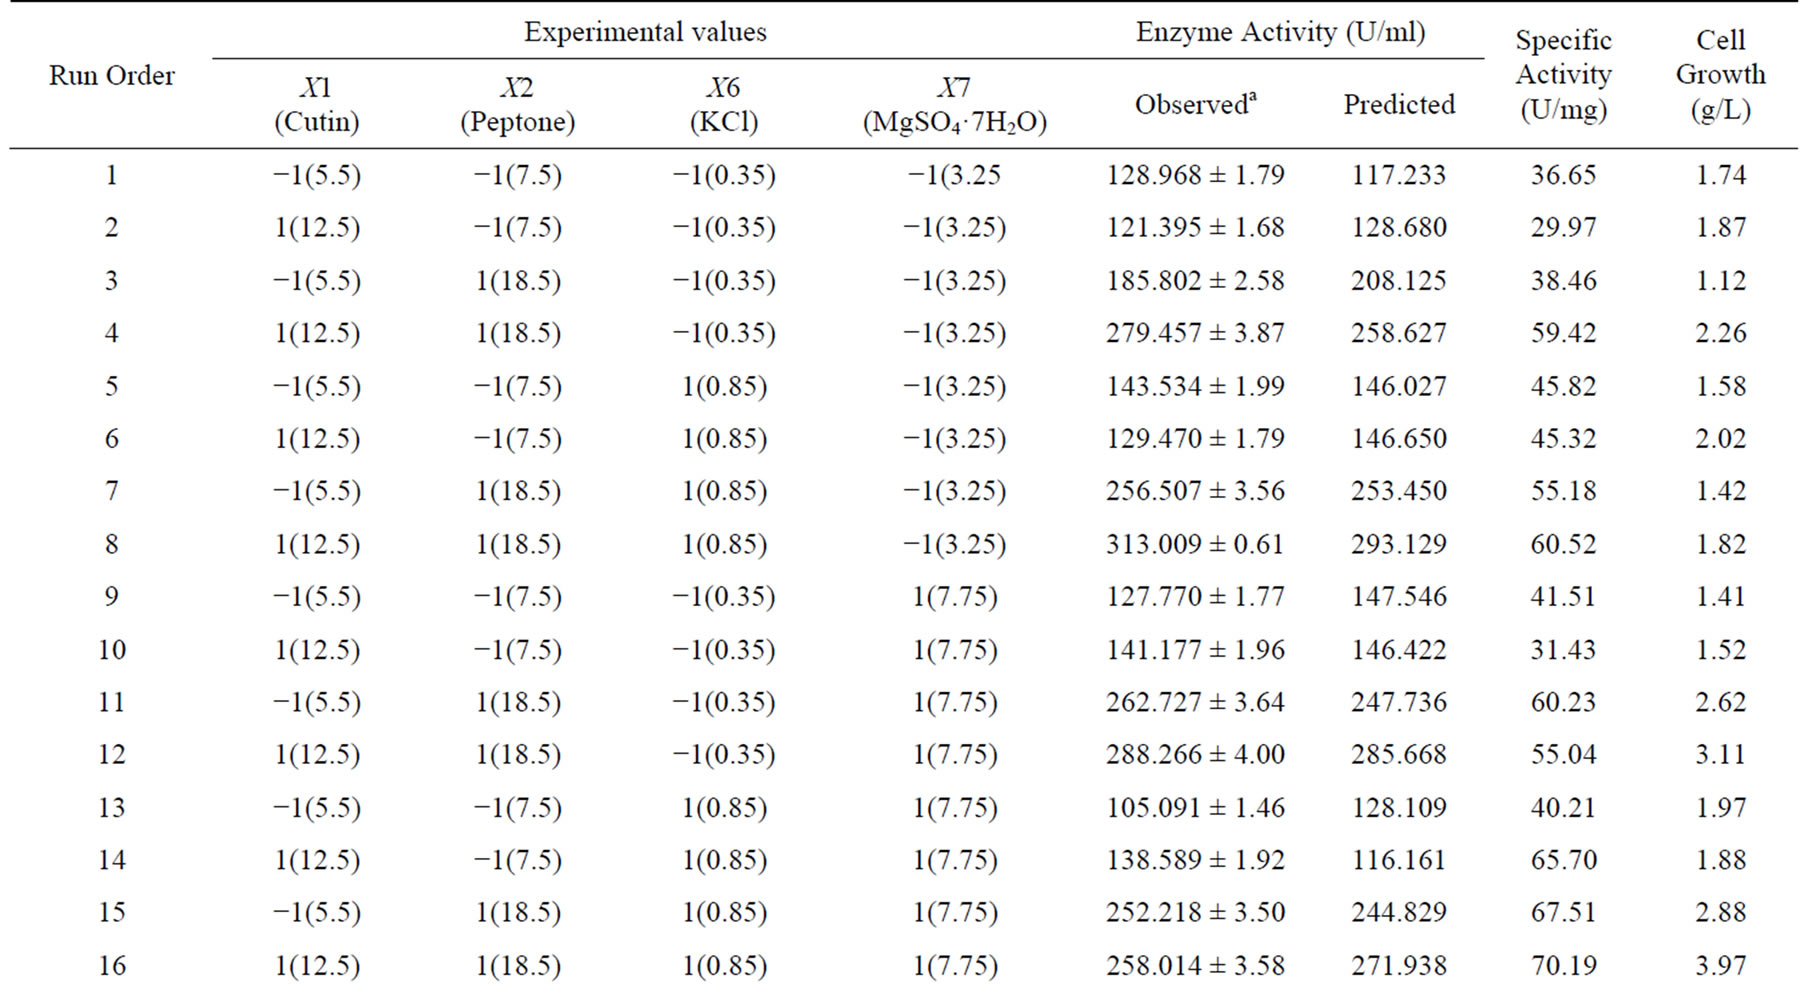
Table 3. A 24 full-factorial central composite design matrix of four variables in coded and actual values with experimental and predicted values of cutinase production.
aThe observed values of cutinase activity were the mean values of duplicates with standard deviation (Mean ± S.D). *Values in the parentheses are actual level.
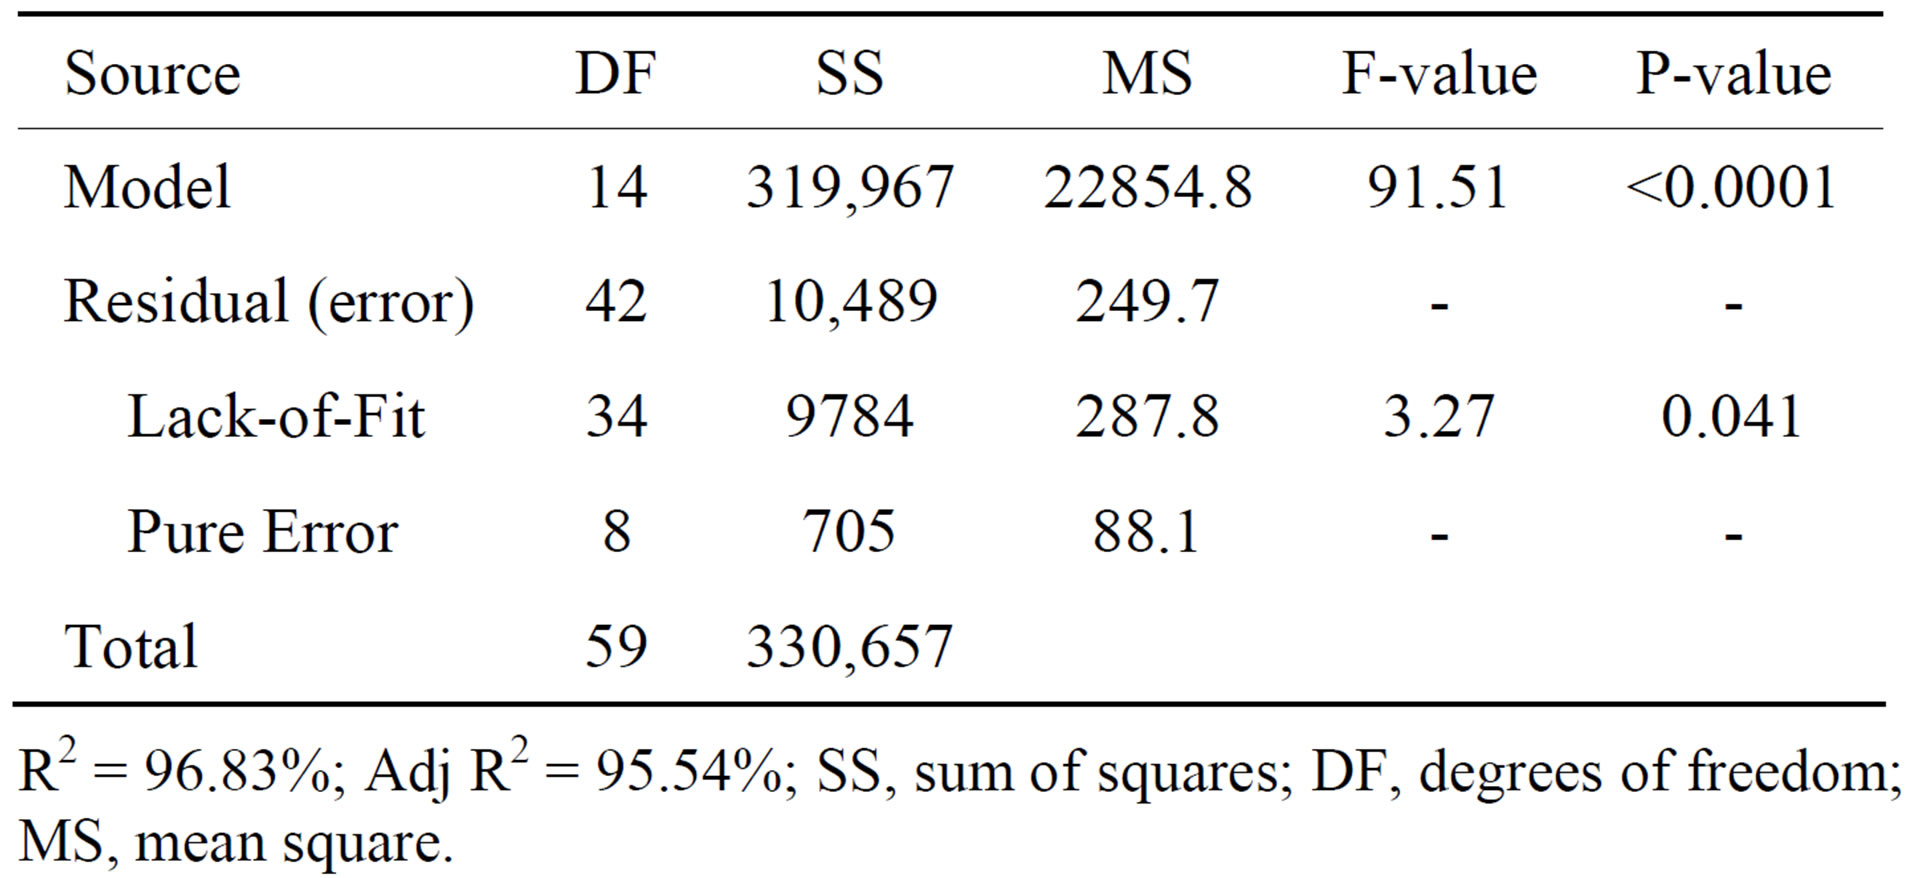
Table 4. Analysis of variance (ANOVA) for quadratic model.
R2 = 96.83%; Adj R2 = 95.54%; SS, sum of squares; DF, degrees of freedom; MS, mean square.
value (91.51) indicates that the most of the variation in the response can be explained by the model equation. The associated p value is used to judge, whether F is large enough to indicate statistical significance or not. A p value < 0.04 is considered to be statistically significant with high confidence level (>96%). Overall, the regression model for the cutinase activity was highly significant (p < 0.0001), which indicates that the second-order polynomial model was adequate in representing the actual relationship between the response (cutinase activity) and the variables. This inference was also confirmed by high coefficient of regression (R2 = 96.83%).
To determine the significance of the regression coefficient of the factors, the results were subjected to a student’s t-test. The coefficients, t-value and p-value of different variable, their square terms and interaction terms are given in Table 5. The linear and quadratic terms of all the four components are found to be highly significant from their low p-values (<0.0001). Among the interaction effects, the coefficient term between cutin-peptone and those between KCl-MgSO4·7H2O has also shown high significance (p < 0.001) for the production of cutinase. Such an observation in significance of interaction effects between the variables would have been lost, if the experiments were carried out by conventional methods. In order to determine the optimal levels of each variable for maximum cutinase production, three-dimensional response surface plots were constructed by plotting the response (cutinase activity) on the Z-axis against any two independent variables, while maintaining other variables at their optimal levels. As shown in Figure 2(a), a curvature in the response surface indicates lower and higher values of both cutin and peptone did not result in higher response. The increment of cutin concentration from 2 to 10 g·L−1 and peptone concentration from 2 to 18 g·L−1 increased the cutinase activity but further increment in the concentration of both the components decreased the cutinase activity. A similar profile was observed in Figure 2(b) (with cutin and KCl concentration) and Figure 2(c) (with cutin and MgSO4·7H2O concentration), where cutinase activity increased with increasing KCl concentration up to 0.63 g·L−1 and MgSO4·7H2O concentration unto 5 to 6 g·L−1. The cutinase production was also significantly influenced by peptone concentration in the medium and reached maximum at 17.77 g·L−1. From the Figures 2(d) and (e) a steep increase in cutinase activity was observed with increasing concentration of peptone from 2 to 17.77 g·L−1. Further increase in peptone concentration was unable to enhance the activity any more. Peptone and cutin being the main carbon and nitrogen source of the media help to maintain the optimum C/N ratio which could facilitate the growth of microorganism and the production of enzyme. Again the interaction of KCl and MgSO4·7H2O (Figure 2(f)) was very prominent with
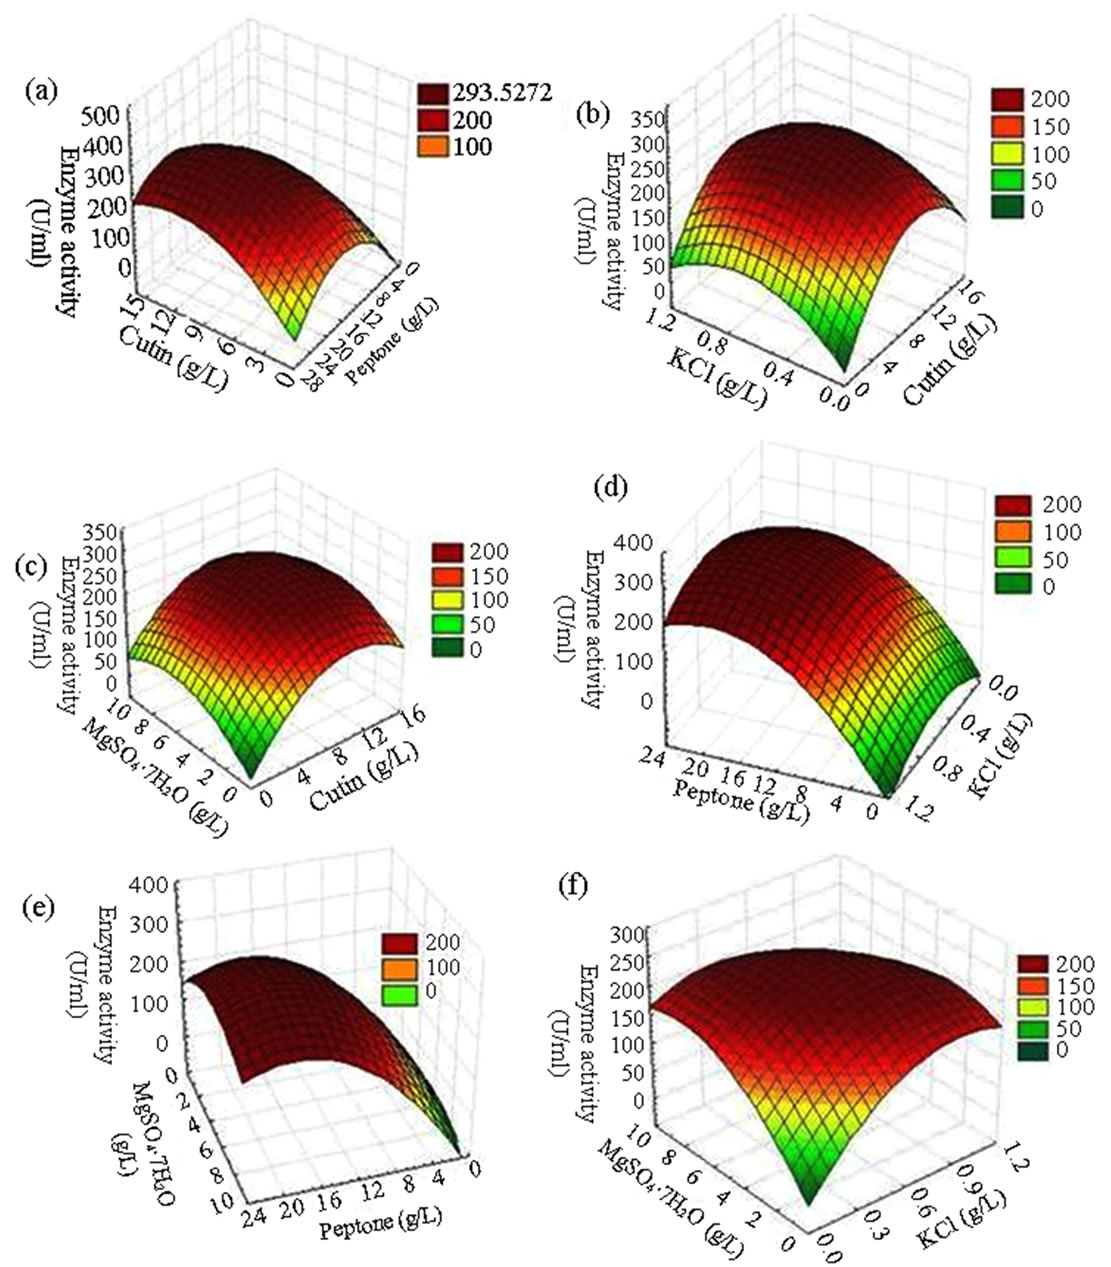
Figure 2. Three-dimensional response surface plot for cutinase production showing the interactive effects of (a) cutin and peptone (b) cutin and KCl (c) cutin and MgSO4·7H2O (d) peptone and KCl (e) peptone and MgSO4·7H2O (f) KCl and MgSO4·7H2O.
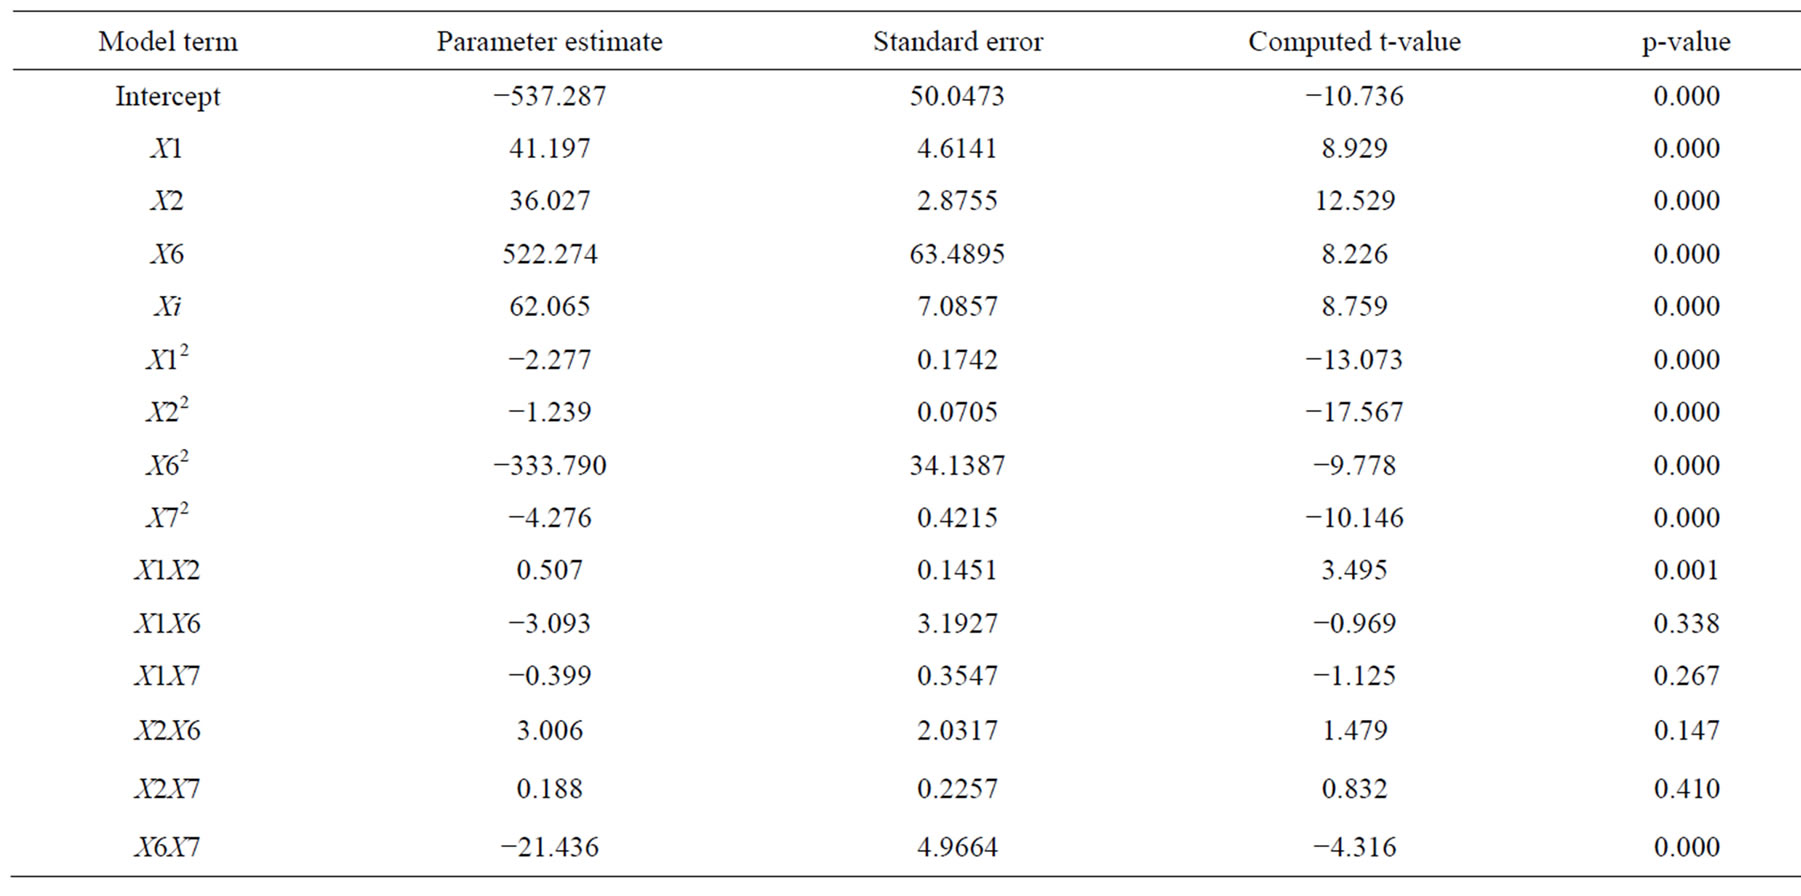
Table 5. Model coefficient estimated by multiple linear regressions.
p < 0.001. Similar effect was also observed for KCl and MgSO4·7H2O. The experimental data were fitted into the aforementioned Equation (7), and the optimum levels of each variable were determined to be as follows: cutin: 10.06 g·L−1, peptone: 17.77 g·L−1, KCl: 0.635 g·L−1 and MgSO4·7H2O: 5.546 g·L−1. However, very few studies deal with statistical optimization of the process for cutinase production. To our best knowledge there is no report available in the literature on the optimization of medium components for the production of cutinase using tomato cutin as a source of carbon from P. cepacia NRRL B 2320. An overall 2 fold increase in cutinase production was achieved in the optimized medium as compared with the un-optimized basal medium, which reflects the necessity and value of optimization process. From this design of experiment we could have the significant interaction between a pair of components. In this case, for the cutinase production the peptone-cutin interaction and KCl-MgSO4·7H2O were most significant interactions.
3.4. Validation of Model
To verify validity of the model, experiments were carried out at optimal levels of significantly influenced medium components with other medium components at middle level and compared with the calculated data from the model. The estimated enzyme activity of cutinase was found to be 336.76 U·mL−1, where the predicted value from the polynomial model was 330.96 U·mL−1. The verification revealed a high degree of accuracy of the model of more than 98.73%, which is an evidence for the model validation under the investigated conditions. This value was also found to be 4.39% higher than the maximum measured cutinase activity observed in the CCD of experiments shown in Table 3. The estimated enzyme activity towards p-NMSH (cutinase specific substrate) was found to be 3.12 U·mL−1. There is also two fold increase in cutinase activity with p-NMSH after optimization.
3.5. Unstructured Model Prediction
The profiles for cutinase production and cell growth in optimized medium in shake flask were illustrated in the Figure 3. The profile of growth and enzyme production in bioreactor with uncontrolled and controlled pH were shown in Figures 4 and 5, respectively. From all the profiles, it was observed that the cutinase production increased with increasing growth up to 96 h of culture and maintained after this. Biokinetic parameters involved in the process were estimated using the models mentioned in Equations (3), (4) and (5). These models are essentially unstructured logistic models, which describes the kinetics of cell growth and product accumulation [17,18]. In this study, for fitting of experimental data with the models, nonlinear regression using the least-square method was used employing Microsoft Excel Solver 2003.
The estimated kinetic parameters values obtained from these models are mentioned in Table 6, which also shows that the determination coefficient (R2) values obtained by fitting the various models to the experimental data were found to be very high (≥0.93), thus revealing good precision of the models. Using the logistic model, μ, X0 and Xmax were obtained for growth kinetic, and Pr, P0
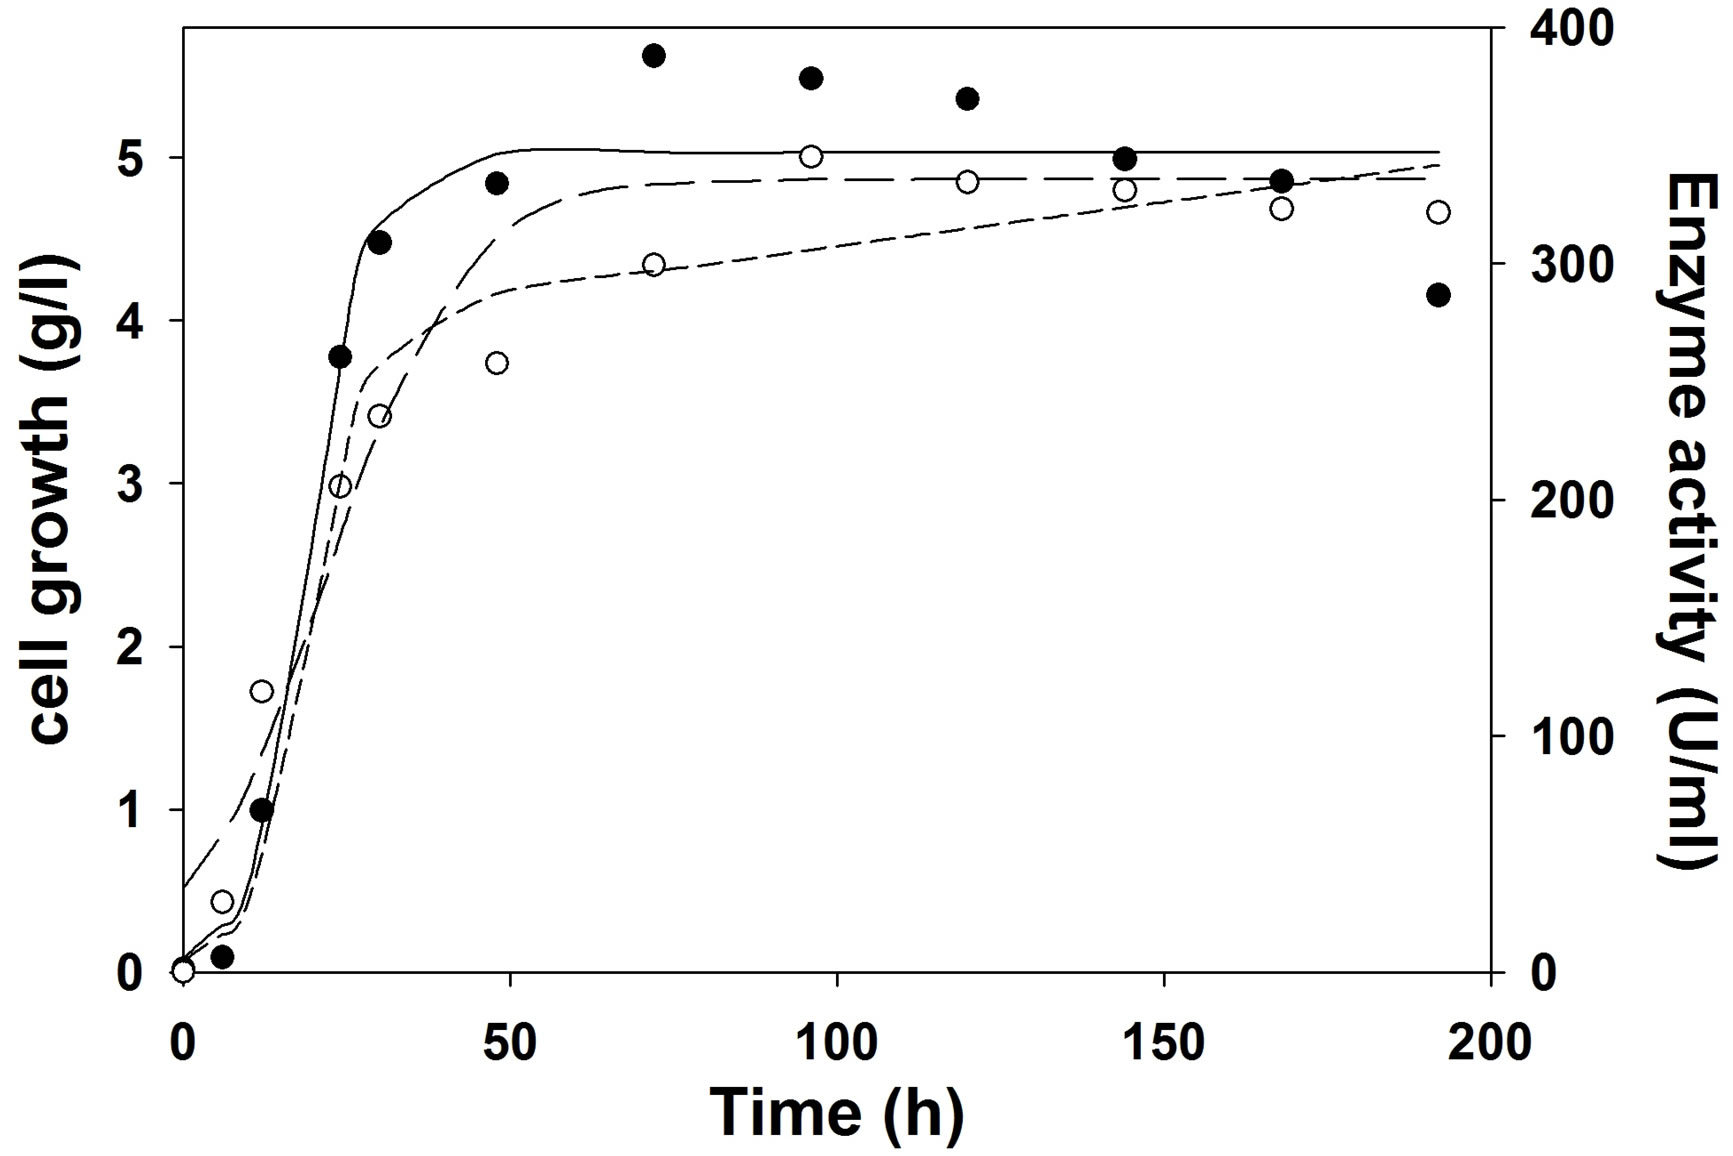
Figure 3. Experimental and model predicted growth kinetics and production kinetics during cutinase production. Experimental growth (○), model predicted growth (—··—), experimental cutinase production (●), logistic model predicted cutinase production (——), Luedeking-Piret model predicted cutinase production (―――).
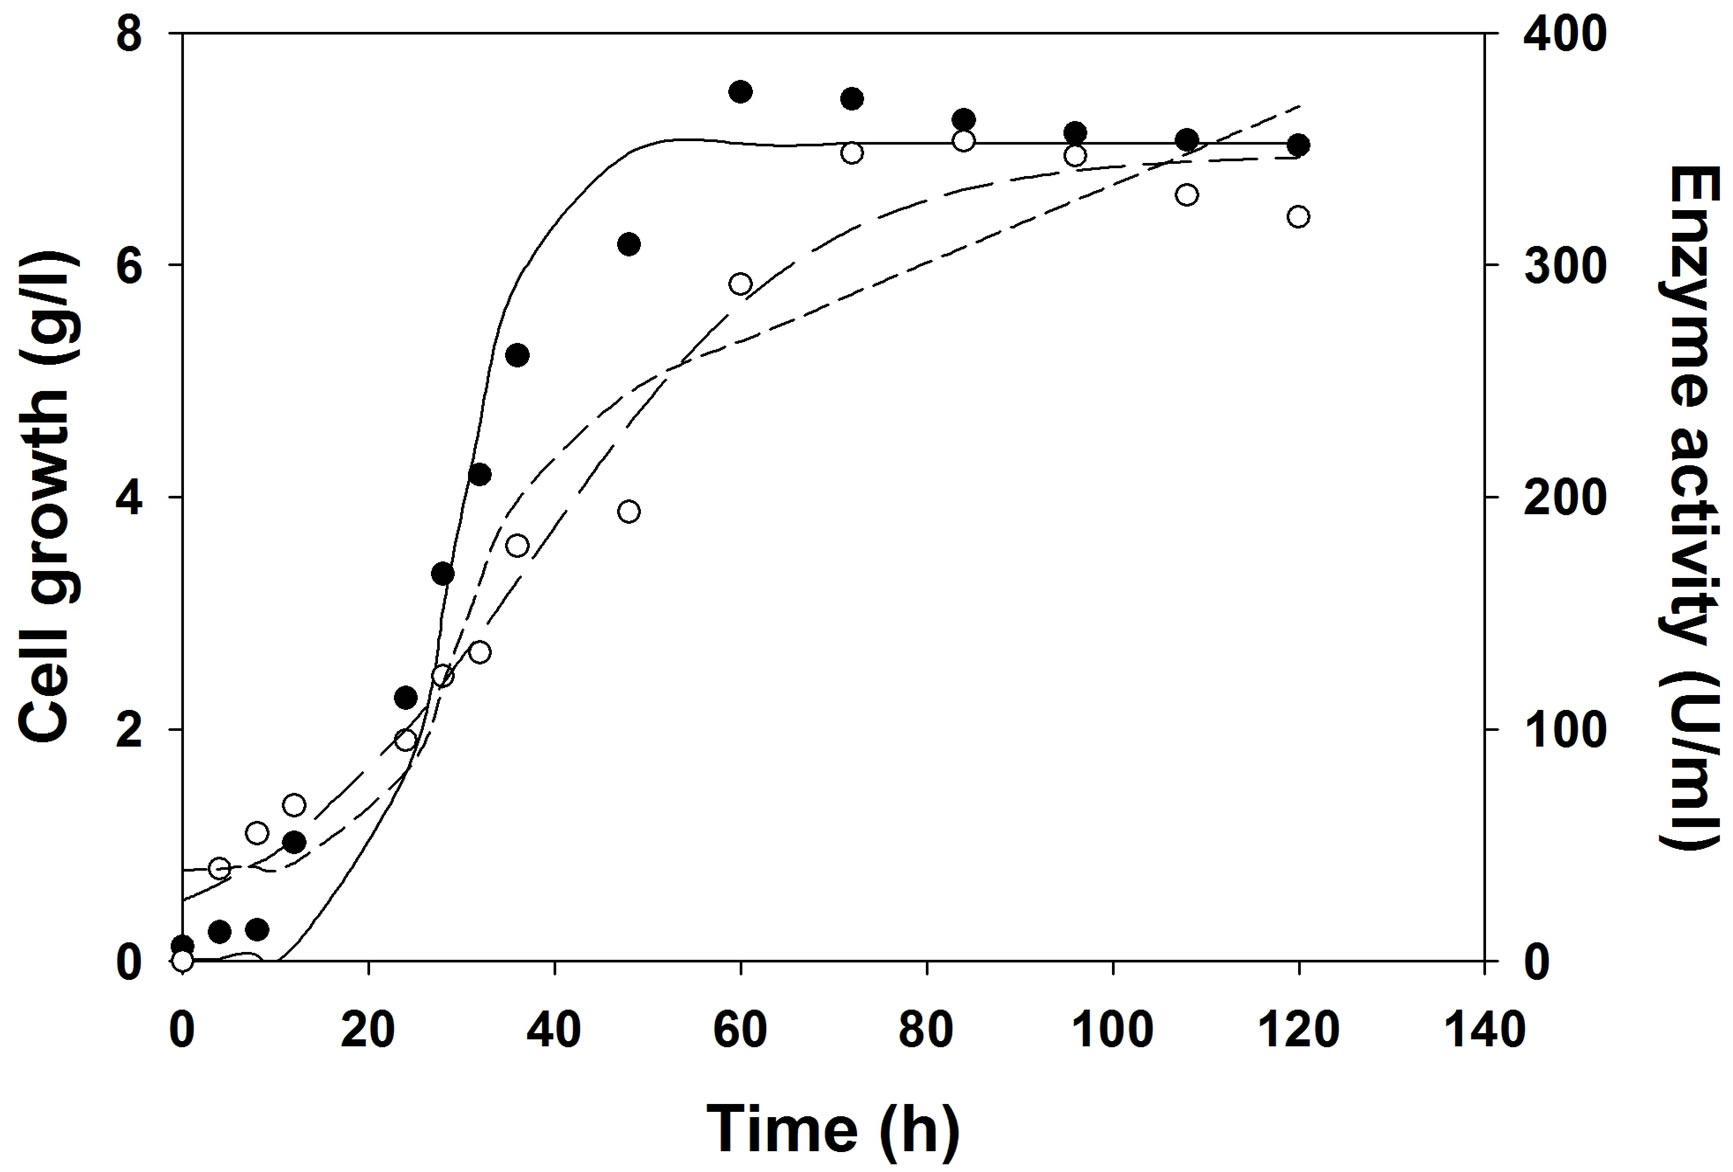
Figure 4. Experimental and model predicted growth and production kinetics during cutinase production in bioreactor in optimized medium at uncontrolled pH, 2 vvm aeration and 200 RPM. Experimental growth (○), model predicted growth (—··—), experimental cutinase production (●), logistic model predicted cutinase production (——), Luedeking–Piret model predicted cutinase production (―――).
and Pmax were obtained from enzyme production kinetic profile. Using Leudeking -piret model α and β value values were predicted. These α and β values are growth and non-growth associated parameters during enzyme production. A higher α value (55.05) than β value (0.016) predicted that cutinase production is more growth associated than non-growth associated in shake flask. But, it is also observed from Table 6 that in bioreactor (with or without pH control) α value decreased and β value increased, suggesting that cutinase production was mixed growth type in the bioreactors. This may be due to better controlled condition in the bioreactor than shake flask.
To the best of our knowledge this is the first report on the kinetic modeling fermentation profile during cutinase production. Few reports are available on lipase [22] and xylanase [23] production kinetics where production was
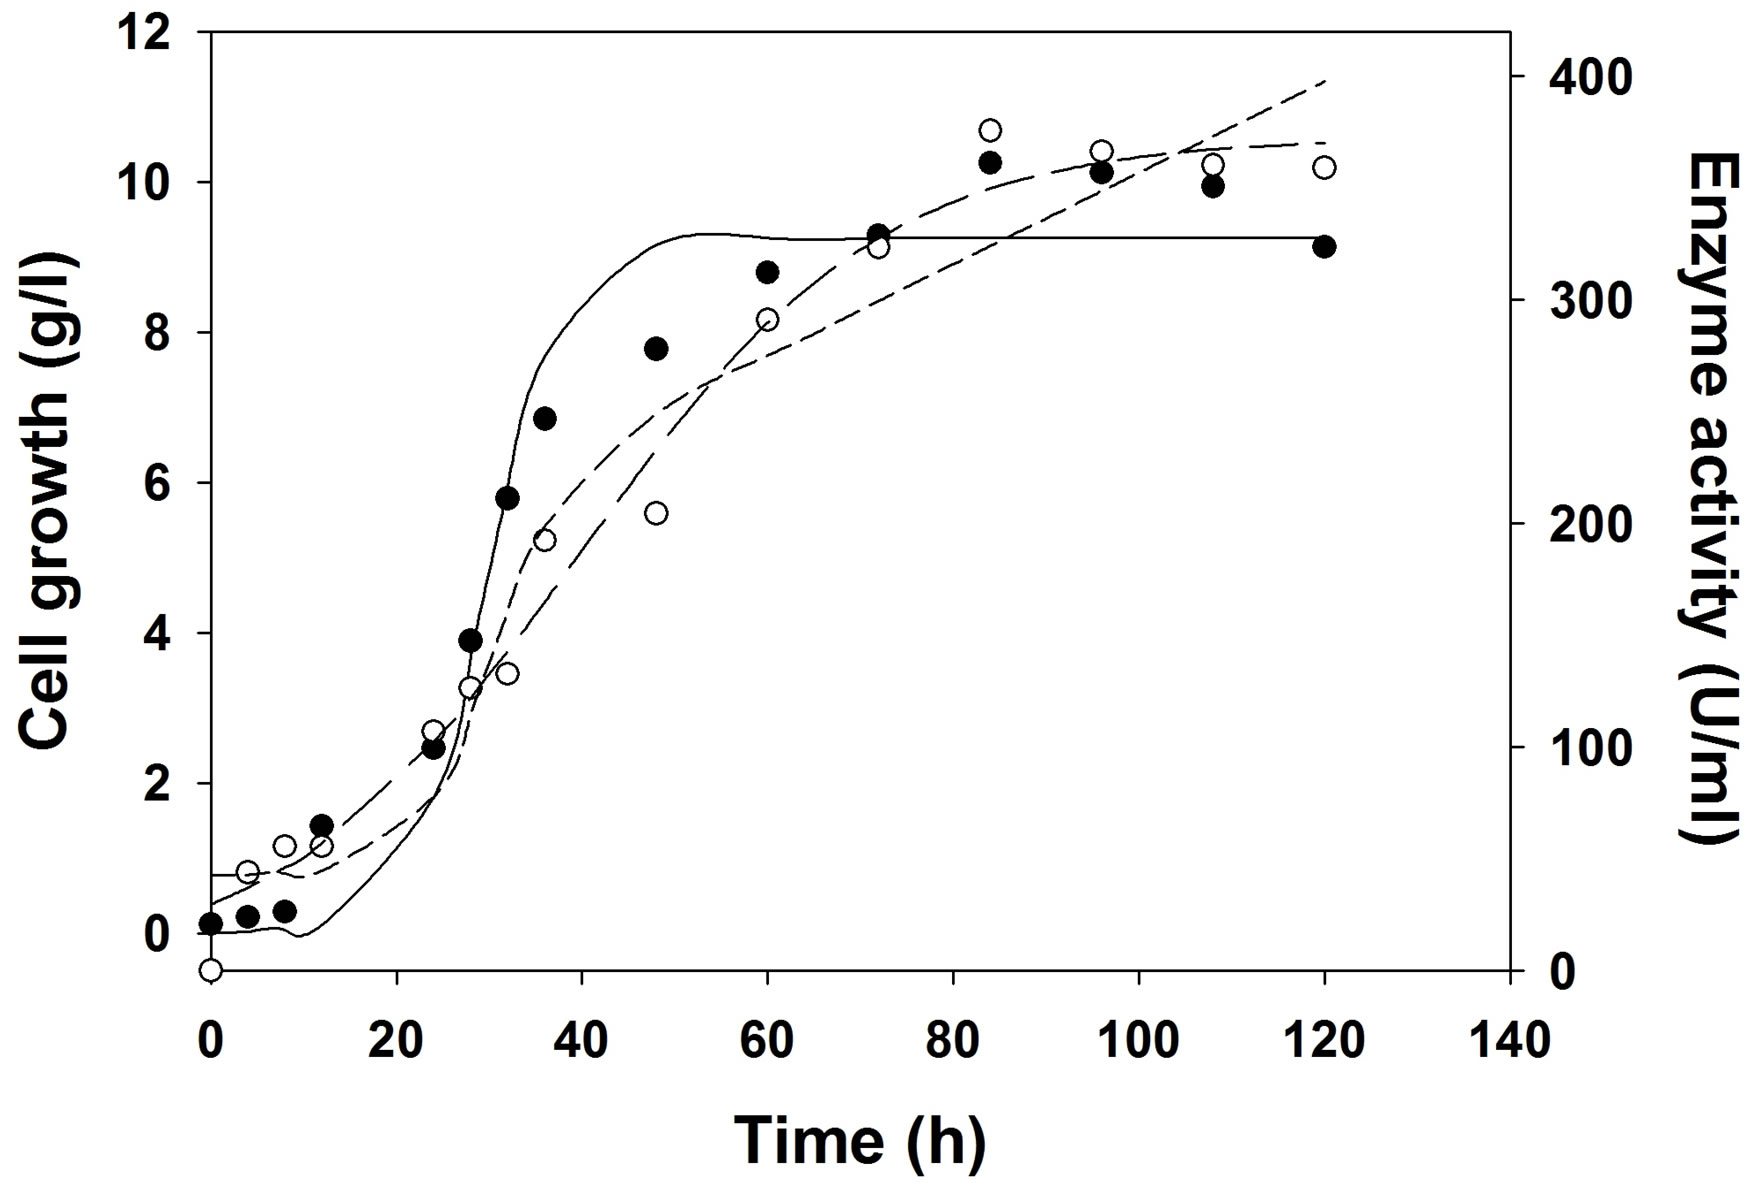
Figure 5. Experimental and model predicted growth and production kinetics during cutinase production in bioreactor in optimized medium at controlled pH 7, 2 vvm aeration and 200 RPM. Experimental growth (○), model predicted growth (—··—), experimental cutinase production (●), logistic model predicted cutinase production (——), Luedeking-Piret model predicted cutinase production (―――).
found mostly growth associated. The coefficient of determination, R2, is a measure of the strength of the linear relationship between the experimental and predicted values.
The logistic model predicted the growth kinetics with an R2 value of 0.97 in shake flask and bioreactors. For shake flask study, cutinase production kinetics was predicted by logistic and LP model with same R2 value of 0.95. But in case of cutinase production under uncontrolled pH the kinetics for production was predicted with R2 of 0.97 by logistic model, whereas the same was predicted with R2 of 0.93 by LP model. For the production of cutinase under controlled pH at 7, it was also observed that logistic model predicted the production kinetics with R2 of 0.98, and LP model showed R2 of 0.96. From the Table 6, it was observed that the maximum cutinase production increased from shake flask to bioreactor and in bioreactor the cutinase production increased when pH was controlled at 7, than the uncontrolled pH.
4. Conclusion
In conclusion, cutinase production was maximally supported by cutin, peptone, KCl and MgSO4·7H2O. An optimum combination of cutin, peptone, KCl and MgSO4·7H2O at the respective levels of 10.06 g·L−1, 17.77 g·L−1, 0.635 g·L−1 and 5.546 g·L−1 in the medium was obtained by employing an RSM optimization technique, which resulted in 2 fold enhancement of cutinase activity by P. cepacia NRRL B 2320. The unstructured kinetic models, such as the logistic model for growth and the enzyme production, and Luedeking-Pirate model for enzyme production have been proven to be accurately evaluating the fermentation kinetic parameters with good accuracy.
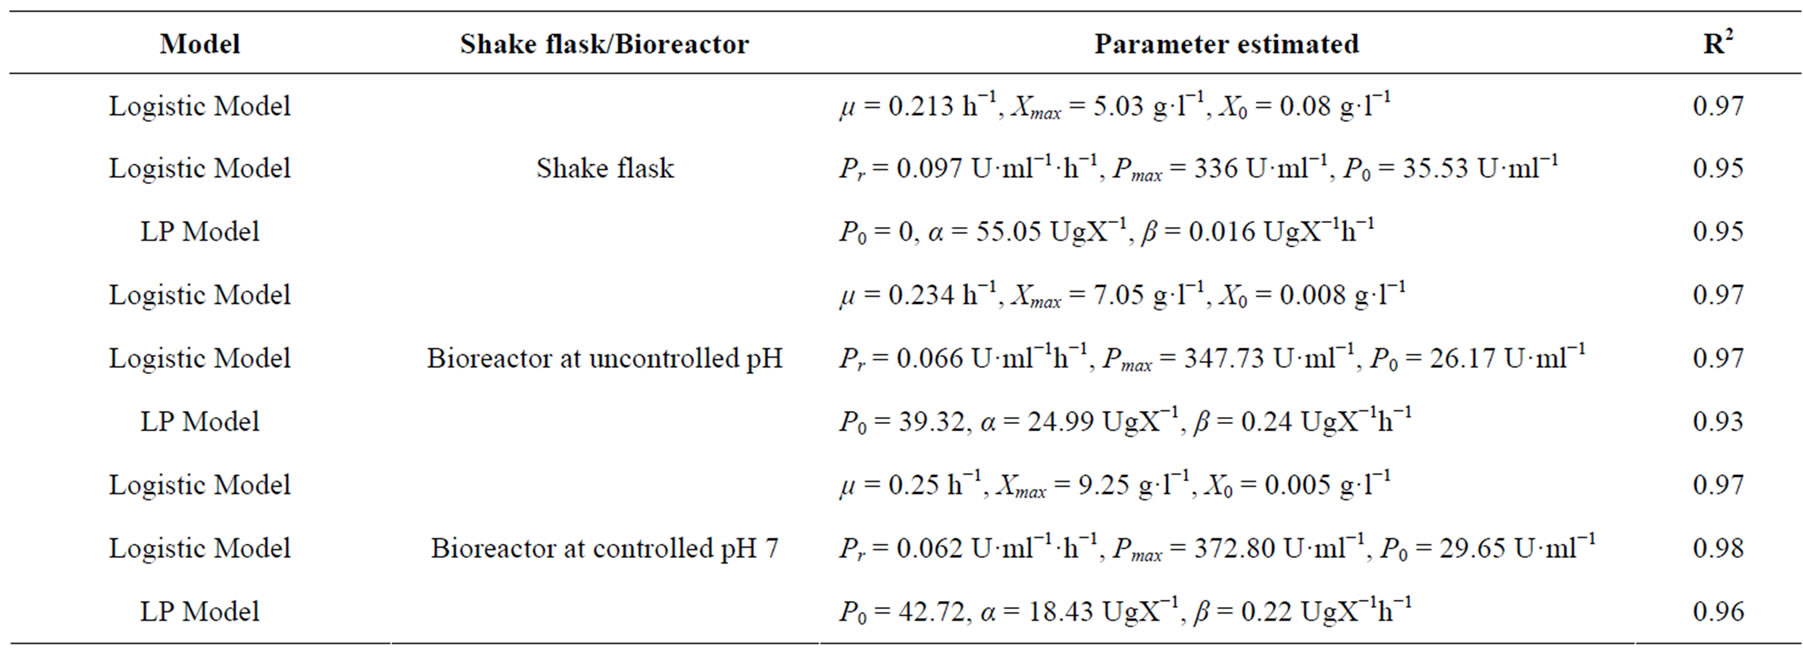
Table 6. Parameters estimated by logistic and Leudeking-Pirate model equation.
5. Acknowledgements
Financial support from Department of Science and Technology (DST), Govt. of India is thankfully acknowledged.
REFERENCES
- K. Dutta, S. Sen and V. D. Veeranki, “Production, Characterization and Applications of Microbial Cutinases,” Process Biochemistry, Vol. 44, No. 2, 2009, pp. 127-134. http://dx.doi.org/10.1016/j.procbio.2008.09.008
- C. M. L. Carvalho, M. R. Aires-Barros and J. M. S. Cabral, “Cutinase: From Molecular Level to Bioprocess Development,” Biotechnology and Bioengineering, Vol. 66, No. 1, 1999, pp. 17-34. http://dx.doi.org/10.1002/(SICI)1097-0290(1999)66:1<17::AID-BIT2>3.0.CO;2-F
- R. E. Purdy and P. E. Kolattukudy, “Hydrolysis of Plant Cuticle by Plant Pathogens. Purification, Amino-Acid Composition, and Molecular Weight of 2 Isoenzymes of Cutinase and a Nonspecific Esterase from Fusarium solani f. pisi,” Biochemistry, Vol. 14, No. 13, 1975, pp. 2824-2831. http://dx.doi.org/10.1021/bi00684a006
- C. G. Dekoster, W. Heerma, H. A. M. Pepermans, A. Groenewegen, H. Peters and J. Haverkamp, “Tandem Mass Spectrometry and Nuclear Magnetic Resonance Spectroscopy Studies of Candida bombicola Sophorolipids and Product Formed on Hydrolysis by Cutinase,” Analytical Biochemistry, Vol. 230, No. 1, 1995, pp. 135- 148. http://dx.doi.org/10.1006/abio.1995.1448
- C. M. L. Carvalho, J. M. S. Cabral and M. R. Aires-Barros, “Kinetics and Modelling of Transesterification Reactions Catalysed by Cutinase in AOT Reversed Micelles,” Journal of Molecular Catalysis B: Enzymatic, Vol. 5, No. 1-4, 1998, pp. 361-365. http://dx.doi.org/10.1016/S1381-1177(98)00098-8
- E. P. Melo, R. P. Baptista and J. M. S. Cabral, “Improving Cutinase Stability in Aqueous Solution and in Reverse Micelles by Media Engineering,” Journal of Molecular Catalysis B: Enzymatic, Vol. 22, No. 5-6, 2003, pp. 299-306. http://dx.doi.org/10.1016/S1381-1177(03)00044-4
- V. V. Dasu and T. Panda, “Optimization of Microbiological Parameters for Enhanced Griseofulvin Production Using Response Surface Methodology,” Bioprocess Engineering, Vol. 22, No. 1, 2000, pp. 45-49. http://dx.doi.org/10.1007/PL00009099
- S. Kumar, K. Pakshirajan and V. V. Dasu, “Development of Medium for Enhanced Production of Glutaminase-Free l-Asparaginase from Pectobacterium carotovorum MTCC 1428,” Applied Microbiology and Biotechnology, Vol. 84, No. 3, 2009, pp. 477-486. http://dx.doi.org/10.1007/s00253-009-1973-0
- D. C. Sharma and T. Satyanarayana, “A Marked Enhancement in the Production of a Highly Alkaline and Thermostable Pectinase by Bacillus pumilus dcsr1 in Submerged Fermentation by Using Statistical Methods,” Bioresource Technology, Vol. 97, No. 5, 2006, pp. 727-733. http://dx.doi.org/10.1016/j.biortech.2005.04.012
- T. J. Walton and P. E. Kolattukudy, “Determination of Structures of Cutin Monomers by a Novel Depolymerization Procedure and Combined Gas Chromatography and Mass Spectrometry,” Biochemistry, Vol. 11, No. 10, 1972, pp. 1885-1897. http://dx.doi.org/10.1021/bi00760a025
- M. M. A. Elsawah, A. A. Sherief and S. M. Bayoumy, “Enzymatic Properties of Lipase and Characteristics Production by Lactobacillus delbrueckii Subsp. Bulgaricus,” Antonie van Leeuwenhoek, Vol. 67, No. 4, 1995, pp. 357- 362. http://dx.doi.org/10.1007/BF00872935
- Degani, Ofir, H. Salman, S. Gepstein, G. Carlos and Dosoretz. “Synthesis and Characterization of a New Cutinase Substrate, 4-Nitrophenyl (16-Methyl Sulfone Ester) Hexadecanoate,” Journal of Biotechnology, Vol. 121, No. 3, 2006, pp. 346-350. http://dx.doi.org/10.1016/j.jbiotec.2005.08.011
- R. Agarwal, B. Mahanty and V. V. Dasu, “Modeling Growth of Cellulomonas cellulans NRRL B 4567 under Substrate Inhibition during Cellulase Production,” Chemical and Biochemical Engineering Quarterly, Vol. 23, No. 2, 2009, pp. 213-218.
- R. L. Plackett and J. P. Burman, “The Design of Optimal Multifactorial Experiments,” Biometrika, Vol. 33, No. 4, 1946, pp. 305-325. http://dx.doi.org/10.1093/biomet/33.4.305
- A. I. Khuri and J. A. Cornell, “Response Surfaces: Design and Analysis,” Marcel Decker Inc., New York, 1987.
- P. W. Araujo and R. G. Brereton, “Experimental Design .2. Optimization,” TrAC. Trends in Analytical Chemistry, Vol. 15, No. 2, 1996, pp. 63-70.
- P. Mercier, L. Yerushalmi, D. Rouleau and D. Dochain, “Kinetics of Lactic-Acid Fermentation on Glucose and Corn by Lactobacillus amylophilus,” Journal of Chemical Technology and Biotechnology, Vol. 55, No. 2, 1992, pp. 111-121. http://dx.doi.org/10.1002/jctb.280550204
- R. Luedeking and E. L. Piret, “A Kinetic Study of the Lactic Acid Fermentation. Batch Process at Controlled pH,” Journal of Biochemistry, Vol. 1, No. 4, 1959, pp. 393-412.
- J. Sebastian, A. K. Chandra and P. E. Kolattukudy, “Discovery of a Cutinase-Producing Pseudomonas sp. Cohabiting with an Apparently Nitrogen-Fixing Corynebacterium sp. in the Phyllosphere,” Journal of Bacteriology, Vol. 169, No. 1, 1987, pp. 131-136.
- T. F. Pio and G. A. Macedo, “Optimizing the Production of Cutinase by Fusarium oxysporum Using Response Surface Methodology,” Enzyme Microbial Technology, Vol. 41, No. 5, 2007, pp. 613-619. http://dx.doi.org/10.1016/j.enzmictec.2007.05.008
- F. J. Rispoli, and V. Shah, “Mixture Design as a First Step for Optimization of Fermentation Medium for Cutinase Production from Colletotrichum lindemuthianum,” Journal of Industrial Microbiology and Biotechnology, Vol. 34, No. 5, 2007, pp. 349-355. http://dx.doi.org/10.1007/s10295-007-0203-y
- A. Rajendran, V. Selvaraj and V. Thangavelu, “Statistical Optmization and Kinetic Modeling of Xylanase Production by Arthrobacter sp.,” Asia-Pacific Journal of Chemical Engineering, Vol. 3, No. 3, 2008, pp. 347-353. http://dx.doi.org/10.1002/apj.138
- A. Rajendran and V. Thangavelu, “Statistical Experimental Design for Evaluation of Medium Components for Lipase Production by Rhizopus arrhizus MTCC 2233,” LWT—Food Science and Technology, Vol. 42, No. 5, 2009, pp. 985-992.
NOTES
*Corresponding author.