CellBio
Vol.2 No.4(2013), Article ID:40429,7 pages DOI:10.4236/cellbio.2013.24020
Immunohistochemical Analysis of the Acid Secretion Potency in Gastric Parietal Cells
1Department of Gene Therapy and Regenerative Medicine, Kagoshima University, Graduate School of Medical and Dental Sciences, Kagoshima, Japan
2Laboratory for Neuroanatomy, Kagoshima University, Graduate School of Medical and Dental Sciences, Kagoshima, Japan
Email: maezono@m.kufm.kagoshima-u.ac.jp
Copyright © 2013 Rie Irie-Maezono, Shinichiro Tsuyama. This is an open access article distributed under the Creative Commons Attribution License, which permits unrestricted use, distribution, and reproduction in any medium, provided the original work is properly cited.
Received July 31, 2013; revised August 31, 2013; accepted September 7, 2013
Keywords: Gastric Parietal Cells; Secretory Potency; Phosphoryl Ezrin; Histochemical Morphometry
ABSTRACT
Gastric parietal cells are important in acid secretion, but it is unclear which cells throughout the gastric gland have the highest secretion potency. Here, we used immunohistochemical methods with anti-H+, K+-ATPase, phosphoryl ezrin and CD44 antibodies to study the distribution of gastric acid secretion activity. Stomach tissues from freely fed and starved rats were cryofixed for light microscopy or fixed by high-pressure freezing for electron microscopy. Parietal cells from freely fed animals corresponded to the active secretion phase and to the inactive resting phase from starved rats. Anti-H+, K+-ATPase and anti-phosphoryl ezrin labeling were observed on the membrane of the intracellular canaliculi and the tubulovesicle from freely fed rats, while cells from starved animals showed weak labeling with anti-phosphoryl ezrin antibody staining. Morphometrical analysis at the electron microscopic level was performed on active and inactive acid secretory phases between the upper and base regions of the gland. H+, K+-ATPase and CD44 were distributed on both sites of the microvillous and tubulovesicle membrane in the same cells, but phosphoryl ezrin localized predominantly on the microvillous membrane in active cells of the glandular neck and upper base. Therefore, the highest secreting potency appeared to be in cells of the glandular neck and upper base.
1. Introduction
Gastric parietal cells play a major role in acid secretion and are widely distributed from the pit to the base of rat gastric glands. They show characteristic aspects of intracellular canaliculi (IC) with numerous microvilli and tubulovesicles (TV) in the cytoplasm, which are thought to be interconvertable structures. Although the conversion mechanism for these structures is unclear, various hypothesizes have been proposed. During the active acid-secreting phase of parietal cells, the IC is markedly expanded, but the cells undergo a morphological transformation during their inactive resting phase when the IC reduces in width and the TV mass increases [1,2]. The secretion activity alternates according to the physiological phases of feeding or starving.
Proton potassium ATPase (H+, K+-ATPase; “the proton pump”) is an important enzyme for gastric acid secretion and exists as an integral membrane-protein along the IC and TV throughout the parietal cell membrane. We previously used high-pressure freezing followed by freeze-substitution to investigate the histochemistry of gastric gland cells and the ultrastructural alterations that occur in both fed and starved phases [3,4]. Cryofixation using rapid freezing (especially high pressure rapid freezing for capable freezing depth) is believed to be superior to conventional chemical fixation with regard to morphological preservation and retention of soluble components. Using antibodies against the proton potassium ATPase α- and β-subunits, we also showed that the enzyme localized on both IC and TV membranes in almost all parietal cells throughout the length of the gland [3-5].
Parietal cells contain more actin than other glandular cells. Transformation between IC and TV occurs with redistribution of actin in the cell. Filamentous actins are anchored to the plasma membrane via phosphoryl ezrin, and most actin molecules are thought to form a globular structure in the inactive resting state, which molecules polymerize rapidly to form a filamentous structure upon active acid secretion [2,6-11]. Ezrin is a member of the ERM (ezrin/radixin/moesin) family of proteins that is implicated in linking functional activities of the plasma membrane to the actin cytoskeleton. In addition, actin binds to intramembranous CD44 via phosphoryl ezrin in the plasma membrane [12-14]. It has previously been suggested that the above-mentioned morphological changes are induced and triggered by this cytoskeletal reorganization of β-actin [15-17].
The purpose of the present study was to investigate which parietal cells are more active than others in terms of acid secretion, based on the distribution of phosphoryl ezrin and CD44 throughout the gland using immunohistochemical techniques.
2. Materials and Methods
2.1. Tissue Preparation
Ten male Wistar rats were used in the experiments and divided into two groups of five animals each. One group was fed freely and the other was starved for 48 h with free access to water. The rats were anesthetized with an intraperitoneal injection of sodium pentobarbital, and the pH of the luminal gastric juice was determined. The stomach tissues were cut into small pieces and cryofixed using a rapid freezing device (RF-6, Eiko, Japan) using liquid propane for cryofixing and liquid nitrogen for light microscopy. The specimens were then freeze-substituted with acetone containing 0.2% glutaraldehyde at −79˚C for 72 h and embedded in paraffin [17].
For electron microscopy, the specimens underwent high-pressure freezing under a 21 × 105 hPa atmosphere (HPM 010, BAL-TEC, Liechtenstein). The frozen specimens were freeze-substituted with acetone containing 1% osmium tetroxide or 0.2% glutaraldehyde at −79˚C for 72 h and were embedded in Epon812 or Lowicryl K4M resin, respectively [3].
2.2. Primary and Secondary Antibodies
A rabbit antibody against the H+, K+-ATPase (proton pump) a-subunit (Immunogen; C-terminal synthetic peptide based on the porcine H+, K+-ATPase a-subunit sequence) was purchased from Calbiochem-Novabiochem (San Diego, CA). The antibody was used at a dilution of 1:100 in phosphate buffered saline (PBS). A mouse monoclonal antibody against the H+, K+-ATPase b-subunit (Immunogen; purified 34-kDa core peptide from deglycosylated hog gastric microsomes) was purchased from Abcam Ltd. (Cambridge, UK) and diluted 1:200 in PBS. A rabbit polyclonal antibody against phosphoryl ezrin (Immunogen: KLH-conjugated, synthetic phosphopeptide corresponding to residues surrounding Thr567 of human ezrin) and an anti-CD44 antibody were purchased from CHEMICON International, Inc. (Temecula, CA). These were used at a dilution of 1: 10 - 20 in PBS. A mouse monoclonal antibody against actin (pan Ab-5; Clone ACTN05) was purchased from LAB VISION Co. (Fremont, CA). This antibody reacts with all six known isoforms of vertebrate actin (MW-42 kD) and also with two highly homologous cytoplasmic actins (b, g). This antibody was diluted 1: 10 - 80 in PBS. The antibodies were confirmed to show cross-reactivity against the rat. The following were used as secondary antibodies: biotinylated goat anti-mouse immunoglobulin (F(ab')2) or biotinylated swine anti-rabbit immunoglobulin (DAKO Cytomation, Glostrup, Denmark) diluted 1: 100 - 200 in PBS; horseradish peroxidase (HRP)-conjugated streptavidin (DAKO Cytomation) (1:200 in Tris-buffered-saline; TBS); colloidal gold (CG)-conjugated streptavidin (1:1 in PBS) from British BioCell International (Cardiff, UK).
2.3. Immunohistochemical Staining for Light Microscopy
Specimens embedded in paraffin were cut into 4 mmthick slices with a sliding Jung-model microtome, mounted on silconized glass slides and air-dried. Sections were deparaffinized, rehydrated and immersed in PBS. After blocking endogenous peroxidase activity with 0.3% hydrogen peroxide in methanol, specimens were incubated with primary antibodies against the H+, K+-ATPase α- and β-subunits. They were then labeled with biotinylated anti-rabbit or anti-mouse IgG antibodies overnight followed by HRP-conjugated streptavidin for 1 h. Visualization was performed using 3, 3'-diaminobenzidine tetrahydrochloride (DAB; DAKO Cytomation) for 10 min. Finally, sections were rinsed in distilled water, counterstained with Mayer’s hematoxylin, dehydrated in a graded ethanol series, cleared in xylene and mounted with Eukitt (O. Kindler, Germany).
2.4. Electron Microscopy
Ultrathin sections from specimens fixed with 1% osmium tetroxide and embedded in epoxy resin were cut with a Reichert Ultracat-N ultramicrotome and stained with uranyl acetate and Reynolds’ lead citrate. They were observed using a HITACHI H-7000 electron microscope at an acceleration voltage of 80 kV.
Specimens fixed with 0.2% glutaraldehyde and embedded in Lowicryl K4M resin were stained by the immunogold method (particle size of colloidal gold (CG): 15 nm and 10 nm). Thin sections were incubated with unlabeled-streptavidin (Southern Biotech, Birmingham, AL) for 30 min at room temperature to block endogenous biotin. Immunogold staining was performed as described previously [4,18]. Briefly, the sections were incubated with anti-H+, K+-ATPase α- and β-subunits, anti-phosphoryl ezrin and anti-CD44 antibodies followed by biotinylated anti-rabbit or anti-mouse IgG antibodies and labeled with streptavidin-colloidal gold. Finally, the sections were counterstained with uranyl acetate and Millonig’s lead acetate.
2.5. Morphometrical Analysis of Labeling Density with Phosphoryl Ezrin Immunogold Staining
The parietal cell labeling density with the anti-phosphoryl ezrin antibody was analyzed using Image-J NIH software. Thus, the labeling number of gold particles (on IC containing multiple microvilli) was counted on electron microscopic photographs taken at 15,000 × magnification of the neck or base region (n = 20 each) of active phase glands (fed animals) and inactive resting phase glands (starved animals). The labeling density was estimated as the number of gold particles per unit area (μm2) of IC. For the assessment of the phosphoryl ezrin labeling-density, the results were statistically analyzed by t-test using Microsoft Excel software. Statistical comparisons were made between the neck and the base area of the gland, and between active versus inactive glands from starved animals. The differences between sites or feeding/starving were evaluated by t-test. P < 0.01 or 0.05 was considered significant. The results are expressed as the arithmetic mean ± SE.
3. Results
3.1. Morphological Observation
The average pH in the fed rats was 2.0, compared with 6.4 in the starved rats. We therefore hypothesized that the former corresponds to the active phase and the latter to the inactive resting phase of gastric juice secretion.
The parietal cells showed excellent ultrastructural preservation at the electron microscopic level. The ultrastructure of IC, TV, and other organelles was well preserved for each active and inactive phase of glands when specimens were processed successfully by means of HPF-followed by FS.
3.2. Immunohistochemical Observation with Anti-H+, K+-ATPase Antibody
The parietal cells were labeled intensely and clearly by immunohistochemical staining with the H+, K+-ATPase anti-aand -b-subunit antibodies. Cells in the neck and upper base were labeled particularly strongly in active phase animals. Staining was evenly distributed from the deep pit to the glandular base of the cells (Figures 1(A) and (B)), and the staining pattern was similar between the anti-β-subunit antibody and a-subunit antibody (data not shown). In the active phase, the microvillous membrane and apical cell membrane of the IC were labeled with the anti-α- and -β-H+, K+-ATPase subunit antibodies and with the anti-phosphorylated-ezrin antibody (corresponding to residues surrounding Thr566 and 567), while TV membranes were hardly stained. In the inactive phase, IC microvilli were labeled weakly with this antibody. The anti-CD44 antibody staining pattern was similar to that of anti-a- (and -b-) H+, K+-ATPase subunit antibodies in inactive phase animals (Figures 2, 3(A) and (B)). A regional labeling difference was evident from the neck to the upper base and lower base.
3.3. Morphometric Analysis with Anti-Phosphoryl Ezrin Antibody and Immunogold Labeling
Immunogold staining was performed to examine the intracellular distribution and the labeling density of the
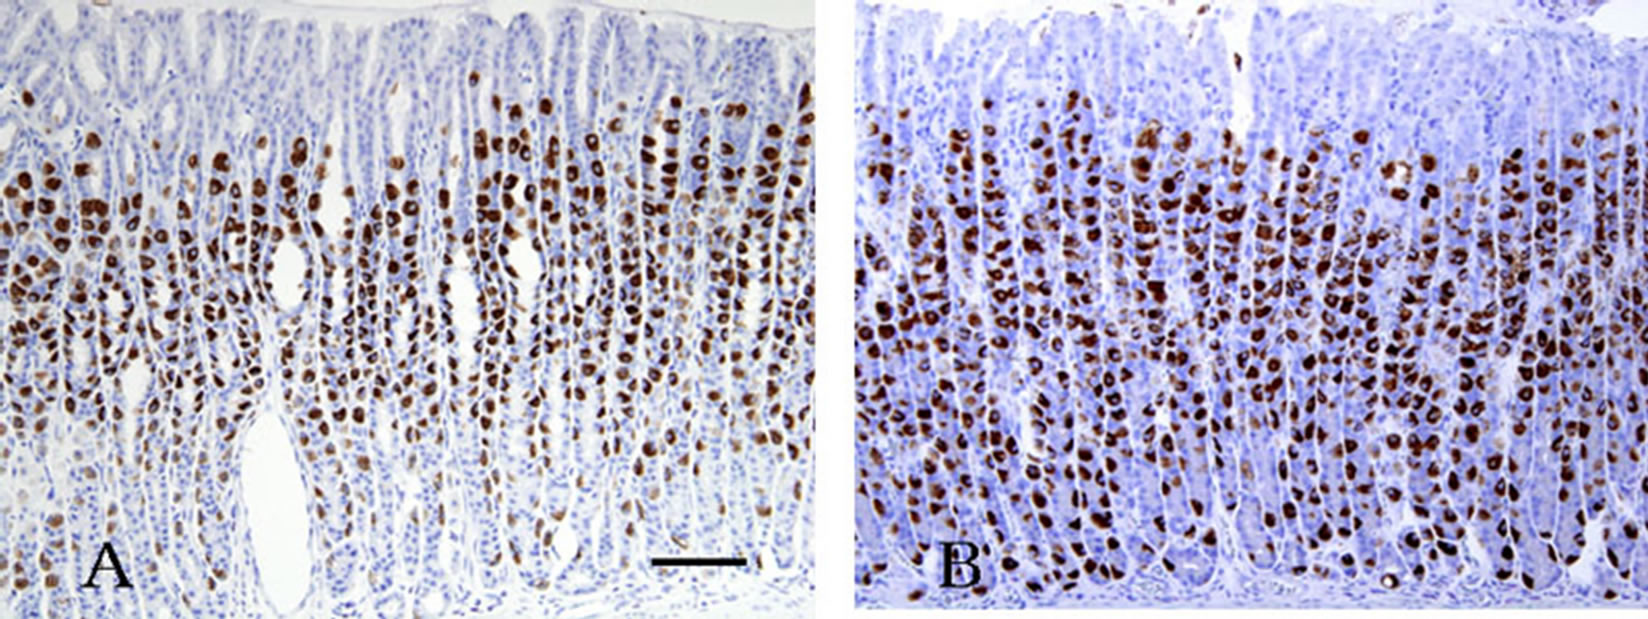
Figure 1. Active phase rat gastric gland immunostained with the anti-H+, K+-ATPase a-subunit antibody. (A) Parietal cells throughout the gland are stained strongly. Cells are large and plump and become smaller and more slender as they migrate downwards. Reaction products are threadlike in shape; (B) Inactive resting phase gland with similar staining. Parietal cells scattered throughout the gland are also stained positively and reaction products were observed diffusely in the cytoplasm. Scale bar = 100 μm.
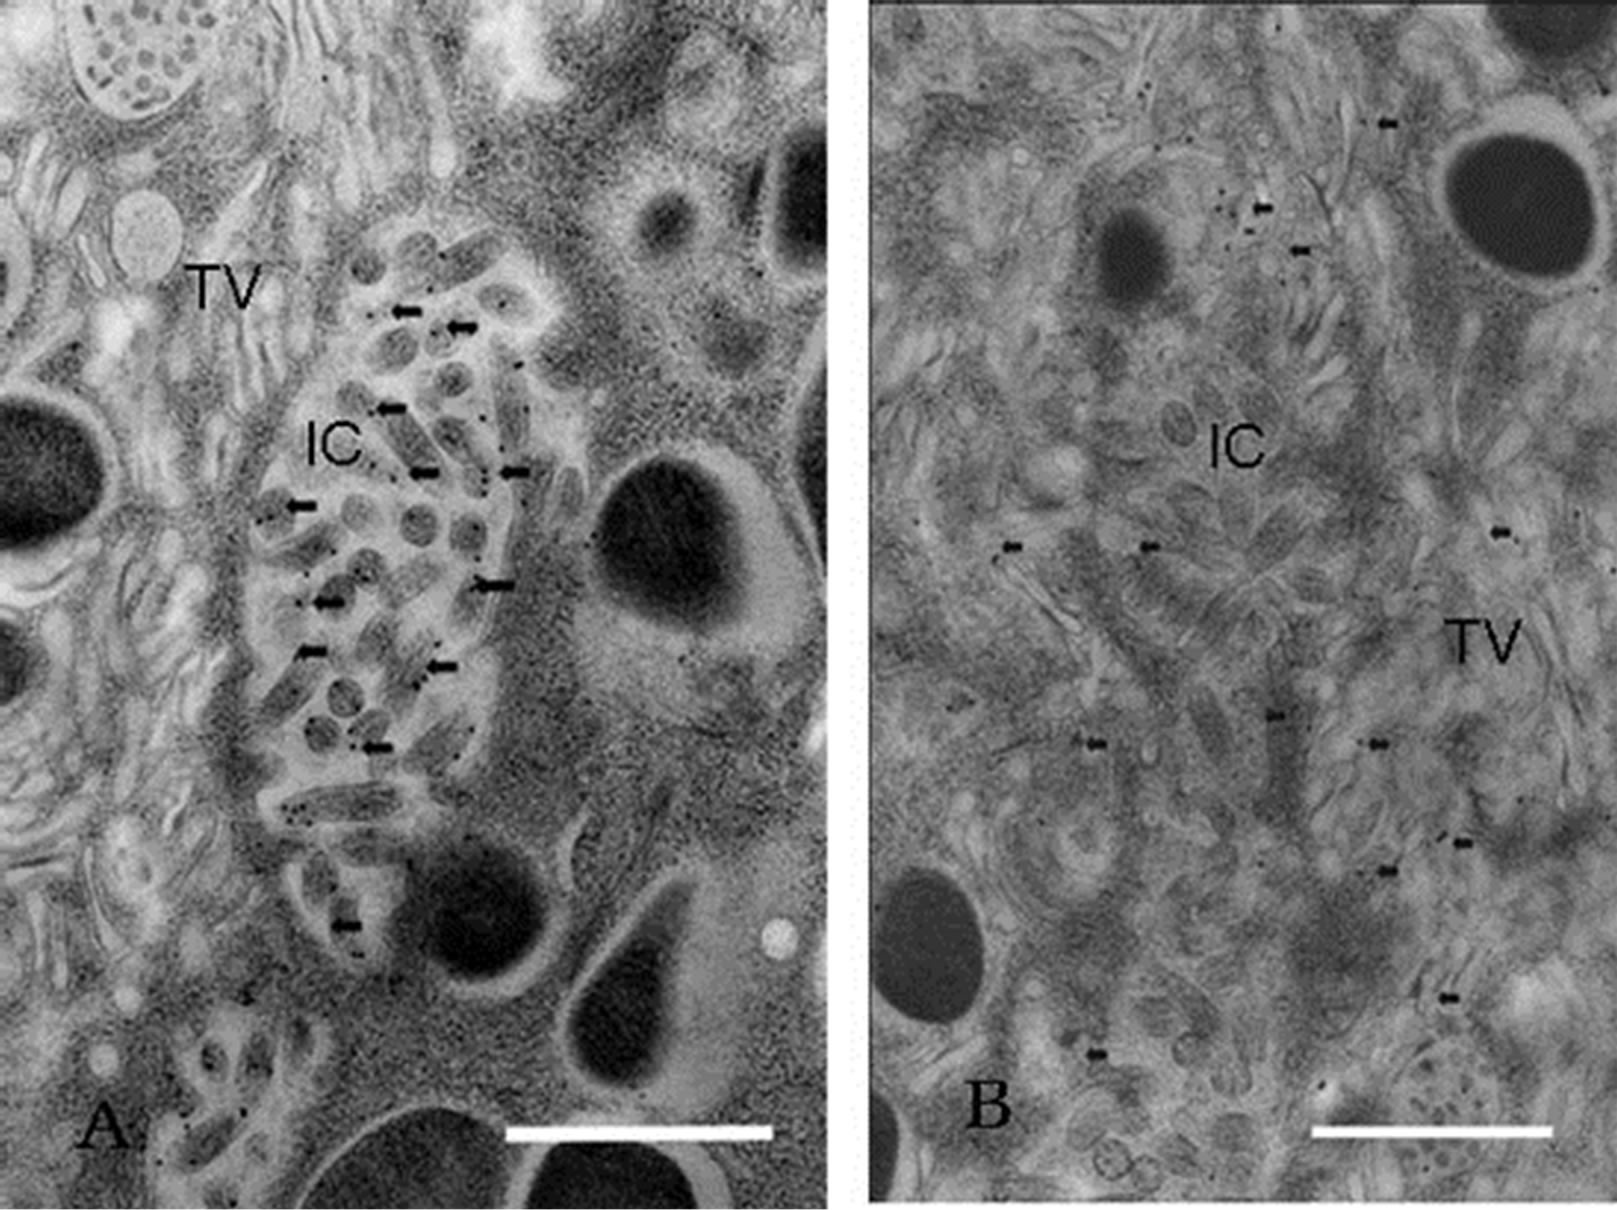
Figure 2. Section of parietal cells stained with immunogold method. (A) Anti-phosphoryl ezrin antibody staining. The IC membrane and its microvilli were stained with antiphosphoryl ezrin antibody, but little staining was visible on the TV membrane; (B) Anti-CD44 ant-ibody staining. The two organelles (IC and TV) were labeled with this antibody. Scale bar = 1 μm.
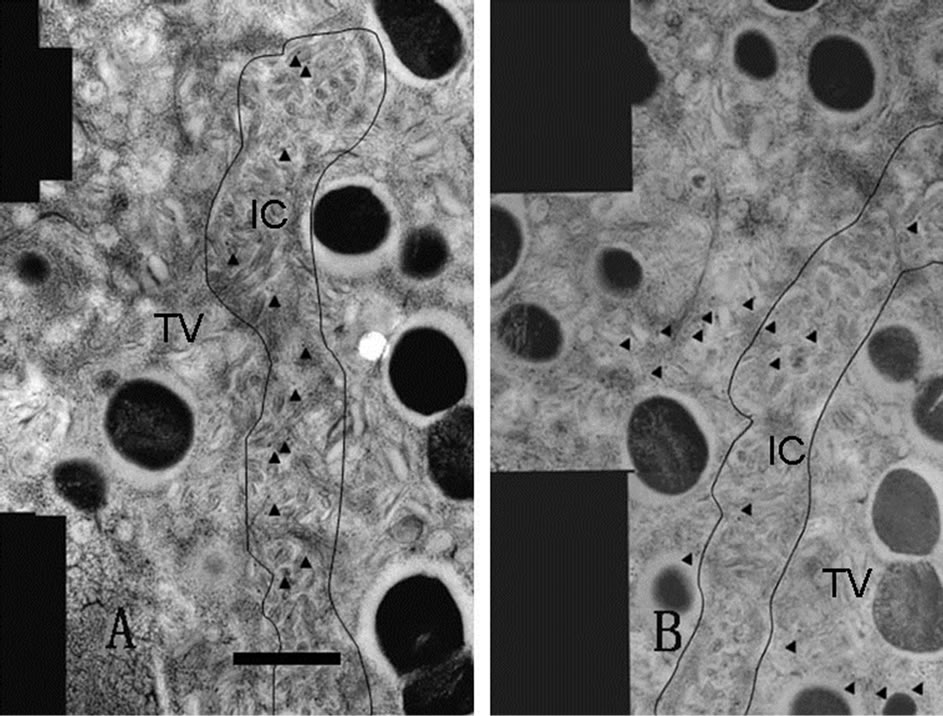
Figure 3. Adjacent serial sections immunostaining. Each photograph is composed of several distinct pictures (montaged pictures) and serially sectioned. Labeled gold particles are shown with arrowheads. The anti-phosphoryl ezrin antibody bound only to the IC microvilli (A), while the antiCD44 antibody labeled both the IC and TV (B). Scale bar = 1 μm.
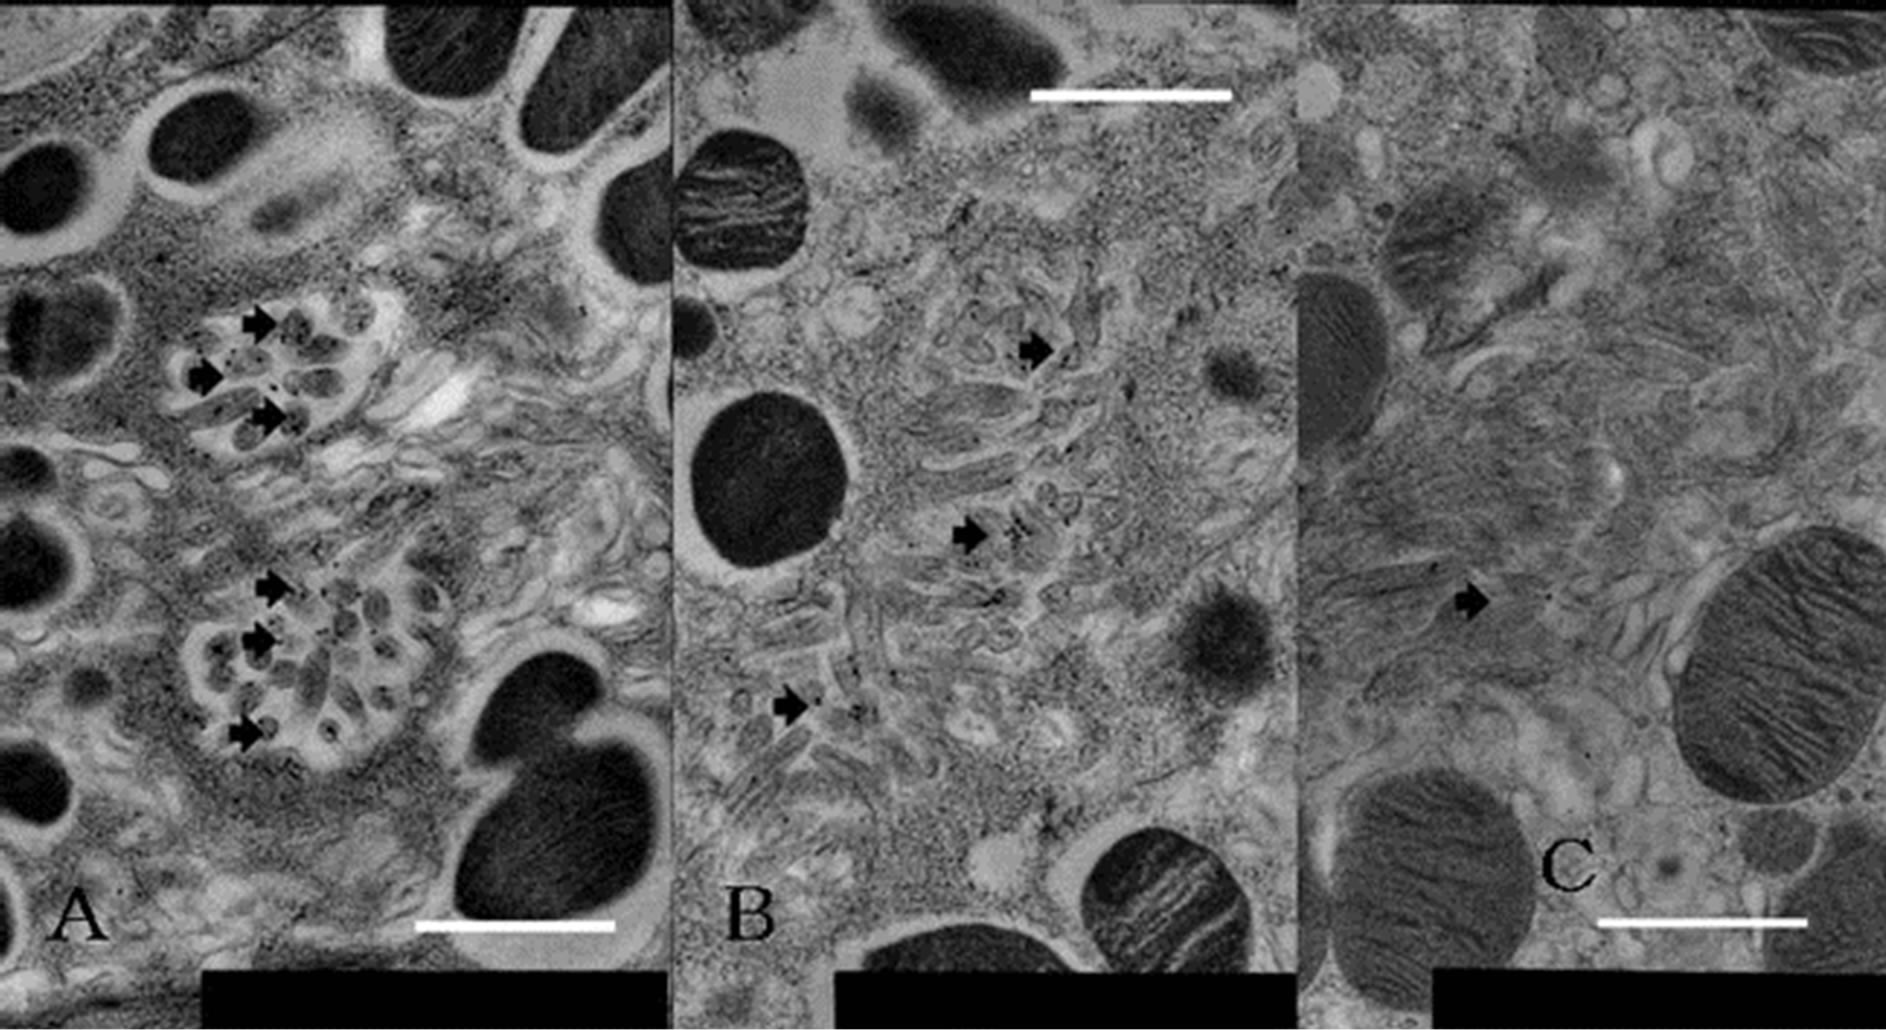
Figure 4. Labeling differences in each level of gland of parietal cell stained with immunogold using anti-phosphoryl ezrin antibody. (A) Neck region, adjoining mucous neck cell in active animals; (B) Lower region of base, neighboring chief cell; (C) Neck region from starved rats. Anti-phosphoryl ezrin antibody labeling is strong on IC membrane of parietal cell from fed (active secreting) rats (A), and moderate to weak in lower half of base (B) and through gland from starved (inactive resting or inactive secreting) rats (C). Scale bar = 1 μm.
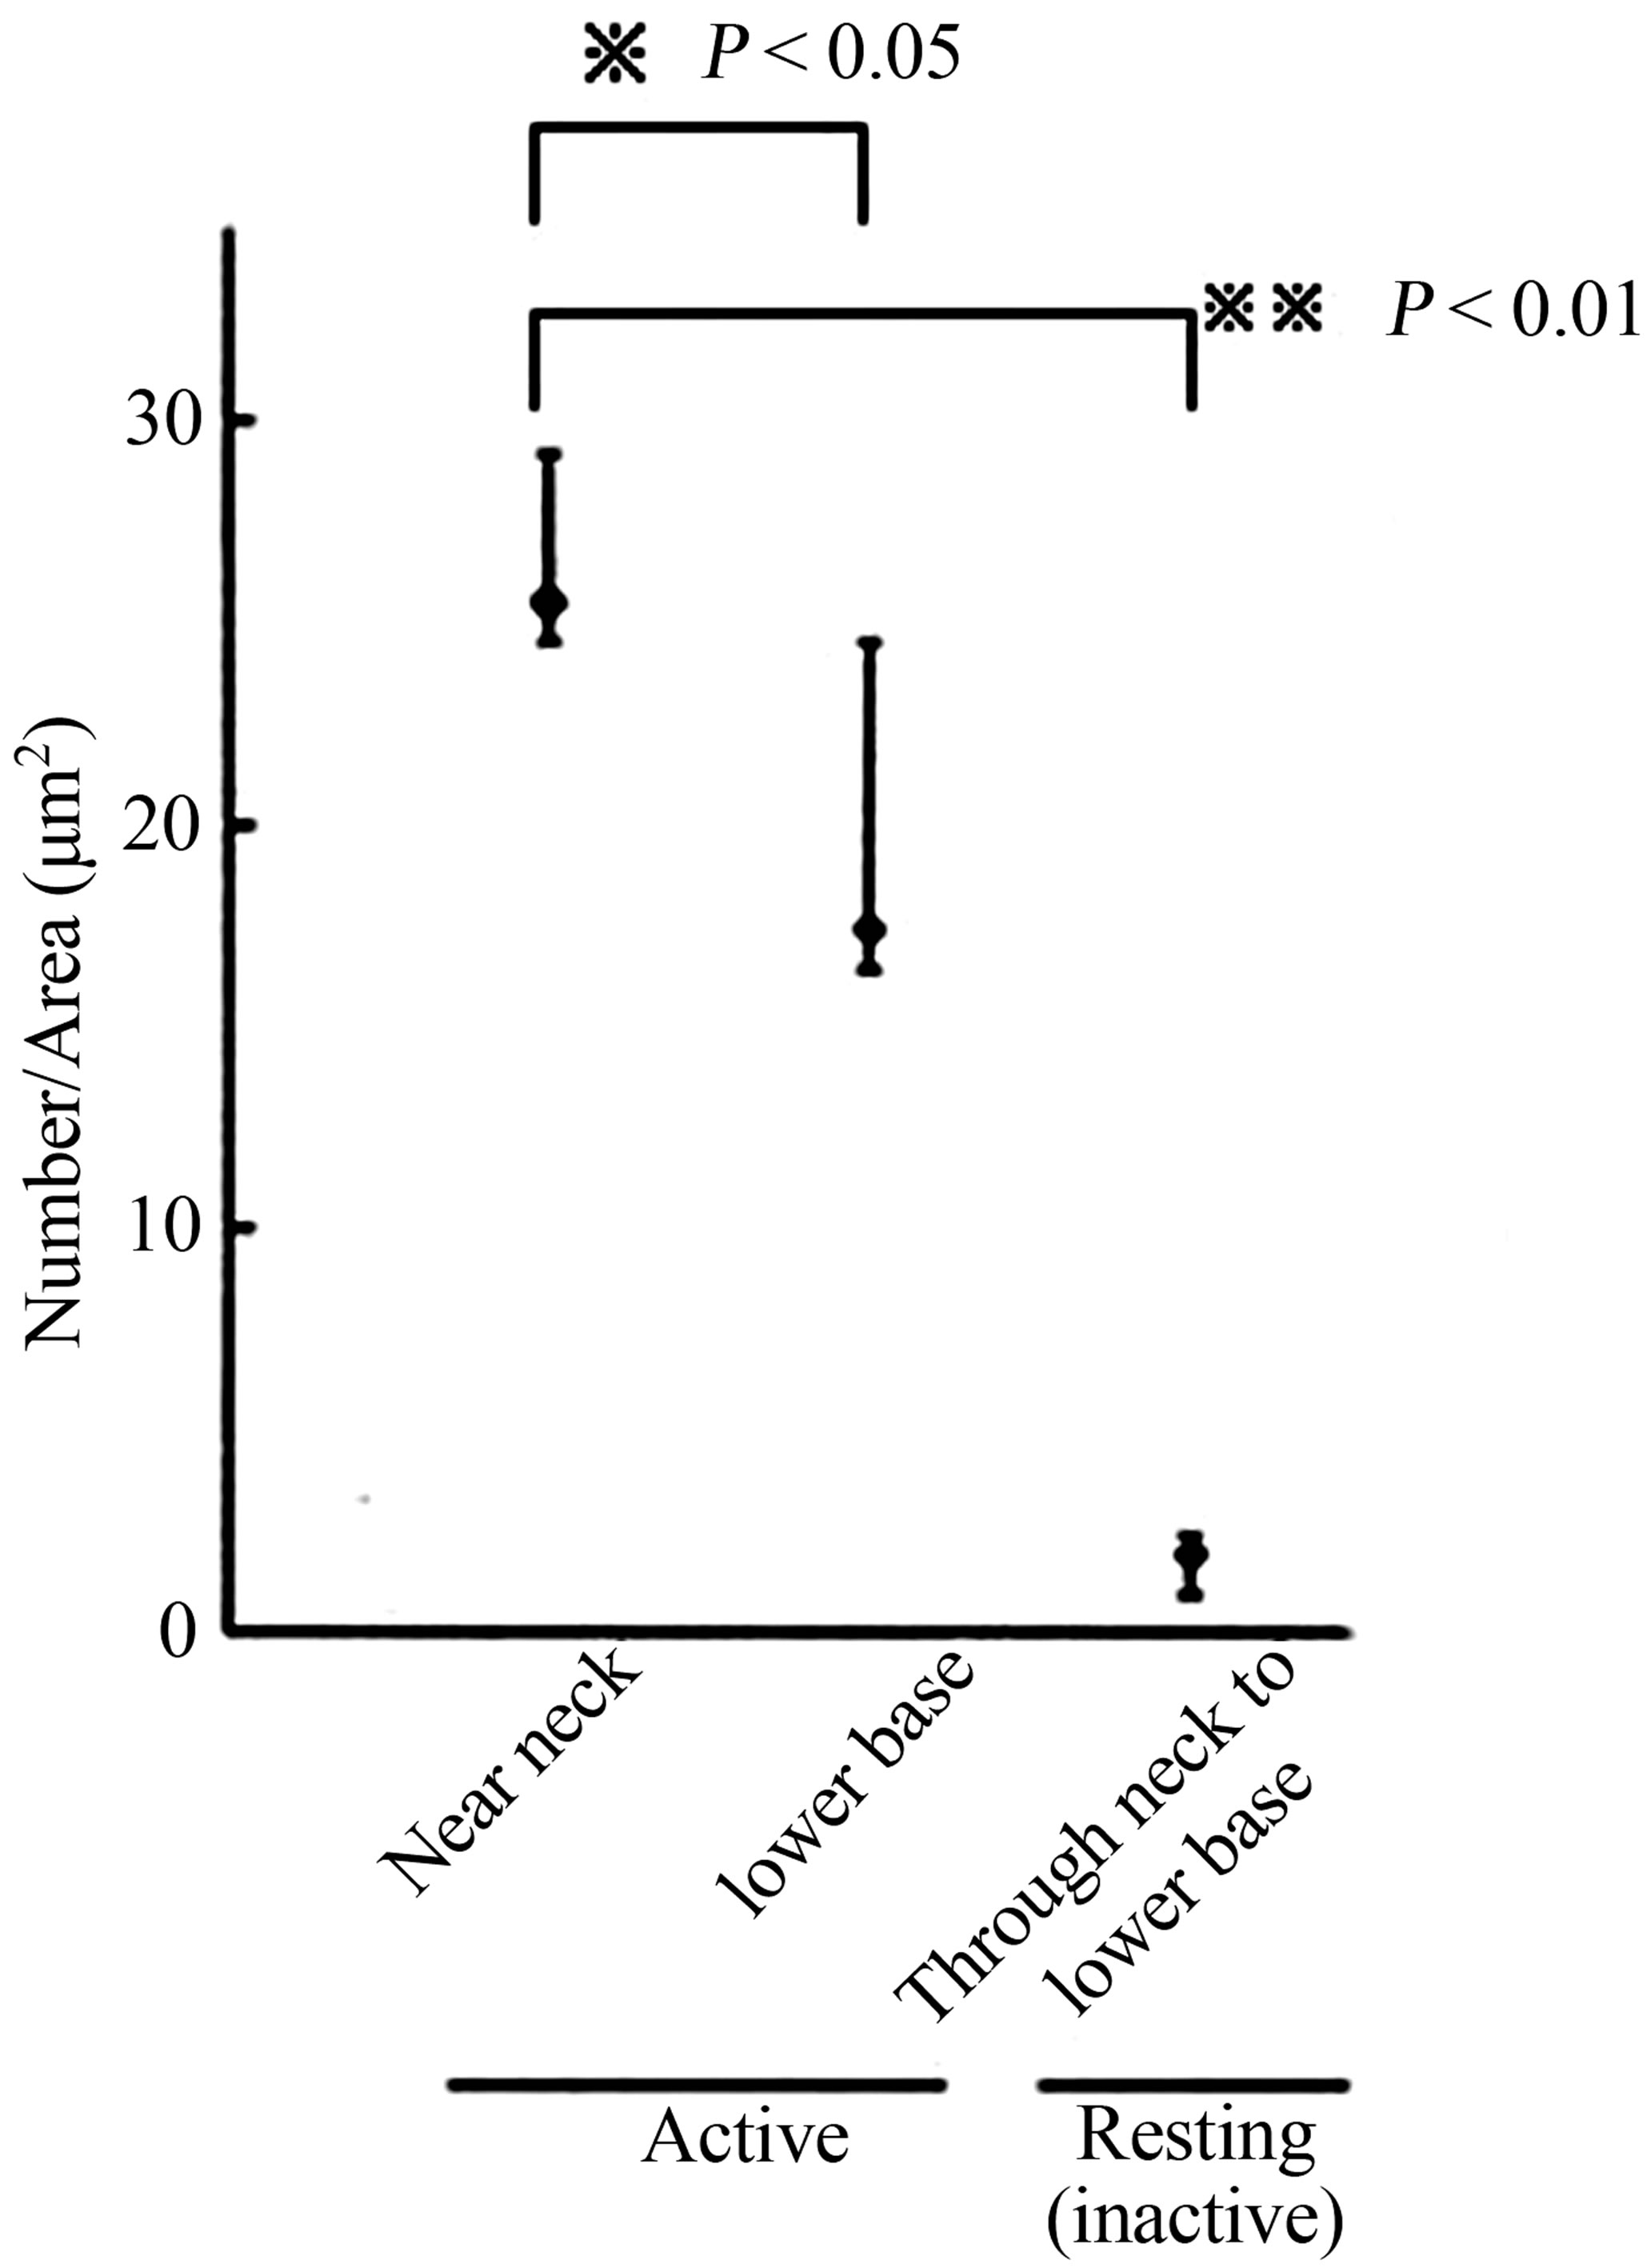
anti-phosphoryl ezrin antibody in each cell between the gland segments. Parietal cells adjacent to mucous neck cells or chief cells were deemed to be in the neck or base region, respectively. The gold particle numbers were compared between the neck and the base region of the glands, and between active and inactive resting glands (Figure 4). The number of labeled gold particles was divided by the IC area to give the labeling density (per µm2). Labeling density zonation was clear from the neck to the base, with a significantly higher density in parietal cells located in the isthmus to neck region (mean ± SE; 25.501 ± 3.736 µm2) compared with the glandular lower base (17.082 ± 7.275 µm2) or from inactive starved rats (1.926 ± 0.465 µm2) (Figures 5(A) and (B)).
Statistical analysis using IMAGE-J revealed that phosphoryl ezrin expression in the neck and upper base was significantly higher than that in lower base (25.501 ± 3.736 vs 17.082 ± 7.275, p < 0.05) and than that in starved gland (25.501 ± 3.736 vs 1.926 ± 0.465, p < 0.01). These findings suggest that the phosphoryl ezrin assemble in the membrane of active parietal microvilli at neck to upper base.
4. Discussion
The component cells of gastric glands include pit mucous cells, progenitor cells, parietal cells, mucous neck cells, chief cells and endocrine cells and have previously been studied in rodents. These cells undergo mitosis in the isthmus, from where they migrate and differentiate along the longitudinal axis of the gland in an upward or downward direction [19-21]. The parietal cells migrate upwards and downwards then mature, while chief cells derive from the mucous neck cell through an intermediate cell type to the mature chief cell in a downwards migration [17]. Parietal cells adjoining the mucous neck cell are considered to be in the neck region and those next to the chief cell are in the base region of the gland.
Gastric juice is very acidic, with a pH of around 1.5. The average pH value measured in this study was pH 2.0 in fed rats and pH 6.4 in starved animals, indicating that the parietal cells of fed rats correspond to cells in the active secretory-phase, while those of starved animals correspond to cells in the inactive resting phase. The pa-
 (A)
(A)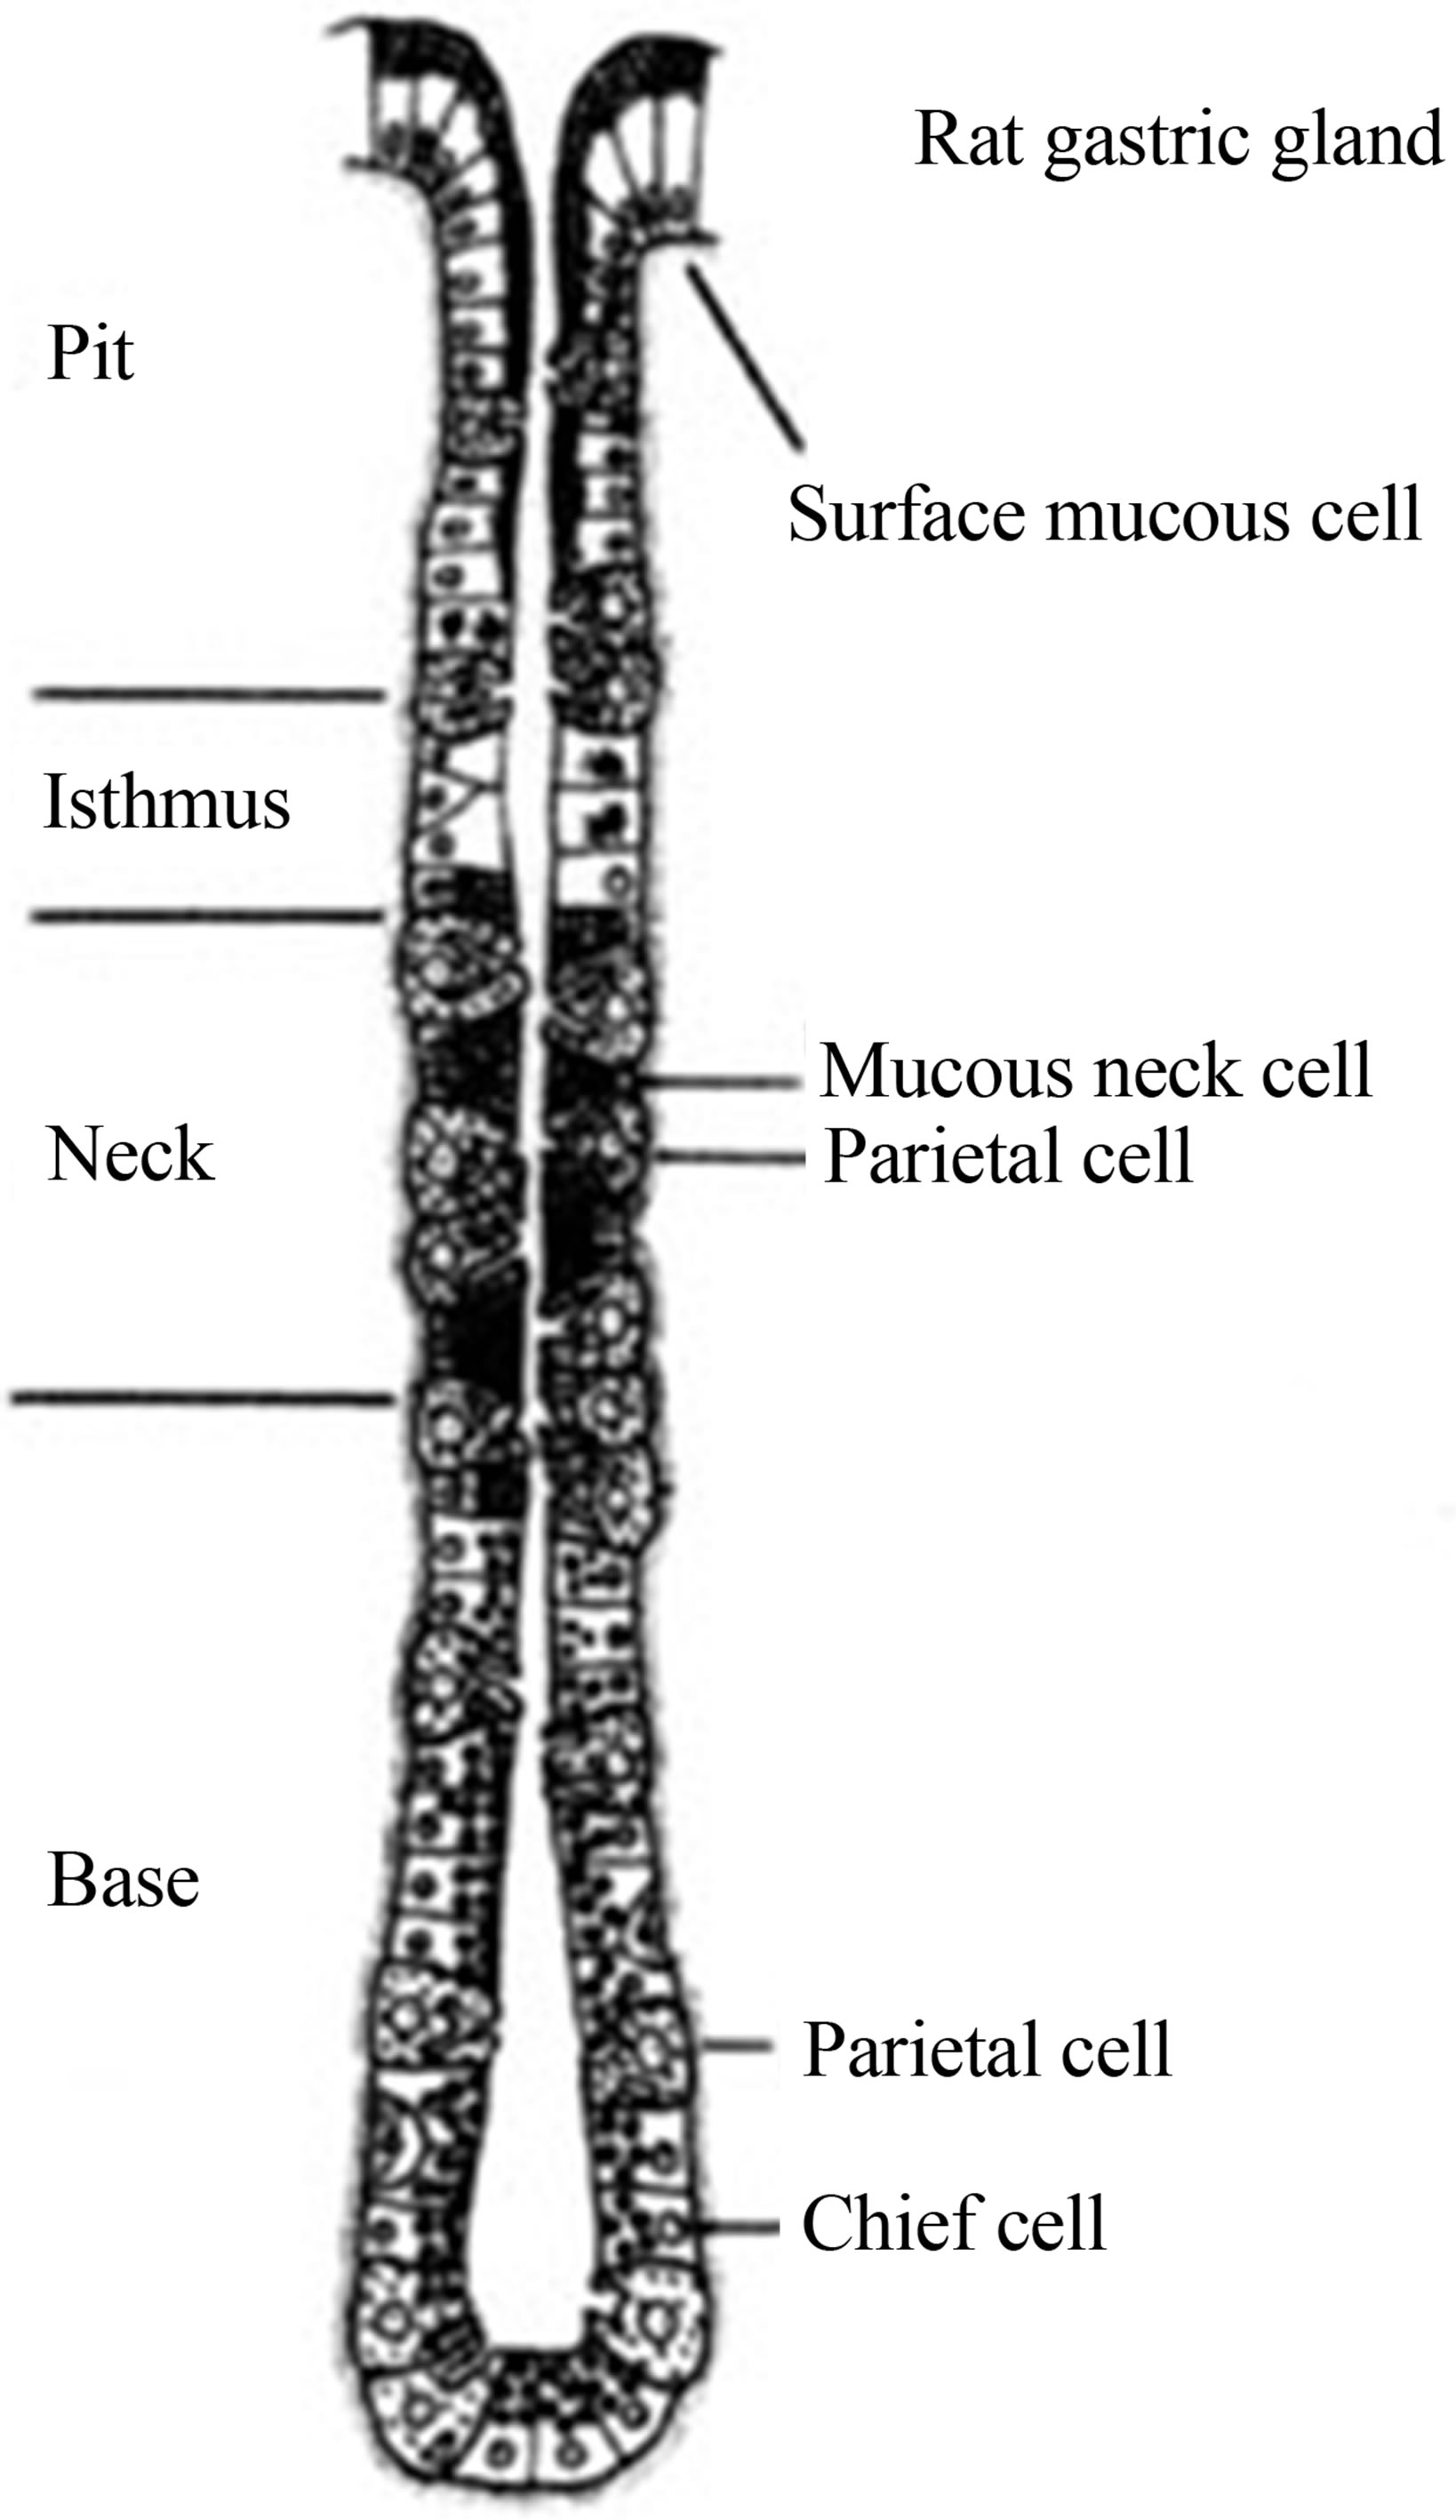 (B)
(B)
Figure 5. (A) Schematic drawing of rat gastric gland. After proliferation in the glandular isthmus, the parietal cell migrates and differentiate through neck to base of gland; (B) Statistical analysis of phosphoryl-ezrin plotting. The labeling of the cell in the near neck site was significantly higher than that in the lower base, or whole site of the gland in the resting (the inactive).
rietal cells are distributed broadly through the gland from the isthmus to the base. The cells are large and plump from the isthmus to the upper base, although they become smaller and more slender in the lower base as they migrate downwards [19-22].
Routine light microscopy revealed parietal cells of an acidophilic nature with numerous mitochondria in the cytoplasm. The cells were stained with immunolabeling using an anti-H+, K+-ATPase antibody, and the reaction products had a thread-like appearance, especially in the isthmus to the neck region [5,18]. The expression pattern followed the contour line of the stained apical-cell membrane. In previous studies, we used high pressure-frozen, freeze-substituted and resin-embedded tissue samples to demonstrate the intracellular localization of H+, K+-ATPase [3,23]. This antibody clearly stained the IC containing many microvilli in the active phase, while TV was stained in the inactive resting phase. Diffuse cytoplasmic staining was observed in cells scattered widely from the isthmus to the glandular base. This aspect is thought to derive from TV membrane staining at the light microscopy level.
Yao et al. [15] revealed that most actin in the gastric gland is present in parietal cells, which are largely globular during the inactive resting secretion phase. However, during the active phase, actin forms a filamentous structure. Jöns et al. [24] reported that the binding of actin to the plasma membrane is dependent on phosphoryl ezrin molecules, and the initiation of ultrastructural changes in parietal cells is thought to be induced by the polymerization of cytoskeletal actin [2,7,15] followed by binding of the actin molecule to the C-terminal of phosphoryl ezrin and intramembranous CD44 to the N-terminus [8-10, 16,25,26]. Non-phosphoryl ezrin molecules are distributed throughout the cytoplasm without binding actin in the inactive resting phase [16,29-29], while localization of the ezrin-actin linkage in the cytoplasm occurs in the active phase during the formation of phosphorylated ezrin molecules and filamentous actin-molecule binding. This indicates that phosphoryl ezrin and actin are related to the cell surface distribution of the H+, K+-ATPase proton pump.
In the present study, immunostaining with the phosphoryl ezrin antibody resulted in heavy labeling in the neck to the upper base region (Figures 3 and 4), revealing that the labeled cells are in the active phase [5]. A statistical morphometric data comparison of neck and base cells showed that phosphoryl ezrin and H+, K+- ATPase were present in similar sites within the same cell [18]. The apical membrane of IC containing microvilli in the active phase was labeled by immunogold staining with the anti-phosphoryl ezrin antibody. On the other hand, labeling of these structures was weak in the inactive resting phase (Figures 4 and 5).
These findings suggest that the parietal cells in the neck and upper base are more active than those in the lower base. Karam et al. [20] described the intracellular mitochondrial distribution of parietal cells at various levels of the mouse gastric gland and revealed a high number in the isthmus and neck. Moreover, the integral H+, K+-ATPase is exposed on the luminal surface when IC is enlarged, and the enzyme is activated by a successive K+ ion supply. On the other hand, the increasing TV volume results in a decreased surface area of the canaliculi membrane as the IC and TV derive from similar membrane systems [12]. The TV is transformed into the apical plasma membrane during acid secretion [2]. H+, K+- ATPase then becomes an intravesicular membrane protein and acid secretion is halted because of an interruption in the K+ ion supply. This transformation is limited at sites with small amounts of phosphoryl ezrin, such as the middle to the bottom region of the gland [18,22] where parietal cells are small and slender. Here, it is thought that the acid secretory capacity is limited and unresponsive to physiological or feeding conditions.
The purpose of this work was to decide at which level parietal cells are most active. Acid secretion activity in the gland appears to be higher in the segment from the isthmus to the upper glandular base, which agrees with the findings of Fykse et al. [30] who reported that parietal cells in the second part of four segments in the gland were activated by histamine treatment. Jiang et al. [5] reported that the acid-secreting potency of individual parietal cells was higher in the upper third of the gland (containing the superficial part). Further experiments are required to clarify the secretion system of gastric acid in parietal cells.
5. Acknowledgements
We would like to thank Mr. S. Nonaka for technical assistance and Professor K. Kosai and Professor emeritus S. Nakagawa for helpful comments. This work was supported in part by a Grant-in-Aid for Scientific Research (No. 15590164 to S. Tsuyama) from the Ministry of Education, Culture, Sports, Science and Technology of Japan and the Kodama Memorial Fund for Medical Research.
REFERENCES
- N. Sugai, S. Ito, A. Ichikawa and M. lchikawa, “The Fine Structure of the Tubulovesiclular System in Mouse Gastric Parietal Cell Processed by Cryofixation Method,” Journal of Electron Microscopy, Vol. 34, No. 2, 1985, pp. 113-122.
- B. J. Agnew, J. G. Duman, C. Watson, D. E. Coling and J. G. Forte, “Cytological Transformations Associated with Parietal Cell Stimulation: Critical Steps in the Activation Cascade,” Journal of Cell Science, Vol. 112, No. 16, 1999, pp. 2639-2646.
- S. Tsuyama, S. Matsushita, T. Takatsuka, S. Nonaka, K. Hasui and F. Murata, “Cytochemical Investigation of Gastric Gland Component Cells with High-Pressure Freezing Followed by Freeze-Substitution and Hydrophilic Resin Embedding,” Anatomical Science International, Vol. 77, No. 1, 2002, pp. 74-83. http://dx.doi.org/10.1046/j.0022-7722.2002.00011.x
- D. Wakamatsu, S. Tsuyama, R. Maezono, K. Katoh, S. Ogata, S. Takao, S. Natsugoe, T. Aikoh and F. Murata, “Immunohistochemical Detection of the Cytoskeletal Components in Gastric Parietal Cells,” Acta Histochemica et Cytochemica, Vol. 38, No. 5, 2005, pp. 331-337. http://dx.doi.org/10.1267/ahc.38.331
- X. Jiang, E. Suzaki and K. Kataoka, “Immunofluorescence Detection of Gastric H(+)/K(+)-ATPase and Its Alterations as Related to Acid Secretion,” Histochemistry and Cell Biology, Vol. 117, No. 1, 2002, pp. 21-27. http://dx.doi.org/10.1007/s00418-001-0369-8
- C. Andréoli, M. Martin, R. R. Le Borgne and P. Mangeat, “Ezrin Has Properties to Self-Associate at the Plasma Membrane,” Journal of Cell Science, Vol. 107, No. 9, 1994, pp. 2509-2521.
- X. Yao, L. Chen and J. G. Forte, “Biochemical Characterization of Ezrin-Actin Interaction,” The Journal of Biological Chemistry, Vol. 271, No. 12, 1996, pp. 7224- 7729. http://dx.doi.org/10.1074/jbc.271.12.7224
- D. T. Dransfield, A. Bradford, J. Smith, M. Martin, C. Roy, P. H. Mangeat and J. R. Goldenring, “Ezrin Is a Cyclic AMP-Dependent Protein Kinase Anchoring Protein,” The EMBO Journal, Vol. 16, No. 1, 1997, pp. 35-43. http://dx.doi.org/10.1093/emboj/16.1.35
- X. Cao, X. Ding, Z. Guo, R. Zhou, F. Wang, F. Long, F. Wu, F. Bi, Q. Wang, D. Fan, J. G. Forte, M. Teng and X. Yao, “PALS1 Specifies the Localization of Ezrin to the Apical Membrane of Gastric Parietal Cells,” The Journal of Biological Chemistry, Vol. 280, No. 14, 2005, pp. 13584- 13592. http://dx.doi.org/10.1074/jbc.M411941200
- X. Ding, H. Deng, D. Wang, J. Zhou, Y. Huang, X. Zhao, X. Yu, M. Wang, F. Wang, T. Ward, F. Aikhionbare and X. Yao, “Phspho-Regulated ACAP4-Ezrin Interaction Is Essential for Histamine-Estimated Parietal Cell Secretion,” The Journal of Biological Chemistry, Vol. 285, No. 24, 2010, pp. 18769-18780. http://dx.doi.org/10.1074/jbc.M110.129007
- M. Nishi, F. Aoyama, F. Kisa, H. Zhu, M. Sun, P. Lin, H. Ohta, B. Van, S. Yamamoto, S. Kakizawa, H. Sakai, J. Ma, A. Sawaguchi and H. Takeshima, “TRIM50 Regulates Vesicular Trafficking for Acid Secretion in Gastric Parietal Cell,” The Journal of Biological Chemistry, Vol. 287, No. 40, 2012, pp. 33523-33532. http://dx.doi.org/10.1074/jbc.M112.370551
- P. V. Jensen and L.-I. Larson, “Actin Microdomains on Endothelial Cells: Association with CD44, ERM Proteins, and Signaling Molecules during Quiescence and Wound Healing,” Histochemistry and Cell Biology, Vol. 121, No. 5, 2004, pp. 361-369. http://dx.doi.org/10.1007/s00418-004-0648-2
- K. L. Brown, D. Birkenhead, J.-C. Y. Lai, L. Li, R. Li and R. Johnson, “Regulation of Hyaluronan Binding by F-Actin and Colocalization of CD44 and Phosphorylated Ezrin/Radixin/Moesin (ERM) Proteins in Myeloid Cells,” Experimental Cell Research, Vol. 303, No. 2, 2005, pp. 400-414. http://dx.doi.org/10.1016/j.yexcr.2004.10.002
- V. Orian-Rousseau, H. Morrison, A. Matzke, T. Kastilan, G. Pace, P. Herrliich and H. Ponta, “Hepatocyte Growth Factor-Induced Ras Activation Requires ERM Proteins Linked to Both CD44v6 and F-Actin,” Molecular Biology of the Cell, Vol. 18, No. 1, 2007, pp. 76-83. http://dx.doi.org/10.1091/mbc.E06-08-0674
- X. Yao, C. Chaponnier, G. Gabbiani and J. G. Forte, “Polarized Distribution of Actin Isoforms in Gastric Parietal Cells,” Molecular Biology of the Cell, Vol. 6, No. 5, 1995, pp. 541-557. http://dx.doi.org/10.1091/mbc.6.5.541
- L. Zhu, J. Crothers Jr., R. Zhou and J. G. Forte, “A Possible Mechanism for Ezrin to Establish Epithelial Cell Polarity,” American Journal of physiology Cell Physiology, Vol. 299, No. 2, 2010, pp. C431-C443. http://dx.doi.org/10.1152/ajpcell.00090.2010
- K. Ihida, T. Suganuma, S. Tsuyama and F. Murata, “Glycoconjugate Histochemistry of the Rat Fundic Gland Using Griffonia Simplicifolia Agglutinin-II during the Development,” American Journal of Anatomy, Vol. 182, No. 3, 1988, pp. 250-256.
- S. Tsuyama, S. Matsushita, S. Nonaka, S. Yonezawa and F. Murata, “Cytochemical of Gastric Parietal Cells with High-Pressure Freezing Followed by Freeze-Substitution,” The Journal of Electron Microscopy, Vol. 52, No. 2, 2003, pp. 145-151. http://dx.doi.org/10.1093/jmicro/52.2.145
- S. M. Karam and C.-P. Leblond, “Dynamics of Epithelial Cells in Corpus of the Mouse Stomach. IV Bidirectional Migration of Parietal Cells Ending in Gradual Degeneration and Loss,” The Anatomical Record, Vol. 236, No. 2, 1993, pp. 314-332. http://dx.doi.org/10.1002/ar.1092360205
- S. M. Karam, X. Yao and J. G. Forte, “Functional Heterogeneity of Parietal Cells along the Pit-Gland Axis,” American Journal of Physiology, Vol. 272, No. 1, 1997, pp. G161-G171.
- S. M. Karam, T. Staiton, W. M. Hassan and C.-P. Leblond, “Defining Epithelial Cell Progenitors the Human Oxyntic Mucosa,” Stem Cell, Vol. 21, No. 3, 2003, pp. 322-336. http://dx.doi.org/10.1634/stemcells.21-3-322
- D.-H. Yang, S. Tsuyama, Y.-B. Ge, D. Wakamats, J. Ohmori and F. Murata, “Proliferation and Migration Kinetics of Stem Cells in the Rat Fundic Gland,” Histology and Histopathology, Vol. 12, No. 3, 1997, pp. 719-727.
- K. Tyagarajan, D. Chow, A. Smolka and J. G. Forte, “Structutral Interactions between α- and β-Subunits of the Gastric H,K-ATPase,” Biochimica et Biophysca Acta, Vol. 1236, No. 1, 1995, pp. 105-113. http://dx.doi.org/10.1016/0005-2736(95)00044-4
- T. Jöns, H. Heim, U. Kistner and G. Ahnert-Hilger, “SAP97 Is a Potential Candidate for Basolateral Fixation of Ezrin in Parietal Cell,” Histochemistry and Cell Biology, Vol. 111, No. 4, 1999, pp. 313-318. http://dx.doi.org/10.1007/s004180050362
- D. Liu, L. Ge, F. Wang, H. Takahashi, D. Wang, Z. Guo, S.-H. Yoshimura, T. Ward, X. Ding, K. Takeyasu and X. Yao, “Single-Molecule Detection of Phosphorylation-Induced Plasticity Changes during Ezrin Activation,” FEBS Letters, Vol. 581, No. 18, 2007, pp. 3563-3571. http://dx.doi.org/10.1016/j.febslet.2007.06.071
- L. Zhu, R. Zhu, S. Mettler, T. Wu, A. Abbas, J. Delaney and J. G. Forte, “High Turnover Ezrin T567 Phophorylation: Comformation, Activity, and Cellular Function,” American Journal of Physiology Cell Physiology, Vol. 293, No. 3, 2007, pp. C874-C884. http://dx.doi.org/10.1152/ajpcell.00111.2007
- D. Hanzel, H. Reggio, A. Bretscher, J. G. Forte and P. Mangeat, “The Secretion-Stimulated 80K Phophoprotein of Parietal Cells Is Ezrin, and Has Properties of a Membrane Cytoskeletal Linker in the Induced Apical Membrane,” The EMBO Journal, Vol. 10, No. 9, 1991, pp. 2363-2373.
- R. Zhou, X. Cao, C. Watson, Y. Miao, Z. Guo, J. G. Forte and X. Yao, “Characterization of Protein Kinase A-Mediated Phosphorylation of Ezrin in Gastric Parietal Cell Activation,” The Journal of Biological Chemistry, Vol. 278, No. 37, 2003, pp. 35651-35659. http://dx.doi.org/10.1074/jbc.M303416200
- R. Zhou, L. Zhu, A. Kodani, P. Hauser, X. Yao and J. G. Forte, “Phosphorylation of Ezrin on Threonine 567 Produces a Change in Secretory Phenotype and Repolarizes the Gastric Parietal Cell,” Journal of Cell Science, Vol. 118, No. 19, 2005, pp. 4381-4391. http://dx.doi.org/10.1242/jcs.02559
- V. Fykse, E. Solligård, MØ. Bendheim, D. Chen, J. E. Grønbech, A. K. Sandvik and H. L. Waldum, “ECL Cell Histamine Mobilization and Parietal Cell Stimulation in the Rat Stomach by Microdialysis and Electron Microscopy,” Acta Physiologica, Vol. 186, No. 1, 2006, pp. 37- 43. http://dx.doi.org/10.1111/j.1748-1716.2005.01504.x