Computational Molecular Bioscience
Vol.05 No.03(2015), Article ID:60116,10 pages
10.4236/cmb.2015.53006
A Structural Comparison Approach for Identifying Small Variations in Binding Sites of Homologous Proteins
Ivana Uzelac, Thomas Olsson, Leif A. Eriksson, Johan Gottfries*
Department of Chemistry and Molecular Biology, University of Gothenburg, Göteborg, Sweden
Email: *johan.gottfries@gu.se
Copyright © 2015 by authors and Scientific Research Publishing Inc.
This work is licensed under the Creative Commons Attribution International License (CC BY).
http://creativecommons.org/licenses/by/4.0/


Received 17 August 2015; accepted 27 September 2015; published 30 September 2015
ABSTRACT
A method for analyzing the protein site similarity was devised aiming at understanding selectivity of homologous proteins and guiding the design of new drugs. The method is based on calculating Cα distances between selected pocket residues and subsequent analysis by multivariate methods. Five closely related serine proteases, the coagulation factors II, VII, IX, X, and XI, were studied and their pocket similarity was illustrated by PCA clustering. OPLS-DA was then applied to identify the residues responsible for the variation. By combining these two multivariate methods, we could successfully cluster the different proteases according to class and identify the important residues responsible for the observed variation.
Keywords:
Protein Comparison, Coagulation Factor, Serine Protease, Binding Site, PCA, OPLS-DA

1. Introduction
Drug discovery includes several crucial steps before clinical testing and alluding to an optimal process may render saved time and efforts. Thus identifying and front-loading mitigation of sub-optimal compound properties before clinical phases is highly desirable [1] . Next to lack of efficacy, safety issues are the leading cause for drug rejection in late stage clinical trials which represents an estimated 70% of the total cost for a drugs clinical development [2] -[4] . Drug promiscuity, to some extent, has been correlated to ligand flexibility, although mainly to structural similarity between targets [5] [6] . The problem of structural similarity can furthermore be broken down into two parts, the identification of binding pockets and the aspect of protein similarity. Numerous methods have been developed for identifying druggable targets and predicting their binding pockets. These often involve geometry-based [7] , energy-based [8] ,[7] or physicochemical property-based methods [9] , or a combination of these [10] , and have been reviewed in detail elsewhere [11] [12] . In this study we focus on the issue of structural protein pocket similarity. Early drug target selectivity mitigation by inspection of identified analogue drug targets might provide early compound modification for implementation of more relevant molecular design by ensuing generated information [1] .
There are three key steps involved in similarity searches: representation of the binding site, comparison, and scoring. Since proteins can have varying overall structure and still maintain highly conserved function and binding site composition, such comparative methods usually focus on the binding site and more or less neglect the remainder of the protein [13] . Binding site representation is a crucial step in the process of similarity detection. The representation can for example be made using the atomic position of the Cα carbons of the residues in the site. It can be complemented with the Cβ carbons, and even pseudo atoms representing an amino acid residue. The latter is done in order to incorporate structural information, yet at the same time ensuring a simplified model over the more complex and time consuming inclusion of the exact positions of all atoms in the representative residues. The binding site can moreover be represented by surface patches [14] , pharmacophore features [15] , or by physiochemical properties [16] . A simplified representation of the site is again favorable in order to reduce the complexity of the comparison. In fact, Fleedman and Labute have shown that Cα carbons give adequate information to enable efficient comparison of binding sites and that use of Cβ (and Cγ) carbons generate essentially identical models to this [17] . The use of Cα carbons hence forms the basis of the present study.
Binding site comparison also involves finding the best superposition of the sites involved. This is dependent on how the site is represented, the similarity metric, and the algorithm used for the comparison. Algorithms can for example include alignment methods such as iterative searches [18] , geometric matching [19] , geometric hashing [20] , and clique detection [9] [21] which are not always favorable because of the uncertainty that comes with the alignment. Principal component analysis (PCA) [22] has been used in several fields for interpreting different datasets and analyzing variations in the data. It has also been applied when comparing protein cavities such as in the GRID consensus principal components (GRID/CPCA) approach which does not rely on alignments [23] . GRID/CPCA is applied to improve ligand selectivity towards a particular target by identifying potential modifications in the ligand. However, this similarity based method is dependent on the availability of structural data of proteins with an active molecule present in the cavity. PCA has recently also been implemented to characterize and map the cavities of proteins without ligands present [24] , and to examine the dynamics of cavity geometry evolution by selecting structures from molecular dynamics simulations (MD) [25] , in this way dealing with the protein flexibility issue.
To our knowledge, our current study is the first time orthogonal partial least squares discriminant analysis (OPLS-DA) [26] has been applied to explore binding sites. The present method is intended as an initial step when comparing similar targets, in order to identify even subtle variations in homologous binding sites. To demonstrate the approach, we evaluated coagulation factors II, VII, IX, X, and XI which all share high structural similarity, aiming at discriminating between the different classes. The model is based on calculations of distances between the Cα atoms of selected amino acid residues located in the vicinity of the catalytic site. By applying PCA, the retrieved distance data could be visualized in an easily interpretable fashion separating the protein classes into clusters based on cavity backbone variation. Furthermore, OPLS-DA was implemented to derive more accurate loadings, as compared to the PCA generated ones, in order to identify the specific amino acid residue(s) responsible for the observed clustering in the PCA. Our aim is to develop a method that provides insight regarding similarity between protein cavities in order to guide molecular modeling or drug design based on 3D structures. The strength of the present approach is its straightforwardness regarding both describing and comparing the included target sites, which is of value in the early stage of drug design.
2. Methodology
2.1. Selection of 3D Structures
A set of 86 protein structures of the five coagulation factors II, VII, IX, X, and XI was used in the study as obtained from the Protein Data Bank (www.rcsb.org) [27] and are named according to their PDB codes. These five proteins were mainly selected because of sharing high structural similarity. Structures having a covalently attached ligand were discarded as it could interfere with the calculations. Structures from different organisms; human, bovine, and mouse were included, as well as dimers, trimers, and tetramers. Both apo and holo forms of the enzymes were included (See Table S1, Supporting Information).
2.2. Selection of Amino Acid Residues (AAs)
To incorporate the vicinity of the catalytic site, AAs representing all three binding pockets (S1, S2-Sn, and S1’-S2’) were selected (Figure 1), resulting in a total of seven initial AAs. These include the catalytic triad His57, Asp102 and Ser195 (thrombin numbering), and the aspartate residue Asp189, located at the bottom of the S1 pocket, which is responsible for the specificity of the proteases [28] . These four residues were furthermore complemented by Leu41 located in the S1’-S2’ region, Trp215 in S2 and Tyr228 in the S1 pocket. The selection parameter was set so as to add two AAs before and two after each respective initial residue, e.g., for His57 amino acids 55, 56, and 58, 59 were also included in the distance calculations. This parameter was set in order to sample more of the sites, but one can chose to include as many or as few AAs as desired. In the current study, a total of 35 AAs were thus included, that efficiently span all three regions of the binding pockets.
2.3. Calculation of Distances
The Cα atom coordinates of the selected AAs were obtained from their respective PDB files. The distances between the Cα atoms were calculated in an all-against-all fashion (Figure 2) creating a descriptor matrix (X) with all distances given in Ångström (Å).
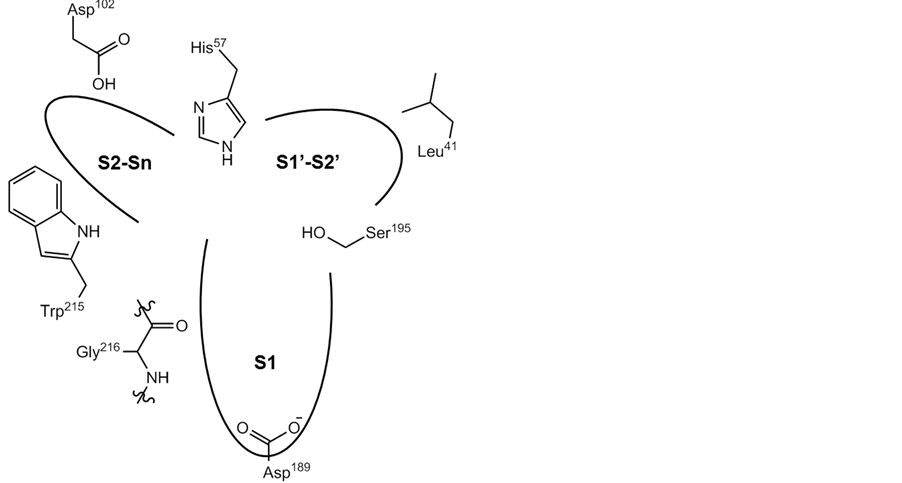
Figure 1. Schematic illustration showing the three pockets of the catalytic site of thrombin (S1, S2-Sn, and S1’-S2’).
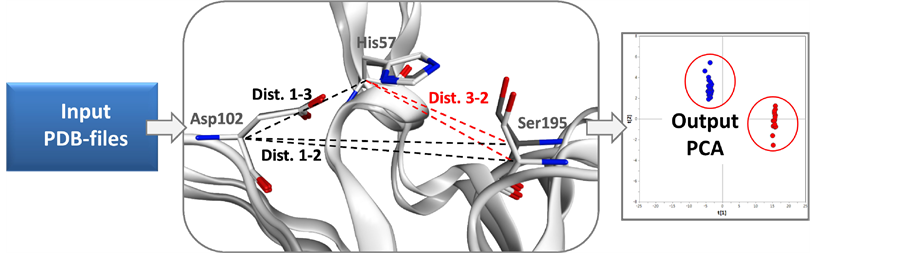
Figure 2. Schematic figure of the protein active site comparison method. Input PDB-files are used for calculating the distances between 3D coordinates of AAs. The difference in distances is illustrated by clusters plotted in a PCA.
2.4. Multivariate Analysis
Principal component analysis (PCA) [29] was used to compress the systematic variation in the descriptor matrix (X), containing N observations (86 protein structures) and K variables (Cα-Cα distances), into two low-dimen- sional matrices T (scores matrix) and P' (loadings matrix), and is generally illustrated according to Equation (1). T is composed of the principal components
 and represents the variation between the different coagulation factors while P' contains the loadings of the components
 and represents the variations in the calculated distances and defines the orientation of the PC plane. In this way the combination of T and P' defines the PC model and the overall variation of the descriptor matrix by orthogonal factors. The residual matrix E, containing noise, is discarded from the PC model.
 (1)
(1)
The first extracted PC accounts for the largest variance in the data. To this, additional PCs are added, orthogonal to the previous, to improve the approximation of the data. Each PC was further evaluated based on its eigenvalue, multiple correlation coefficients (R2), and cross-validation (Q2) [22] .
In order to identify the amino acid residue(s) responsible for the obtained differences in the scores plot, orthogonal projections to latent structures (OPLS) was applied to remove the Y-orthogonal variation from X as described in Equation (2) [30] . TP is the predictive score matrix and
 is the predictive loading matrix for X. The Y-orthogonal score and loading matrices are denoted TO and
 , respectively. E comprises the residual matrix. The method can in our case be defined as OPLS discriminant analysis (DA) because the response vector, Y, was set as a discriminant defining each protease class in order to find the discrimination of that particular class against all others. The model was further evaluated by cross validation after each generated orthogonal component.
 (2)
(2)
All multivariate calculations were performed in the SIMCA 13.0 software [29] [30] . All data was subjected to centering but remained un-scaled before any multivariate calculations.
3. Results and Discussion
3.1. Target Protein Preparation
In the present study a total of 86 protein structures of the five main coagulation factors FII, FVII, FIX, FX, and FXI were analyzed. The protein pockets were sampled by calculating distances between the Cα atoms of selected AAs.
A first PCA including all coagulation factors was calculated, resulting in five main outliers, 3sqe, 3sqh, and the two dimer structures of 2afq, all from FII, and 1jbu from FVII (Figure 3), plus three additionally possible
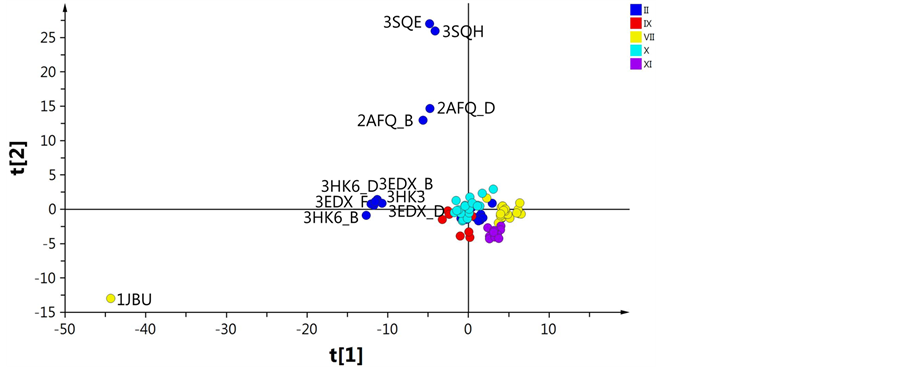
Figure 3. PCA score plot of t1 vs t2 based on distances between the selected AAs. The colors represents the different coagulation factors; II (blue), VII (yellow), IX (red), X (turquoise) and XI (purple).
outliers, 3edx (trimer), 3hk3 (monomer), and 3hk6 (dimer) of FII. By inspection of the loadings, the distances generating the outliers could be explained. For 3sqe and 3sqh the catalytic residue Ser195 was mutated to alanine which gave rise to the deviation [31] . The two dimers structure 2afq were found to be altered in several areas of the protein structure leading to overall structural differences. Taking a closer look at the crystallization data it was found that 2afq was expressed in the absence of coordinating Na+. The Na+ free environment thus induces a conformational change which ultimately blocks the S1 and S2 pockets making it stand out from the proteins expressed in Na+ containing environment [32] . The structure of 1jbu was found to be in complex with the exosite binding inhibitory peptide A-183. This peptide occupies the binding site and thereby alters its structure whereby 1jbu displays large differences in the binding region compared to other serine proteases, in particular in the loop which defines the S1 pocket [33] . The identification of these five outliers was enabled by PCA using data centering without scaling, making it possible to identify deviating data visualized as outliers in the scores plot. To obtain more relevant resolution the five first outliers were excluded from all subsequent calculations. The second PCA was calculated keeping 3edx, 3hk3, and 3hk6 in the model (Figure 4(A)) since they appeared closer to the remaining clusters. These three structures all share the mutations of Trp215 and Glu217 to Ala, which were two of the AAs included in the Cα distance calculations. The mutated structures assume a conformation similar to the inactive form of thrombin recently shown by Gandhi et al., which explains the deviation in the PCA [34] . Removing these from the model (Figure 4(B)) did not result in any significant difference from the previous PCA (Figure 4(A)) with regards to the clustering of the remaining factors. However, in the OPLS scores plot, the structures of FII were divided into two groups where the mutated structures all clustered into one.
3.2. Multivariate Analyses for Protein Cavity Characterizations
The recalculated PCA model, after excluding all above mentioned structures seen as outliers, could successfully identify and cluster the factors by class using a 4-component model (Figure 4(B)). The first component PC1 explained 40% of the data (R2 = 0.40). Four PCs together explained 79% ( ) and the cross-validation, after PC4, gave a cumulative Q2 value of 0.75 (Table 1). The rather small difference between
 and
and
 indicates that the cross-validation was successful since the model was able to accurately predict the missing data.
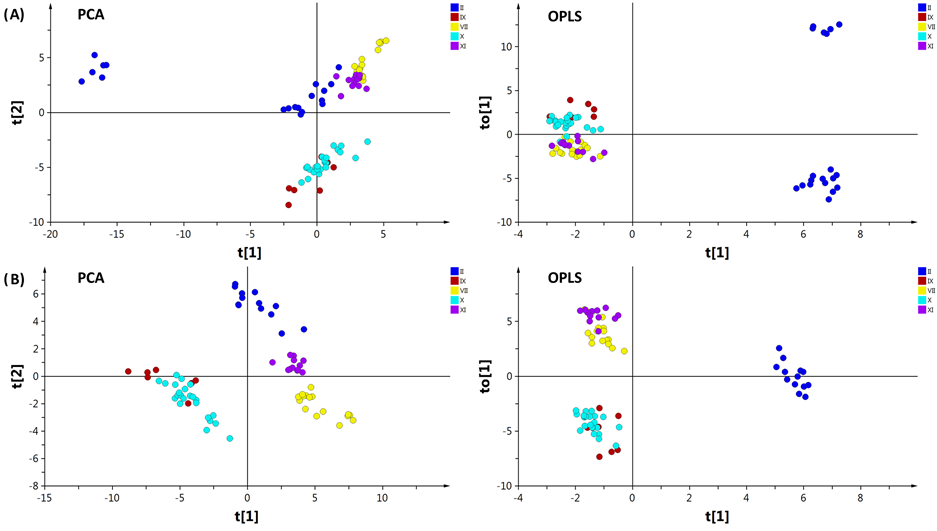
Figure 4. PCA scores plot (t1 vs t2; left) and OPLS scores plot (t1 vs to 1; right) with a FII discriminant Y variable. (A) including 3edx, 3hk3, and 3hk6 which possess a mutation on AAs Trp215 and Glu217 to Ala; (B) excluding 3edx, 3hk3, and 3hk6. The colors represents the different coagulation factors; II (blue), VII (yellow), IX (red), X (turquoise) and XI (purple).
The relatively large eigenvalues further indicate that there was substantial systematic variation present in the dataset. Aside from the clustering of the individual factors there also seems to be a division between two groups (Figure 4) where FIX and FX make up one of the two. Their similarity is described in literature as sharing the same homology with protein C [35] , which explains their resemblance. When inspecting, also the third component of the PCA, further clustering was revealed for all factors, as seen in the 3D scores plot (Figure 5).
In addition to PCA, OPLS-DA was applied to identify unique variations in the distances of the protein binding cavities for each protease class. By removing the non-correlated variation from X the predictive model complexity is reduced which improves the interpretation of the resulting one component giving a more accurate correlation between the factors. All coagulation factors showed to be discriminated mainly by distance variations in the S1 pocket which gave rise to the main variance seen in the original PCA (Figure 4(B)).When assigning FII as the discriminant Y, in addition to S1, variation was also found in the hydrophobic proximal S1’-S2’ pocket (Figure 6). The largest variation obtained from the loadings indicate that residues Glu39 and Leu40 are responsible for the discrimination in S1’-S2’. It was also found that, among others, the distance to His230 in the S2-Sn pocket deviates from the rest of the proteases.
In the case of FIX, the OPLS loadings indicate a variation in loop 2, residue Glu217, as the main contributor to the discrimination of this protein. This agrees with the fact that FIX possesses a glutamate at position 219 in loop 2, close to 217, whereas the other serine proteases have glycine in that same position [36] . Additionally, since this residue (Glu219) is located right at the entrance of the S1 pocket it may very well be the cause of the difference seen in the PCA.
It has earlier been shown by Shirk et al. that FVII differentiates itself from FII and FX in both the S2-Sn and S1’-S2’ pocket [37] , which was also confirmed in this study. FVII contains large distance variation in Asp100, Arg101, Asp102, and Ala104 which are all located in the S2-Sn region, and in Leu41 and Glu39 located in the

Table 1. Statistical values for the first four principal components (PCs)a.
a and
and
 are the cumulated multiple correlation coefficients and cross validations, respectively.
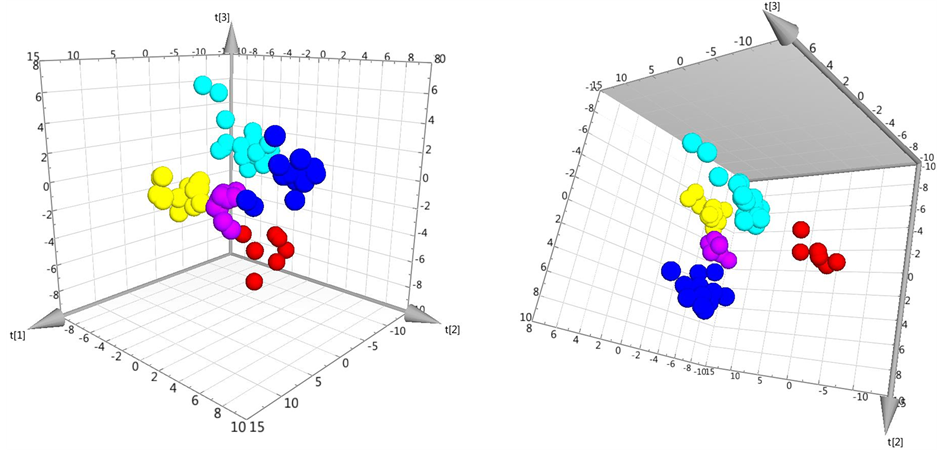
Figure 5. 3D scores plot of the PCA model B, excluding outliers. The coloring schemes are the same as in Figure 3 and Figure 4.
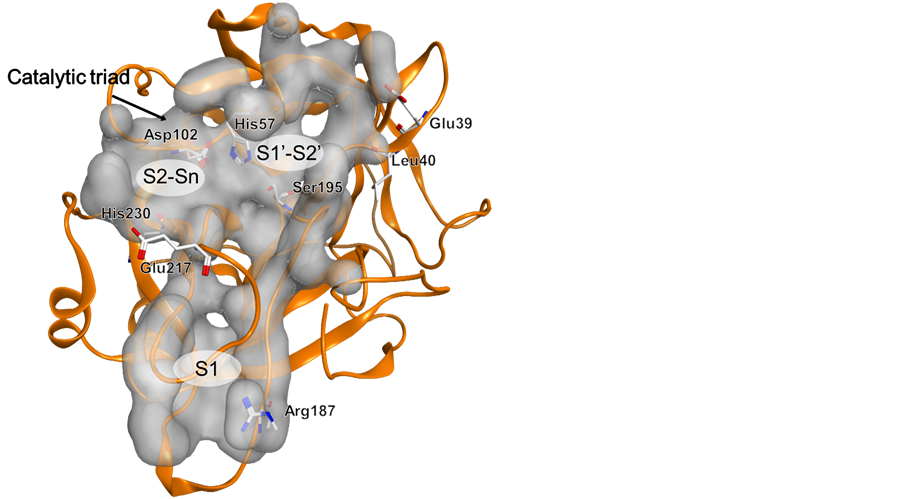
Figure 6. 3D structure of FII (PDB code: 1BCU) showing the catalytic triad His57, Asp102, and Ser195. Amino acid residues Arg187, Glu39, Leu40, Glu217, and His230, responsible for the clustering of FII are shown as well as the three binding sites S1, S2-Sn, and S1’-S2’.
S1’-S2’ region. FX was discriminated in the loop 1 region which constitute parts of the S1 pocket, and in the S2’-Sn’ pocket by the same residues as for FVII. Lastly, FXI also displayed a large region of possible selectivity sites where, aside from the S1 pocket, variations were found in distances located in both the S2-Sn and the S1’-S2’ pockets.
3.3. Method Example Rationale for Early Selectivity Identification
In order to exemplify how one could apply the described approach in drug design based on 3D structures, and achieve drug selectivity, we examine the difference in volumes and side chains of the respective amino acids important for discriminating FII from the rest of the coagulation factors. The most important deviation for FII can be identified as located in the S1 pocket. This appears larger in FII than in the other factors, because Arg187 is located further away from most of the included AAs. This opens up the possibility to design a ligand that reaches further down in the S1 pocket in FII, whereas it would be sterically hindered from binding to the other factors. In addition, residue 39 was identified as a possible “selectivity filter” as it is negatively charged in FII (Glu) as opposite to FXI which has an amino acid with a positively charged side chain (Arg) or VII where a hydrophobic alanine occupies that position. In this case, a ligand with a positively charged group pointing towards Glu39 would provide strong binding in FII. In order to target Leu40 we can consider halogenated ligands, as these have a high propensity to interact with hydrophobic or hydrogen bonding amino acids such as Leu, Phe, Ser and Thr [38] . Based on the above analysis, we have thus very easily identified three possible sites where drug design could be directly applied in order to selectively target FII.
4. Conclusions
PCA and OPLS-DA were applied to analyze the variation between similar protein structures. The approach was able to group the structures into clusters according to the common classifications of serine proteases. Our results show that the Cα coordinates contain sufficient information to distinguish between subtle variations in the proteases with good accuracy. In this case, further details of exact side chain conformation are not needed to make the initial comparison. Adequate information to group the proteases appears to be encoded in the protein backbone as single mutations such as the one of Ser to Ala in 3sqe and 3sqh clearly stand out in the PCA/OPLS analyses. Although this may be seen as a limitation in the sense that the method may be overly sensitive to small variations, it is important to remember that the method is intended for precisely this purpose, namely to identify and expose the smallest variations in structures.
The proposed method complements already existing methods in analysis of closely related binding sites, and at the same time adds the possibility of rapidly and readily identifying residues responsible for variations found in the analysis. The advantage of the present approach is that it can be applied even if only backbone information is available, and since it is a structure based method, it is also independent of the availability of active ligands.
Providing detailed knowledge about variations in cavities can assist when selecting targets for molecular modeling studies or for designing ligands, be it highly selective as well as highly promiscuous compounds, based on 3D structures of targets as herein exemplified. Thus an early intervention, using the present approach for identification of possible compound structure selectivity sources, might provide crucial remuneration during following development drug discovery phases.
Acknowledgements
The Swedish Research Council (VR) and the Faculty of Science at the University of Gothenburg are gratefully acknowledged for financial support.
Cite this paper
IvanaUzelac,ThomasOlsson,Leif A.Eriksson,JohanGottfries, (2015) A Structural Comparison Approach for Identifying Small Variations in Binding Sites of Homologous Proteins. Computational Molecular Bioscience,05,45-55. doi: 10.4236/cmb.2015.53006
References
- 1. Weber, A., Casini, A., Heine, A., Kuhn, D., Supuran, C.T., Scozzafava, A. and Klebe, G. (2004) Unexpected Nanomolar Inhibition of Carbonic Anhydrase by COX-2-Selective Celecoxib: New Pharmacological Opportunities Due to Related Binding Site Recognition. Journal of Medicinal Chemistry, 47, 550-557.
http://dx.doi.org/10.1021/jm030912m - 2. Arrowsmith, J. and Miller, P. (2013) Phase II and Phase III attrition rates 2011-2012. Nature Reviews Drug Discovery, 12, 568-568.
http://dx.doi.org/10.1038/nrd4090 - 3. Giacomini, K.M., Krauss, R.M., Roden, D.M., Eichelbaum, M. and Hayden, M.R. (2007) When Good Drugs Go Bad. Nature, 446, 975-977.
http://dx.doi.org/10.1038/446975a - 4. Pearson, H. (2006) The Bitterest Pill. Nature, 444, 532-533.
http://dx.doi.org/10.1038/444532a - 5. Haupt, V.J., Daminelli, S. and Schroeder, M. (2013) Drug Promiscuity in PDB: Protein Binding Site Similarity Is Key. PLoS ONE, 8, e65894.
http://dx.doi.org/10.1371/journal.pone.0065894 - 6. Sturm, N., Desaphy, J., Quinn, R.J., Rognan, D. and Kellenberger, E. (2012) Structural Insights into the Molecular Basis of the Ligand Promiscuity. Journal of Chemical Information and Modeling, 52, 2410-2421.
http://dx.doi.org/10.1021/ci300196g - 7. Hendlich, M., Rippmann, F. and Barnickel, G. (1997) LIGSITE: Automatic and Efficient Detection of Potential Small Molecule-Binding Sites in Proteins. Journal of Molecular Graphics and Modelling, 15, 359-363.
http://dx.doi.org/10.1016/S1093-3263(98)00002-3 - 8. Laurie, A.T.R. and Jackson, R.M. (2005) Q-Site Finder: An Energy-Based Method for the Prediction of Protein-Ligand Binding Sites. Bioinformatics, 21, 1908-1916.
http://dx.doi.org/10.1093/bioinformatics/bti315 - 9. Schmitt, S., Kuhn, D. and Klebe, G. (2002) A New Method to Detect Related Function among Proteins Independent of Sequence and Fold Homology. Journal of Molecular Biology, 323, 387-406.
http://dx.doi.org/10.1016/S0022-2836(02)00811-2 - 10. Halgren, T. (2007) New Method for Fast and Accurate Binding-Site Identification and Analysis. Chemical Biology & Drug Design, 69, 146-148.
http://dx.doi.org/10.1111/j.1747-0285.2007.00483.x - 11. Jalencas, X. and Mestres, J. (2013) Identification of Similar Binding Sites to Detect Distant Polypharmacology. Molecular Informatics, 32, 976-990.
http://dx.doi.org/10.1002/minf.201300082 - 12. Perot, S., Sperandio, O., Miteva, M.A., Camproux, A.C. and Villoutreix, B.O. (2010) Druggable Pockets and Binding Site Centric Chemical Space: A Paradigm Shift in Drug Discovery. Drug Discovery Today, 15, 656-667.
http://dx.doi.org/10.1016/j.drudis.2010.05.015 - 13. Rosen, M., Lin, S.L., Wolfson, H. and Nussinov, R. (1998) Molecular Shape Comparisons in Searches for Active Sites and Functional Similarity. Protein Engineering, Design and Selection, 11, 263-277.
http://dx.doi.org/10.1093/protein/11.4.263 - 14. Kupas, K., Ultsch, A. and Klebe, G. (2008) Large Scale Analysis of Protein-Binding Cavities Using Self-Organizing Maps and Wavelet-Based Surface Patches to Describe Functional Properties, Selectivity Discrimination, and Putative Cross-Reactivity. Proteins: Structure, Function, and Bioinformatics, 71, 1288-1306.
http://dx.doi.org/10.1002/prot.21823 - 15. Kalliokoski, T., Olsson, T.S.G. and Vulpetti, A. (2013) Subpocket Analysis Method for Fragment-Based Drug Discovery. Journal of Chemical Information and Modeling, 53, 131-141.
http://dx.doi.org/10.1021/ci300523r - 16. Xiong, B., Wu, J., Burk, D.L., Xue, M.Z., Jiang, H.L. and Shen, J.K. (2010) BSSF: A Fingerprint Based Ultrafast Binding Site Similarity Search and Function Analysis Server. BMC Bioinformatics, 11, 47.
http://dx.doi.org/10.1186/1471-2105-11-47 - 17. Feldman, H.J. and Labute, P. (2010) Pocket Similarity: Are Alpha Carbons Enough? Journal of Chemical Information and Modeling, 50, 1466-1475.
http://dx.doi.org/10.1021/ci100210c - 18. Powers, R., Copeland, J.C., Germer, K., Mercier, K.A., Ramanathan, V. and Revesz, P. (2006) Comparison of Protein Active Site Structures for Functional Annotation of Proteins and Drug Design. Proteins: Structure, Function, and Bioinformatics, 65, 124-135.
http://dx.doi.org/10.1002/prot.21092 - 19. Minai, R., Matsuo, Y., Onuki, H. and Hirota, H. (2008) Method for Comparing the Structures of Protein Ligand-Binding Sites and Application for Predicting Protein-Drug Interactions. Proteins: Structure, Function, and Bioinformatics, 72, 367-381.
http://dx.doi.org/10.1002/prot.21933 - 20. Wallace, A.C., Borkakoti, N. and Thornton, J.M. (1997) TESS: A Geometric Hashing Algorithm for Deriving 3D Coordinate Templates for Searching Structural Databases. Application to Enzyme Active Sites. Protein Science, 6, 2308-2323.
http://dx.doi.org/10.1002/pro.5560061104 - 21. Artymiuk, P.J., Poirrette, A.R., Grindley, H.M., Rice, D.W. and Willett, P. (1994) A Graph-Theoretic Approach to the Identification of 3-Dimensional Patterns of Amino-Acid Side-Chains in Protein Structures. Journal of Molecular Biology, 243, 327-344.
http://dx.doi.org/10.1006/jmbi.1994.1657 - 22. Jackson, J.E. (1991) A User’s Guide to Principal Component Analysis. John Wiley & Sons, Hoboken.
http://dx.doi.org/10.1002/0471725331 - 23. Kastenholz, M.A., Pastor, M., Cruciani, G., Haaksma, E.E.J. and Fox, T. (2000) GRID/CPCA: A New Computational Tool to Design Selective Ligands. Journal of Medicinal Chemistry, 43, 3033-3044.
http://dx.doi.org/10.1021/jm000934y - 24. Andersson, C.D., Chen, B.Y. and Linusson, A. (2010) Mapping of Ligand-Binding Cavities in Proteins. Proteins: Structure, Function, and Bioinformatics, 78, 1408-1422.
- 25. Desdouits, N., Nilges, M. and Blondel, A. (2015) Principal Component Analysis Reveals Correlation of Cavities Evolution and Functional Motions in Proteins. Journal of Molecular Graphics and Modelling, 55, 13-24.
http://dx.doi.org/10.1016/j.jmgm.2014.10.011 - 26. Bylesjo, M., Rantalainen, M., Cloarec, O., Nicholson, J.K., Holmes, E. and Trygg, J. (2006) OPLS Discriminant Analysis: Combining the Strengths of PLS-DA and SIMCA Classification. Journal of Chemometrics, 20, 341-351.
http://dx.doi.org/10.1002/cem.1006 - 27. Berman, H.M., Westbrook, J., Feng, Z., Gilliland, G., Bhat, T.N., Weissig, H., Shindyalov, I.N. and Bourne, P.E. (2000) The Protein Data Bank. Nucleic Acids Research, 28, 235-242.
http://dx.doi.org/10.1093/nar/28.1.235 - 28. Prasad, S., Cantwell, A.M., Bush, L.A., Shih, P., Xu, H. and Di Cera, E. (2004) Residue Asp-189 Controls both Substrate Binding and the Monovalent Cation Specificity of Thrombin. The Journal of Biological Chemistry, 279, 10103-10108.
http://dx.doi.org/10.1074/jbc.M312614200 - 29. Wold, S., Esbensen, K. and Geladi, P. (1987) Principal Component Analysis. Chemometrics and Intelligent Laboratory Systems, 2, 37-52.
http://dx.doi.org/10.1016/0169-7439(87)80084-9 - 30. Trygg, J. and Wold, S. (2002) Orthogonal Projections to Latent Structures (O-PLS). Journal of Chemometrics, 16, 119-128.
http://dx.doi.org/10.1002/cem.695 - 31. Pozzi, N., Chen, Z.W., Zapata, F., Pelc, L.A., Barranco-Medina, S. and Di Cera, E. (2011) Crystal Structures of Prethrombin-2 Reveal Alternative Conformations under Identical Solution Conditions and the Mechanism of Zymogen Activation. Biochemistry, 50, 10195-10202.
http://dx.doi.org/10.1021/bi2015019 - 32. Johnson, D.J.D., Adams, T.E., Li, W. and Huntington, J.A. (2005) Crystal Structure of Wild-Type Human Thrombin in the Na+-Free State. Biochemical Journal, 392, 21-28.
http://dx.doi.org/10.1042/BJ20051217 - 33. Eigenbrot, C., Kirchhofer, D., Dennis, M.S., Santell, L., Lazarus, R.A., Stamos, J. and Ultsch, M.H. (2001) The Factor VII Zymogen Structure Reveals Reregistration of Beta Strands during Activation. Structure, 9, 627-636.
http://dx.doi.org/10.1016/S0969-2126(01)00624-4 - 34. Gandhi, P.S., Page, M.J., Chen, Z.W., Bush-Pelc, L. and Di Cera, E. (2009) Mechanism of the Anticoagulant Activity of Thrombin Mutant W215A/E217A. The Journal of Biological Chemistry, 284, 24098-24105.
http://dx.doi.org/10.1074/jbc.m109.025403 - 35. Katayama, K., Ericsson, L.H., Enfield, D.L., Walsh, K.A., Neurath, H., Davie, E.W. and Titani, K. (1979) Comparison of Amino-Acid Sequence of Bovine Coagulation Factor-IX (Christmas Factor) with That of Other Vitamin K-Dependent Plasma-Proteins. Proceedings of the National Academy of Sciences of the United States of America, 76, 4990-4994.
http://dx.doi.org/10.1073/pnas.76.10.4990 - 36. Brandstetter, H., Bauer, M., Huber, R., Lollar, P. and Bode, W. (1995) X-Ray Structure of Clotting Factor IXa: Active-Site and Module Structure Related to Xase Activity and Hemophilia B. Proceedings of the National Academy of Sciences of the United States of America, 92, 9796-9800.
http://dx.doi.org/10.1073/pnas.92.21.9796 - 37. Shirk, R.A. and Vlasuk, G.P. (2007) Inhibitors of Factor VIIa/Tissue Factor. Arteriosclerosis, Thrombosis, and Vascular Biology, 27, 1895-1900.
http://dx.doi.org/10.1161/ATVBAHA.107.148304 - 38. Kortagere, S., Ekins, S. and Welsh, W.J. (2008) Halogenated Ligands and Their Interactions with Amino Acids: Implications for Structure-Activity and Structure-Toxicity Relationships. Journal of Molecular Graphics and Modelling, 27, 170-177.
http://dx.doi.org/10.1016/j.jmgm.2008.04.001
Supporting Information
Table S1: PDB names of proteins used for the distance calculations.
Table S1. Proteins used in the current study.
aCoagulation factor used. bEntry code in the Protein Data Bank.
*Corresponding author.

*Corresponding author.