American Journal of Analytical Chemistry
Vol.09 No.05(2018), Article ID:84833,16 pages
10.4236/ajac.2018.95022
Identification and Structural Characterization of Secondary Degradant of Arformoterol Impurity in LDPE Respules of Arformoterol Tartrate Inhalation Solution
Arun Bhutnar*, Anita Desai, Sachin Khapare, Sonali Vartak, Ajay Pangavhane, Allwyn Andrandes
Formulation Analytical Development Laboratory (FD ADL), Integrated Project Development (IPD), Cipla Ltd, Mumbai, India
![]()
Copyright © 2018 by authors and Scientific Research Publishing Inc.
This work is licensed under the Creative Commons Attribution International License (CC BY 4.0).
http://creativecommons.org/licenses/by/4.0/


Received: March 1, 2018; Accepted: May 25, 2018; Published: May 28, 2018
ABSTRACT
Arformoterol (R, R) is an enantiomer of racemic formoterol, was the first long-acting beta agonist (LABA), approved by U.S. food and Drug Administration (FDA). The Arformoterol which is used for the treatment of Chronic obstructive pulmonary disease (COPD) are inhaled bronchodilator drugs which are delivered directly to the patient’s airways through a different mechanism. The formulated drug product is kept for stability study as per ICH guideline [1] and during its stability interval analysis by HPLC (High performance liquid chromatography), an unknown peak observed at level around 0.1% which is well below the identification threshold of 0.5% but after heating it crossed the identification threshold. The approach to identify anonymous species of Arformoterol aqueous formulation was adopted as first to generate the impurity in sample, isolate, enrich and Characterize through LC-MS/MS and NMR Spectroscopy. Based on the spectral data the anonymous species was identified as an “Imine impurity”, it is secondary degradant of Amine impurity of Arformoterol formed due to reaction with leachable observed in LDPE respules.
Keywords:
Arformoterol, Imine Impurity, Stability Study, LC-MS/MS, NMR, Secondary Degradation, Leachable

1. Introduction
Arformoterol was the first long-acting beta agonist (LABA) approved by the US Food and Drug Administration (FDA) for nebulized delivery. Arformoterol is packaged as an inhalation solution in 15 mcg/2 ml was filled in the respules. The respules are manufactured from Low density polyethylene (LDPE). Low density polyethylene is produced by the polymerization of ethylene at high pressure and temperature. The material is semicrystalline-crystalline. The crystallinity level is low because of chain branching [2] . The material is tough but possesses moderate tensile properties and exhibits creep. However, it has good impact and chemical resistance. It is an easy flow material because of long chain branching (Figure 1). LDPE is permeable to gases and vapours [3] .
The formaldehyde is generated during manufacturing of Low Density Polyethylene (LDPE) because of multiple technologies are involved, the widely High Pressure Process (HPP) is used which involves uses of peroxide catalyst at 100˚C - 300˚C and produces low density polymer which has a low melting point. The process is run at pressure of 1000 - 2500 atms. This process yields (LDPE). The “high pressure” polyethylene shows a higher melt flow index (MFI) and therefore, processes easier than most other types of polyethylene [4]
The formaldehyde can be liberated through the manufacturing procedure for LDPE (Low Density Polyethylene) in the melt of thermoplastics which comprises small admixtures of polyacetal. Even small amounts, e.g. less than 0.5% by Weight, of polyacetal in the main plastic can be sufficient to liberate undesirable concentrations of formaldehyde. It is well known that polyacetals can decompose thermally during processing in the melt, thus liberating formaldehyde. High processing temperatures above 230˚C and long residence times accelerate the degradation [5] [6] . In addition to the above factors there is one more possibility to generate the formaldehyde when the polyacetals can react with acidic compounds, additives, catalyst residues, etc., with the liberation of formaldehyde.
During this process, formaldehyde emission deriving from decomposition of the polyacetal is markedly reduced by adding suitable additives/stabilizers. The formaldehyde liberated from the LDPE process reacts with Amine Impurity of Arformoterol which results Imine product in presence of aqueous formulation the final product formed in this process also known as Schiff’s base [7] [8] .
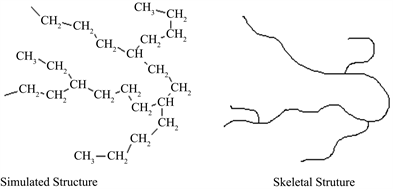
Figure 1. Structure of LDPE which shows the highly branched molecular structure of low density polyethylene.
Impurity profiling of pharmaceutical active ingredients is an essential part of the research and developmental cycle. Regulatory agencies consider impurity profiling critical to ensure safety and efficacy of pharmaceutical dosage forms. The impurities observed in a drug substance or a drug product need to be identified when their levels exceed certain regulatory thresholds with respect to their maximum daily dose [9] [10] .
The impurities are originating from the drug substance or drug product most commonly within the synthetic or manufacturing process or degradation [11] , Moreover the impurities can be formed due to secondary degradation of impurity due to leachable coming from packaging material. Further to identify the impurity is difficult due to low level of the impurity concentration exhibit poor UV spectra quality [12] . The utilization of UV or PDA data alone for impurity analysis is inadequate. The stereochemistry of the compounds adds a common challenge with impurity profiling, Isolation of impurities at such minute amount can be extremely tedious, time consuming, and difficult. Hence mass spectrometry plays a central role in our approach rather than the use of only ultra-violet detection.
For identification of an unknown species, we have developed an approach that combines degradation studies, isolation and enrich the impurity and subjected to NMR, UV and mass spectroscopy to elucidate the structure of unknown impurity. Based on the fragmentation pathways by LC-MS/MS analysis the relevant degradation mechanism is designed. Then it is subjected to HPLC with Photo-Diode-Array (PDA) detector to estimate the quantity and observe the PDA Scan.
Typically, a stress study (or forced degradation) is carried out using acid, base, heat, oxidation, reduction and photo-irradiation, etc. Frequently, the very fact that a degradant can be generated from a stress study would verify the degradation mechanism, from which the structure of the unknown degradant may be inferred with high confidence level. In such cases the NMR spectroscopy is used to confirm the structure deduced from the outcome of the LC-MS/MS analysis and forced degradation study.
2. Experimental
2.1. Materials and Reagent
The chemicals and reagents used for the analysis and synthesis purpose of Arformoterol and Secondary degradant:
Acetonitrile (HPLC grade), Supplier: Rankem, Avantor performance material Ltd, India; Acetonitrile (LCMS grade), Supplier: Biosolve Chimie SARL, France, Water: Highly pure Milli Q water was used with the help of Millipore Milli-Q plus purification system, Arformoterol active pharmaceutical ingredient, Source: manufactured by Farmabios Italy, Arformoterol Tartrate Respules, Source: manufactured by Cipla Ltd India, Amine Impurity, Source: Cipla Ltd India. Sodium dihydrogen phosphate monohydrate (GR grade), Supplier: merck, Disodium Hydrogen Phosphate Dihydrate (GR Grade), Supplier: Merck, Orthophosphoric acid (OPA) (AR grade), Supplier: Rankem Ammonium formate (AR grade), supplier: Merck, Formic Acid (AR grade), Supplier: Merck.
2.2. High Performance Liquid Chromatography
The HPLC analysis was performed on Agilent 1260 series equipped with PDA detector. The HPLC separation was carried out on a Zorbax SB C8 4.6 mm × 150 mm, 5 µ column at ambient temperature with 200 µl injection volume for a sample concentration of 7.5 mcg/mL. Autosampler temperature at 5˚C using a mobile phase system consisting of Mobile phase A ,Buffer (dissolve 3.73 gm of sodium dihydrogen phosphate monohydrate, dissolve in 1000 ml of water and mix, adjust the pH of the solution to a about 3.1 with orthophosphoric acid) and B, acetonitrile with a flow rate of 1.0 mL/min and a gradient program varied according to the following program: 0 minutes (16% B), 10 minutes (16% B), 22 minutes (75% B), 25 minutes (16% B), 35 minutes (16% B) with detector wavelength at 214 nm.
2.3. Liquid Chromatography―Time of Fight (Tof) Mass Spectrometry
The LC-MS/MS analysis was performed on a waters Xevo QT of mass spectrometer interfaced to waters Acquity UPLC equipped with a UV detector. The sample were injected as such with concentration∼7.5 ppm. The separation was carried out on a Zorbax SB C18 (50 × 4.6) mm, 3.5 um column at 45˚C temperature with 20 μl injection volume, using a mobile phase system consisting of 0.63 gm ammonium formate in distilled water pH 3.5 with formic acid A, and B, Acetonitrile: distilled water (600:400 v/v) with a flow rateof 0.5 mL/minutes and a gradient program varied according to the following program:
0 minutes (2% B), 15minutes (2% B), 25 minutes (30% B), 30minutes (2% B), 40 minutes (2% B). The LC flow for the mass spectrometer was split at a ~60:40 ratio after the UV detector; about 400 μL/minutes of the LC flow was directed into the MS detector. UV spectrum was collected at 215 nm. The QT of mass spectrometer was operated at positive V electrospray mode with the following source parameters: cone gas 10 L/hr, desolvation gas 1000 L/hr, source temperature 120˚C, desolvation temperature350˚C, capillary voltage 3 Kv, sampling cone 25˚C and extraction cone 4.0. The time-of-flight (TOF) MS analyzer was operated with ∼4000 full width half maximum resolution and was calibrated externally with a sodium iodide solution. Spectra were acquired at 1 scan/s scan rate and 0.1 s inter-scan time.
2.4. Synthesis of Unknown Degradant at RRT (Relative Retention Time) about 0.52
Weighed about 100 mg of Amine impurity of Arformoterol with added 1 ml aqueous formaldehyde and 10 ml each Acetonitrile and Methanol in to 100 ml round bottom flask (RBF) then heated the solution at 50˚C for 16 hours then resultant reaction mass concentrated and further extracted in methylene dichloride (MDC) and water; the organic layer was separated by separating funnel. The MDC layer was concentrated under vacuum on rota-evaporator for evaporation of solvents, furtherer the solid stick on wall of RBF was strip with n-heptane for free solid.
2.5. In-Situ Generation of Unknown Impurity
The Arformoterol Tartrate Inhalation sample solution heated with 60˚C for 4 hours with addition of small amount of aqueous solution of formaldehyde in solution, and after 6 hours subjected to LCMS for molecular weight determination and injected to HPLC for PDA scan and quantitation of impurity and amine impurity of Arformoterol already present in sample solution.
2.6. Unknown Impurity Characterization by NMR
The 1H and 13C NMR spectra were performed on Varian spectrometers operating at 500 MHz at 25˚C using deuterated solvent DMSO-d6 with Tetra methyl silane as an internal standard. The Samples were prepared in DMSO-d6 and CDCl3 in concentration of ∼1 - 2 mg/mL. 2D g COSY experiment was performed in a magnitude mode with gradient selection method. The H1 chemical shift values were reported on the δ scale in ppm, relative to Tetra methyl silane (δ = 0.0 ppm). The sample was prepared in DMSO in concentration of ∼2 mg/ml.
2.7. Unknown Impurity Characterization by FTIR
The FTIR spectrum of secondary degradant of amine impurity of Arformoterol was recorded on the Thermo Nicolet iS10 model FTIR. Place around 2 mg of sample on sample holder and recoded the spectrum with blank correction.
2.8. Toxicological Evaluation by DEREK Nexus and CASE Ultra Software
No direct toxicological data is available on public domain for the identified impurity.
Evaluation of secondary degradant was done on Derek Nexus: 6.0.1, Nexus: 2.2.1, an expert knowledge based SAR program which contains expert rules (derived from public and proprietary data) in toxicology and CASE Ultra 1.6.2.3 which is a statistical based software applies the rules to make predictions about the toxicity of chemicals, which are the widely-respected and accepted for the assessment of mutagenicity and carcinogenicity has yield following outputs for Arformoterol and unknown impurity:
1) Carcinogenicity in human is EQUIVOCAL
2) Hepatotoxicity in human is PLAUSIBLE
3) Skin sensitisation in human is PLAUSIBLE
All the Toxicological alerts observed for unknown impurity is same as mother molecule Arformoterol.
3. Results and Discussion
3.1. Impurity Identification by LC-MS/MS and HPLC-PDA
The anonymous species at retention time ∼5.7 minutes (RRT ∼0.52) (Figure 2(a)) was observed in Arformoterol Tartrate Inhalation drug product ∼ 0.1% well below the threshold of 0.5%. The impurity was observed ∼1.6% after exposure to 40˚C for 4 days of as such as sample solution when it was analysed by a compendial method. It was clear from the LC-MS/MS spectral observation the RRT about 0.52 peak is a related to Arformoterol. The UV spectrum of Arformoterol showed a maximum absorbance band at 193 nm, 214 nm, 245 nm fourth maxima is at 282 nm, the third and fourth maxima are due to the phenolic and formamide functional group present in Arformoterol. While the impurity peak showed a markedly different UV spectrum, the two new absorbance bands are appearing at ∼225 nm and ∼296 nm respectively. The UV maxima at ∼245 nm bands of Arformoterol shift to 225 nm due to absence of carbonyl group and one more new band at ∼296 nm are due to imine functional group which is attached to benzene ring (data not shown).
In the MS spectrum of Arformoterol showed protonated (m/z 345) molecular ions (Figure 2(c)), MS spectrum of Amine impurity of Arformoterol showed (m/z 317) molecular ions (Figure 2(e)), and impurity at RRT about 0.52 showed (m/z 329) (Figure 2(g)).Further Arformoterol is fragmented in positive potential for structure elucidation, were several fragments ions produced of the protonated molecular ion (Figure 2(d)), including m/z 327 (loss of H2O), m/z 179 (loss of CH3CH2CH2CH), m/z 149 (loss of CH3CH2CO2H and H2O), m/z 134 (loss of H2O, CH3CH2CO2H and H2O), m/z 121 (loss of H2O, CH3CH2CO2H and 2H2O) (Scheme 1) and Amine Impurity shows fragments including m/z 299 (loss of H2O), m/z 149 (loss of CH3CH2CO2H and H2O), m/z 134 (loss of H2O, CH3CH2CO2H and H2O), m/z 121 (loss of H2O, CH3CH2CO2H and 2H2O) (Figure 2(f)). Moreover the unknown species shows several fragments ions produced of the protonated molecular ion including m/z 311 (loss of H2O), m/z 163 (loss of CH3CH2CH2CH), m/z 149 (loss of CH3CH2CO2H and H2O), m/z 121 (loss of H2O, CH3CH2CO2H and 2H2O) (Figure 2(h)). The above mass spectroscopic study divulges that the unknown species has a chemical formula of C19H24N2O3 (Table 1), same masses were confirmed by negative potential also (data not shown). These mass spectroscopic data clearly suggested that an unknown impurity at RRT about 0.52 is a degradant of amine impurity of Arformoterol. Since Arformoterol and Amine impurity shows the maximum absorbance at ∼214 nm is due to the characteristic conjugated phenol, the impurity at RRT about 0.52 is formed due to the reaction of primary amine and formaldehyde and forms Imine (Schiff’s base) which clearly indicated in UV spectra (data not shown) outlined in Scheme 2.
We investigate the presence of this impurity by comparing with multiple lots of reference listed drug (RLD) with near expiry in addition to the characterization of this impurity (secondary degradant).
 (a)
(a)
 (b)
(b)
 (c)
(c)
 (d)
(d) (e)
(e) (f)
(f) (g)
(g)![]() (h)
(h)
Figure 2. (a) Overlaid chromatograms of formaldehyde spiked and unspiked Test product samples; (b) Overlaid chromatograms of formaldehyde spiked and unspiked Reference product; (c) MS spectra of Arformoterol; (d) Fragmentation pattern of Arformoterol; (e) MS spectra of Amine Impurity; (f) Fragmentation pattern of Amine impurity; (g) MS spectra of Secondary degradant at RRT about 0.52 and (h) fragmentation pattern of Secondary degradant at RRT about 0.52 respectively.

Table 1. Accurate mass measurement results of unknown species.
![]()
Scheme 1. Fragmentation pathways of Arformoterol.
The findings of an investigation study confirm that the test method for related substances is capable of detecting the secondary degradation product at RRT of about 0.52. The identity of the impurity at RRT about 0.52 as secondary degradation product of Amine impurity and formaldehyde was confirmed by spiking Test and Reference listed drug samples with formaldehyde followed by exposure to 40˚C for 4 days; the resultant samples were then tested for related substances and the chromatograms compared against those of unspiked samples. From the overlaid chromatograms (Figure 2(a) and Figure 2(b)) in the samples spiked with formaldehyde, it can be seen that the peak due to amine impurity “disappeared” with a corresponding significant increase in impurity at RRT about 0.52 thereby indicating that the unknown impurity is a degradation product of amine impurity of Arformoterol and formaldehyde. The method validation study demonstrates a RRF value of 1.3 for impurity at RRT about 0.52 (data not shown). Moreover, all the results for impurity at RRT about 0.52 calculated with RRF of 1.3 were well below the qualification threshold of 1.0%.
3.2. Degradation Study Based on LC-MS/MS Results
To test the above proposition the impurity at RRT about 0.52 was isolated by HPLC discussion outlined in sec 2.4 the possible formation mechanism of the unknown species, was found that the unknown peak was observed only when after exposure to 40˚C for 4 days of as such as sample solution the sample solution was exposed to heat in presence of formaldehyde.
Mechanism: when Amine impurity is treated with Formaldehyde then the
![]()
Scheme 2. Imine impurity.
loan pair of electrons of Nitrogen is attacked d to carbonyl carbon of formaldehyde and then undergoes phenyl amino alcohol intermediate, further the hydroxyl group accepts proton from acid leaves with water molecule by forming double bond of nitrogen loan pair with carbon. Further the base is abstract proton from Nitrogen and gives stable product (Schiff’s Base) outlined in Scheme 2.
3.3. Preparation of Secondary Degradant
Based on the results for the multiple lots of the RLD and with due consideration to the ICH qualification threshold of 1.0% considering the maximum daily dose, a limit of 0.5% is proposed for this secondary degradation product to be controlled as a impurity at RRT about 0.52 at release and stability. The proposed impurity limit corresponds to an exposure of 0.15 mcg/day considering the maximum daily dose of 30 mcg for Arformoterol Tartrate Inhalation Solution. We therefore believe that the proposed limit of 0.5% for impurity at RRT about 0.52 is considered to be associated with a negligible risk.
The impurity preparation discussion outlined in sec 2.4 was performed; this strategy is planned for generation of an unknown impurity at RRT about 0.52 under Heat. The chromatograms obtained from HPLC analysis of sample before and after the Heat in presence of Formaldehyde are shown in (Figure 2 (a) and Figure 2(b)). An unknown species in sample clearly appeared ∼1.5% yield after the 4 days Heat at 40˚C for in presence of formaldehyde (Figure 3). The mass and UV spectrum of species generated shows different UV spectrum due to Imine functional group with that of Arformoterol and Amine Impurity observed in sample solution (data not shown). The unknown impurity prepared (outlined in sec 2.4) and spiked with the sample which was exactly co-eluted with the retention time of unknown impurity in sample, which shows same mass and UV spectrum (data not shown).
The secondary degradant of Arformoterol generated from the temperature study was synthesised and then characterized by UV spectra, NMR and mass spectroscopy.
3.4. Characterization of Unknown Impurity by NMR
An unknown impurity formed due to Amine impurity of Arformoterol with formaldehyde discussion outlined in sec 2.4 and 2.5. The NMR spectra of the unknown species were confirmed that it is indeed Imine impurity (Scheme 3). Which is a Schiff’s base formed due to the primary amine reacts with aldehyde or ketone. In a separate study, the singlet signal at δ = 8.964 ppm suggested the attribution of the proton of the CH = N group (Figure 4(a)) [13] [14] .
1H NMR spectrum of Impurity at RRT about 0.5 (Figure 4(a)), C13 NMR spectrum Imine impurity (Figure 4(b)) and 1H NMR spectrum of Arformoterol (Figure 4(c)). The spectrum was obtained on the CDCl3 solution of the synthetically prepared compound on a Varian 500 spectrometer operating at a proton frequency of 500 MHz. It was found that Amine impurity of Arformoterol into Imine impurity (Figure 4(a)).
For comparison, the NMR data (Figure 4(a) and Figure 4(c)) for Arformoterol relevant for assignment of the structure of Imine impurity is reported here.
![]()
Figure 3. UV 214 nm chromatograms of Arformoterol sample which shows impurity at RRT about 0.52 about 1.5% after heating at 4 days at 40˚C.
![]() (a)
(a)![]() (b)
(b)![]() (c)
(c)
Figure 4. NMR spectrum: A plot of chemical shift in ppm (x-axis) versus signal intensity (y-axis).
![]()
Scheme 3. Imine Impurity.
Arformoterol: HPLC: RT 11.5; MS: 345 [M+H]+; 1H NMR (500 MHz, CDCl3), δ 1.31 (d, 3H, H-23); 2.87 - 3.4 (m, 4H, H13, 16); 3.62 (m, 1H, H-15); 3.84 (s, 3H, H-25); 4.50 (s, 2H, 27a and 30a); 4.94 (m, 1H, H-11); 3.97 - 7.03 (m, 3H, H-5, 19, 21); 7.15 - 7.25 (d, 3H, H-6, 18, 22); 7.70 (s,1H, H-3); 8.34 (s, 1H, H-9) (Figure 4(c)), (Scheme 4).The singlet at δ 8.34 ppm of aldehydic proton which disappear in the secondary degradant.
Secondary Degradant (1H NMR): HPLC: RT 5.7 min; MS: 329 [M+H]+; 1H NMR (500 MHz, CDCl3), δ 0.9 (d, 3H, H-23); 2.3 (dd, 2H, H-16); 2.8 (t, 1H, H-10); 2.9, (dd, 2H, H-13); 3.7 (s, 3H, H-24); 4.29 (br p 1H, H-5); 4.35 (m, 1H, H-15); 4.6 (d 1H, H-2); 6.2 - 6.3 (d 1H, H-20,21);6.6 (d 2H, H-18, 19); 6.6 - 6.8 (d, 2H, H-12, 9); 7.1 (d 1H, H-11); 8.79 (2H, H-22)(Figure 4(a)).
Secondary Degradant (13C NMR): HPLC: RT 5.7 min; 13C NMR (500 MHz, CDCl3), δ 14.2 to 66.78( due to aliphatic carbons); 111 to 143 (due to all aromatic carbons); 157.7(due to imine carbon) the value at δ 157.7 ppm is a characteristic signal of carbon of imine functional group (Figure 4(b)).
The 1H NMR spectrum lacks the signals at 8.34 (protons of carbon no.22) of the parent drug (Scheme 3) and shows new singlet at 8.79 ppm which is due to the conversion of primary amine Arformoterol amine impurity to Imine due to the interaction with formaldehyde, (Scheme 2). Additionally, in the 13C NMR spectra of Imine impurity shows signal at 157.77 ppm which attributes to carbon of imine functional group. The molecular weight is also shows difference of 16(da) is due to absence of oxygen in the secondary degradant, moreover the amine impurity and impurity shows difference of (12Da) which due to addition of carbon with loss of 2 protons of amine.
3.5. Characterization of Unknown Impurity by IR-Spectroscopy
IR spectra have traditionally been interpreted by assigning absorption that fall in particular frequency ranges to specific functional group approach to spectral interpretation. Thus, the absorption bands for synthesized unknown impurity (Scheme 3) shown at 3501.92 cm−1 is attributed to O-H stretching, bands at 2954.04 and 2918.49 cm−1 attributed toto -C-H stretching (aromatic), bands at 2848.88 cm−1 attributed to -CH3 stretching (aliphatic), and bands at 1708 cm−1 is due to C=N- stretching (Imine functional group),bands at 1731.19 cm−1 is due to C=O stretching, bands at 1463.07 and 1472.71 cm−1 is due to Aliphatic -C-H Bending, bands at 1178.56 cm−1 is due to -C-O Stretching, bands at 1061.86
![]()
Scheme 4. Arformoterol.
and 1091.78 cm−1 is due -C-N Stretching, bands at 719.48 and 730.09 cm−1 Aromatic -C-H bending.
On the basis of the above spectral data, secondary degradant of Amine impurity of Arformoterol is derived from a well-known reaction between primary amine with formaldehyde or ketone gives Schiff’s base in presence of base (Scheme 3) to give the so called Imine product [15] [16] .
3.6. Toxicological Interpretation of the Impurity
The toxicological assessment on Derek Nexus: 6.0.1, Nexus: 2.2.1 an expert knowledge based and CASE Ultra 1.6.2.3 an Expert rule based SAR programme discussion outlined in section 2.8 was performed. The outputs observed for Imine impurity are concordant with those observed for Arformoterol and is controlled by taking adequate measures.
4. Conclusion
A secondary degradant 4-((R)-1-hydroxy-2-(((R)-1-(4-methoxyphenyl) propan-2-yl) amino) ethyl)-2-(methyleneamino) phenol at RRT about 0.52 can be formed slowly over the course of long-term storage from reaction of Amine impurity of Arformoterol {l-(3-Amino-4-hydroxyphenyl)-2-[[2-(4-Methoxyphenyl)-l-methylethyl] amino] ethanol} and formaldehyde, which can be termed as Imine impurity.
Cite this paper
Bhutnar, A., Desai, A., Khapare, S., Vartak, S., Pangavhane, A. and Andrandes, A. (2018) Identification and Structural Characterization of Secondary Degradant of Arformoterol Impurity in LDPE Respules of Arformoterol Tartrate Inhalation Solution. American Journal of Analytical Chemistry, 9, 286-301. https://doi.org/10.4236/ajac.2018.95022
References
- 1. (2003) ICH Topic Q 1 A (R2) Stability Testing of New Drug Substances and Products. FDA, US-Federal Register Vol. 68, 65717-65718, Swissmedic.
- 2. Bronzino, J.D. (2000) The Biomedical Engineering Handbook. 2nd Edition, Boca Raton.
- 3. Crawford, R.J. (1993) Rotational Moulding. Manufacturing Processes. Smithers Rapra Publishing, The Queen’s University of Belfast, Belfast,
- 4. European Commission (2007) Reference Document on Best Available Techniques in the Production of Polymers August 2007. http://eippcb.jrc.ec.europa.eu/reference/BREF/pol_bref_0807.pdf
- 5. Polycarbonate, Polyacetale, Polyester, Celluloseester Kunstst Off-Handbuch 3/1. Technische Thermoplaste Herausgegeben von Gerhard W. Becker, Dietrich Braun, Ludwig Bottenbruch 06/1992547 Seiten. Fester Einband.http://www.hanser-fachbuch.de/buch/Polycarbonate+Polyacetale+Polyester+Celluloseester/9783446163683
- 6. Hanser, C. (1992) Polycarbonates, Polyacetals, Polyesters, Cellulose Esters. Verlag Munich, Vienna.
- 7. Worku, D., Negussie, M., Raju, V.J.T., Theodros, S. and Jonson, J.A. (2002) Bull. Chem. Soc. Ethiop., 29.
- 8. Xavier, A. and Shrividhya, N. (2014) Synthesis and Study of Schiff Base Ligands. IOSR Journal of Applied Chemistry, 7, 6-15. https://doi.org/10.9790/5736-071110615
- 9. (2008) ICH Harmonised Tripartitie Guideline, Impurities in New Drug Substances, Step4 Version, Dated 25 October 2006. FDA, US-Federal Register, Swissmedic.
- 10. ICH Harmonised Tripartitie Guideline, Impurities in New Drug Products, Step 4Version, dated 2 June 2006.
- 11. Davies, A., Jones, M.D., Marsden-Edward, E., Josecastro-Parez, Plumb, R.S. and Shockcoor, J. (2007) An Automated Approach for Pharmaceutical Impurity Profiling Waters Corporation, Manchester UK. Waters Corporation, Milford.
- 12. Potts, W. and Jones, M. (2007) Identification of the Impurities of Budesonide using Small Particle Liquid Chromatography and Q-TOF Mass. Robert Plumb Waters Corporation, Milford.
- 13. Mobinikhaledi, A., Forughifar, N. and Kalhor, M. (2010) An Efficient Synthesis of Schiff Bases Containing Benzimidazole Moiety Catalysed by Transition Metal Nitrates. Department of Chemistry, University of Arak, Arak.
- 14. Hussain, Z., Ahmed, E.Y.A. and Hussain, A.A., et al. (2014) Synthesis and Characterization of Schiff’s Bases of Sulfamethoxazole. Organic and Medicinal Chemistry Letters, 4, 1. https://doi.org/10.1186/2191-2858-4-1
- 15. Jang, S. (2011) The Synthesis and Characterization of Novel Imino Stilbenes. This Research Is a Product of the Graduate Program in Chemistry & Biochemistry at Andrews University.http://digitalcommons.andrews.edu/cgi/viewcontent.cgi?article=1011&context=honors
- 16. Feringa, B.L. and Jansen, J.F.G.A. (1988) A New Synthesis of Imines via Grignard and Cuprate Additions to N-Trimethylsilylformamides. Synthesis-Stuttgart, 1988, 184-186. https://doi.org/10.1055/s-1988-27507