American Journal of Analytical Chemistry
Vol. 4 No. 7 (2013) , Article ID: 34547 , 5 pages DOI:10.4236/ajac.2013.47043
FTIR-ATR and Multivariate Calibration for the Prediction of Biodiesel Concentration in Petrodiesel Blends*
1Colegio de Postgraduados, Campus Tabasco, Periférico Carlos A. Molina s/n, Cárdenas, México
2Facultad de Química, Universidad Autónoma del Carmen, Col. Benito Juárez, Ciudad del Carmen, México
3Colegio de Postgraduados, Campus Córdoba, Carretera Fed. Córdoba-Veracruz km 348, Amatlán de los Reyes, Veracruz, México
Email: #fanguebes@pampano.unacar.mx
Copyright © 2013 A. Guerrero et al. This is an open access article distributed under the Creative Commons Attribution License, which permits unrestricted use, distribution, and reproduction in any medium, provided the original work is properly cited.
Received April 30, 2013; revised June 2, 2013; accepted June 30, 2013
Keywords: African Palm; FTIR-ATR Chemometric Tools; Partial Least Squares Regression; Petrodiesel-Biodiesel Blends
ABSTRACT
The increasing use of petrodiesel-biodiesel fuel blends throughout the world requires fast, economic and efficient analytical techniques that can be used for the quality control of these fuels. In this work, we developed an analytical method for determining the concentration of African palm biodiesel in blends with petrodiesel; the method is based on infrared spectroscopy (FTIR-ATR). To build a prediction model, nineteen petrodiesel-biodiesel blends were prepared in triplicate with biodiesel concentrations for 0% - 100% by weight. The blends were analyzed using Fourier transform infrared spectroscopy, the spectral fingerprint data were used to build a prediction model through PLS regression. The optimal number of principal components (PCs), the standard error of calibration (SEC), the standard validation error (SEV), the correlation coefficient of calibration (r Cal) and the validation correlation coefficient (r Val) were used to validate the predictive ability of the model. The results show that the model obtained in this work has a good ability for determining the concentration of African palm biodiesel in petrodiesel-biodiesel blends.
1. Introduction
At present, most of the world’s energy consumption comes from oil, coal and natural gas, but these sources are limited because of their fossil origin, and it is a fact that they will be depleted in the near future. Therefore, it is essential to find alternative energy from renewable sources. Biodiesel has a promising potential as an alternative energy source. First, biodiesel represents a strategic renewable energy source that can replace diesel oil; second, biodiesel may be useful for reducing the emission of greenhouse gases [1]. It has been established that the combustion of diesel oil by engines produces mixtures of anhydride pollutants (COx, SOx and NOx), solid particles and unburned hydrocarbons that generate multiple environmental and health problems and contribute to global warming and the formation of acid rain [2-4].
Recent studies have shown that the use of petrodieselbiodiesel blends in combustion engines reduces the emission of pollutants, particularly of carbon dioxide. These blends are currently used in different proportions in biodiesel. The United States, Germany, France, Italy, Spain, Brazil, and others, commonly use blends of 98% - 2%, 85% - 15% and 80% - 20% petrodiesel-biodiesel [5].
Worldwide, the cultivated area of African palm (Elaeisguineensis Jacq) is increasing rapidly due to the growing demand for oil for the manufacture of biofuels. The African palm produces 5.5 tons of oil per·ha−1 [6], therefore, the African palm represents potential resources for the synthesis of biodiesel; currently 26% of the oil produced in the world comes from the African palm, but that proportion continues to increase [7].
The United States consumed 1.135 × 10⁸ L of biodiesel in 2004, while the European Union consumed 9.274 × 10⁸ L in 2006, with worldwide consumption forecasted to reach 2.65 × 10⁹ L in 2015, this increase in biodiesel consumption is attributed to the demand for petrodiesel-biodiesel blends for diesel engines.
The need for economical, fast and efficient analytical techniques to assess the quality of petrodiesel-biodiesel blends has resulted in the development of instrumental techniques [8,9]; among the most widely used are gas chromatography, liquid chromatography, and spectroscopyinfrared spectroscopy (IR) is one of the most versatile techniques that have been used to monitor the transesterification processes of vegetable oils [10-16] and to quantify the concentration of biodiesel in blends with petrodiesel [17-22].
Due to the increased demand for petrodiesel-biodiesel blends worldwide, and the potential of African palm oils to serve as raw material for the synthesis of biodiesel, the aim of this study was to develop predictive models for estimating the concentration of African palm biodiesel in blends with petrodiesel by using chemometric techniques and infrared spectroscopy (FTIR-ATR).
2. Materials and Methods
2.1. Chemicals and Reagents
Reactive grade methanol and sodium hydroxide from Fermont were used for the synthesis of biodiesel. Commercial grade crude oil from African palms was donated by the company Agroindustrias de Palenque S.A., Chiapas, Mexico. The transesterification reaction was carried out in a round glass flask with a capacity of 1 liter; the temperature changes during the reaction were measured by a Scientific Thomas digital thermometer (±0.001˚C). The flask was fitted with a condenser to prevent any loss of methanol vapors. The mixing of the reagents was carried out by magnetic stirring. A Barnstead-Electrothermal electric blanket (BI), controlled manually was used to heat the reagents.
2.2. Instrument
The petrodiesel/biodiesel blends were analyzed using a FTIR-ATR spectrophotometer, model Agilent, Cary 660 equipped with a diamond-tip. The software Resolution 4.0 pro Variant served as an interface between the computer and the spectrophotometer. All spectra were obtained in the wavelength range between 549 and 4002 cm−1, with a resolution of 2 cm−1. The spectra were collected at 25˚C; sixteen scans were performed for each analysis. The cell was cleaned three times with acetone after each analysis. The data collected were exported to Microsoft Excel 200 and subsequently exported to the Infometrix Piruette V.4 software to build the model using partial least squares (PLS).
2.3. Procedure
2.3.1. Synthesis of Biodiesel
Biodiesel from African palms was synthesized at atmospheric pressure under the following reaction conditions: oil-methanol ratio of 1:6; catalyst concentration of 2% by weight based on the weight of the oil; reaction temperature of 60˚C and reaction time of 150 min. The catalyst was prepared by reacting anhydrous methanol with sodium hydroxide in a 500 mL Erlenmeyer flask; the mixture was stirred until sodium hydroxide was completely dissolved. The catalyst was added to the oil in the reactor and the mixture was heated to 60˚C; to facilitate the transfer of mass between the reagents, the reagents were mixed by magnetic stirring. After the reaction, the mixture was poured into a separating funnel.
The biodiesel was washed with distilled water to eliminate the presence of soap in the aqueous phase; two immiscible phases were formed in the washing process: the lower phase, containing water, glycerol, methanol and soap was separated by gravity; the upper phase, containing the methyl esters, was transferred to a distillation device in which it was distilled at 100˚C to remove the methanol and water remaining in the biodiesel. In the next purification phase, the biodiesel was refined by passing it through a glass column packed with 100 g of Amberlite Dry ion resin 10, which allowed for the removal of trace contaminants. The biodiesel was packed in amber bottles and kept refrigerated at 5˚C until further use.
2.3.2. Biodiesel/Petrodiesel Blends Preparation
Nineteen petrodiesel-biodiesel blends were prepared in triplicate for the construction of the prediction model (57 samples in total). The blends were prepared using biodiesel synthesized in the laboratory and commercial petrodiesel, purchased from a certified PEMEX franchise. An analytical balance (Ohaus ± 0.001 g) and a 100 - 1000 µL automatic pipette were used to weigh the amounts corresponding to the blends: B0, B5, B10, B15, B20, B25, B30, B35, B40, B50, B53, B60, B70, B75, B80, B82, B90, B95 and B100, which were placed into 250 mL Erlenmeyer flasks.
3. Results and Discussion
3.1. Interpretation of the Spectra
The biodiesel produced from palm oil were analyzed using FTIR-ATR spectrophotometry. The spectra as shown in Figure 1. The band located at approximately 3012 cm−1 is attributed to the C-H stretching of the double bonds of the C-H group which make up the olefins [12]; the bands located at 2924 and 2852 cm−1 are related to C-H vibrations of the methylene groups and to stretching and contraction vibrations of the methyl group. The intense peak located at 1745 cm−1 corresponds to the carbonyl radical and is characteristic of esters. The band located at 1450 cm−1 corresponds to the asymmetric stretching of the C-H bond and the asymmetric bending
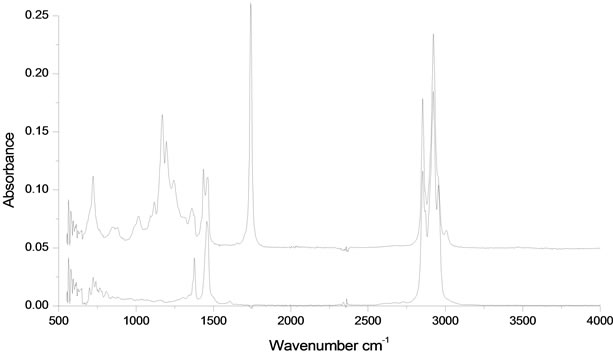
Figure 1. Absorbance bands in the infrared spectrum of samples from: (a) African palm biodiesel and (b) Petrodiesel.
of the functional group. There is a set of bands between 1000 and 1300 cm−1 that are associated with asymmetric vibrations of the C-C(=O)-O and O-C-C bonds; the high intensity bands located at 1200 cm−1 are attributed to the stretching of the methyl group O-CH3 and to the axially asymmetric deformation of the C-C=O bonds. The bands between 1100 - 1170 cm−1 correspond to the vibrations of the C-CH2-O group, the asymmetric stretching of C-O-C and C-C bond stretching [13]. The high intensity peak located at 950 cm−1 corresponds to deflections out of the plane of the C-O group and the one located at 1000 cm−1 is attributed to the symmetric angular deformation of the C-H bond of olefins [19].
The IR spectrum of petrodiesel (Figure 1) presents fewer bands compared with biodiesel. There are three overlapping bands that correspond to the methylene and methyl groups in the region between 2985 and 2870 cm−1; the first peak is attributed to the stretching vibrations of the terminal CH2 group in the olefins chain. The second and the third peaks correspond to stretching vibrations and contractions of the C-H and CH2 bonds of the methyl and methylene groups. The most relevant folding vibrations of the methyl groups are those corresponding to the phase folding deformation (1378 cm−1 band) and the outof-phase degenerate phase folding deformation (1463 cm−1 band). The foldings arise from twisting and balancing that appear at low frequencies. The methylene group presents scissors vibrations at 1463 and torsion vibrations at 721 cm−1, respectively.
The variation of the concentration of biodiesel in petrodiesel blends is reflected in the absorbance intensity of the functional groups or chemical bonds, which generates multiple overlapping bands at different wavelengths of the infrared spectrum in Figure 2. This information contained in the spectral fingerprints allowed us to develop a prediction model through chemometrics analysis that was employed to determine the concentration of biodiesel in blends with petroleum diesel with high accuracy.
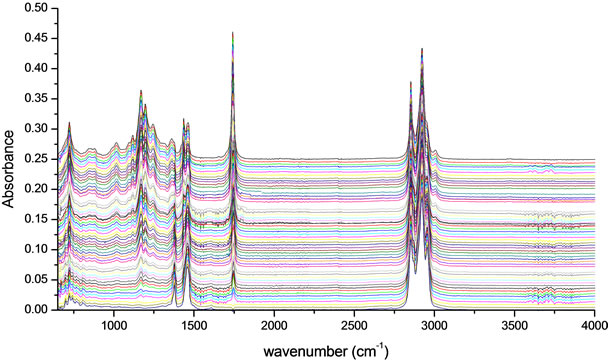
Figure 2. The variations in the intensity of absorbance in different infrared spectral bands reflect the biodiesel concentrations in petrodiesel-biodiesel blends.
3.2. Analysis of the PLS Model
Fifty seven infrared spectral fingerprints were used to build the calibration model and were within the wavelength range of 651 - 4001 cm−1. Each spectrum consisted of 1738 variables, which gave a total of 99,066 variables forming the data matrix.
To build the calibration model, the data were pretreated using a central mean and then normalized. To determine the robustness of the calibration model, the model was evaluated using cross validation with “leave five out” data and by external validation with twelve blends prepared in the laboratory; the blends were not used to build the model.
To evaluate the predictive ability of the calibrationmodel, some statistical parameters were obtained (Table 1): optimal number of principal components (PCs); explained variance (Var %) in the X matrix; standard error of calibration (SEC); standard error of validation (SEV); correlation coefficient between the actual concentration of biodiesel and the concentration of biodiesel predicted in the validation(Val r); correlation coefficient between the actual concentration of biodiesel and the concentration of biodiesel predicted in the calibration (r Cal); standard error of calibration (SEC) and standard error validation (SEV); standard error of prediction (SEP) and (SEC/ SEV) similarity criterion [23].
The model predictions with six PCs explain 99.306% of the total variance. The calibration (r Cal) and validation (r Val) correlation coefficients had values to the unity, which indicates that a high correlation exists between the actual values of the biodiesel concentration and the concentration predicted by the model; with six PCs, the values of the standard error of calibration (SEC) and the standard error of validation (SEV) were lower than unity, indicating that the model has a high predictive ability (Table 1). The value of SEC/SEV similarity criterion was 0.935, which is near unity, indicating that the model has a good fit, as the identified values are within 0.5 - 1 [23]. The low value presented by the standard error of predictction (SEP = 0.736) shows that the model has a high predictctive ability and high precision; the cross validation using “leave five out” data shows that the model is robust, as the values of the statistical parameters were good in both cases. This is shown in Figure 3.
4. Conclusion
Fourier transform infrared spectroscopy (FTIR-ATR) and chemometric analysis are useful tools for building a PLS prediction model. The statistical parameters obtained for the prediction model show that this approach allows for the determination of the concentration of biodiesel from
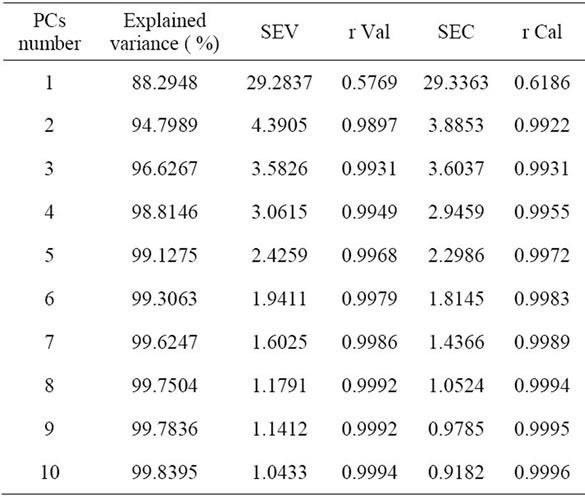
Table 1. Cross validation using leave five out data to evaluate the PLS prediction model.
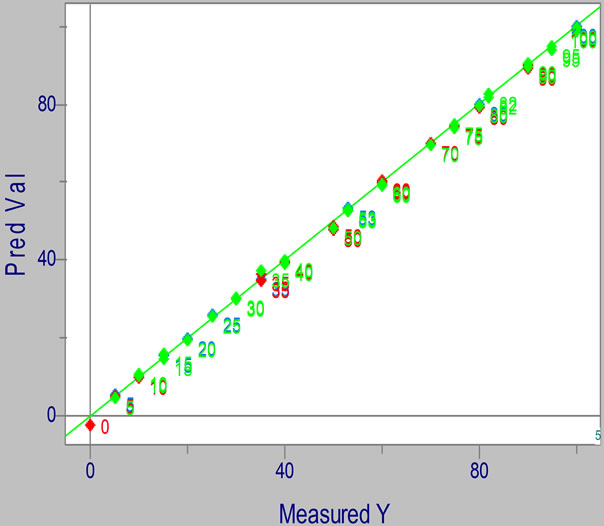
Figure 3. Calibration graph of the PLS regression model built with cross-validation using “leave five out” data; used to predict the concentration of biodiesel of African palm in blends with petrodiesel.
African palm biodiesel in blends with petrodiesel with high precision. The spectroscopic technique can be used together with the traditionally developed model to control the quality of petrodiesel-biodiesel fuel blends. It has the advantage of being quick, inexpensive, efficient and environmentally friendly.
5. Acknowledgements
We are grateful to PROMEP for providing financial resources throughout the project PROMEP/103.5/09/4363 and the Research Line 3 of Alternate Energy and Biomaterials of Colegio de Postgraduados. The Nanomaterials Laboratory Faculty of Chemistry, Universidad Autonó- madel Carmen, Mexico, for performing the IR analysis of petrodiesel-biodiesel blends.
REFERENCES
- R. C. M. Faria, M. J. C. Rezende, C. M. Rezende and A. C. Pinto, “Desenvolvimiento e Validação de Metodologia de Análise de Misturas Biodiesel: Diesel Utilizando Cromatografía Gaseosa-Espectrometría de Massas,” Quimica Nova, Vol. 30, No. 7, 2007, pp. 1900-1905. doi:10.1590/S0100-40422007000800020
- A. R. Hosseinpoor, M. H. Forouzanfar, M. Yunesian, F. Asghari, K. H. Naieni and D. Farhood, “Air Pollution and Hospitalization Due to Angina Pectoris in Theran,” Environmental Research, Vol. 99, No. 1, 2005, pp. 126-131. doi:10.1016/j.envres.2004.12.004
- L. Ryan, F. Convery and S. Ferreira, “Stimulating the Use of Biofuels in the European Union: Implications for Climate Change Policy,” Energy Police, Vol. 34, No. 17, 2006, pp. 3184-3194. doi:10.1016/j.enpol.2005.06.010
- M. Cetin, F. Yüksel and H. Kus, “Emission Characteristics of a Converted Diesel Engine Using Ethanol as Fuel,” Energy for Sustainable Development, Vol. 13, No. 4, 2009, pp. 250-254. doi:10.1016/j.esd.2009.10.001
- M. A. Fazal, A. S. M. A. Haseeb and H. H. Masjuki, “Biodiesel Feasibility Study: An Evaluation of Material Compatibility; Performance; Emission and Engine Durability,” Renewable and Sustainable Energy Reviews, Vol. 15, No. 2, 2011, pp. 1314-1324. doi:10.1016/j.rser.2010.10.004
- J. E. Fargione, R. J. Plevin and J. D. Hill, “The Ecological Impact of Biofuels,” Annual Review of Ecology, Evolution, and Systematics, Vol. 41, No. 17, 2010, pp. 351-377. doi:10.1146/annurev-ecolsys-102209-144720
- M. Johnston and T. Holloway, “A global Comparison of National Biodiesel Production Potentials,” Environmental Science & Technology, Vol. 41, No. 32, 2007, pp. 7967- 7973. doi:10.1021/es062459k
- G. Knothe, “Determining the Blend Level of Mixtures of Biodiesel with Conventional Diesel Fuel by Fiber-Optic Near-Infrared Spectroscopy and 1H Nuclear Magnetic Resonance Spectroscopy,” Journal of the American Oil Chemists’ Society, Vol. 78, No. 10, 2001, pp. 1025-1028. doi:10.1007/s11746-001-0382-0
- G. Knothe, “Analyzing Biodiesel: Standar and Other Methods,” Journal of the American Oil Chemists’ Society, Vol. 83, No. 10, 2006, pp. 823-833. doi:10.1007/s11746-006-5033-y
- M. A. Dubé, S. Zheng, D. D. McClean and K. Morris, “A Comparison of Attenuated Total Reflectance-FTIR Spectroscopy and GPC for Monitoring Biodiesel Production,” Journal of the American Oil Chemists’ Society, Vol. 81, No. 6, 2004, pp. 599-603. doi:10.1007/s11746-006-0948-x
- G. F. Zagonel, P. Peralta and L. P. Ramos, “Multivariate Monitoring of Soybean Oil Etholysis by FTIR,” Talanta, Vol. 63, No. 4, 2004, pp. 1021-1025. doi:10.1016/j.talanta.2004.01.008
- G. F. Ghesti, J. L. Macedo, V. Braga, T. C. P. de Souza, A., C. I. de Souza, V. E. S. Parente, Figueredo, I. S. Resck, J. A. Dias and S. C. L. Dias, “Application of Raman Spectroscopy to Monitor and Quantify Ethyl Ester in Soybean Oil Transesterification,” Journal of the American Oil Chemists’ Society, Vol. 83, No. 7, 2006, pp. 597- 601. doi:10.1007/s11746-006-1244-5
- N. G. Siatis, A. C. Kimabari, C. S. Pappas, P. A. Tarantilis and M. G. Polissiou, “Improvement of Biodiesel Production Based on the Application of Ultrasound: Monitoring of the Procedure by FTIR Spectroscopy,” Journal of the American Oil Chemists’ Society, Vol. 83, No. 1, 2006, pp. 53-57. doi:10.1007/s11746-006-1175-1
- S. M. Lima, T. Izida, M. S. Figueiredo, L. C. H. Andrade, P. V. Del Ré, N. Jorge, E. Buba and F. Aristone, “Analysis of Biodiesel and Frying Vegetables Oils by Means of FTIR Photoacoustic Spectroscopy,” The European Physical Journal Special Topics, Vol. 153, No. 1, 2008, pp. 535-537. doi:10.1140/epjst/e2008-00502-9
- M. G. Trevisan, C. M. Garcia, U. Schuchardt and R. Poppi, “Evolving Factor Analysis-Based Method for Correcting Monitoring Delay in Different Batch Runs for Use with PLS: On-Line Monitoring of a Transesterification Reaction by ATR-FTIR,” Talanta, Vol. 74, No. 4, 2008, pp. 971-976. doi:10.1016/j.talanta.2007.08.004
- F. Anguebes, M. Rangel, M. Castelán, A. Guerrero, J. M. Cervantes, M. Aguilar and W. A. Herrera, “Evaluación de la Transesterificación del Aceite de Canola. Empleo de la Espectroscopía de Infrarrojo con Transformada de Fourier,” Ingeniería Química, Vol. 9, No. 498, 2011, pp. 238-242.
- J. S. Oliveira, R. Montalváo, L. Daher, P. A. Z. Suarez and J. C. Rubim, ”Determination of Methyl Ester Contents in Biodiesel Blends by FTIR-ATR and FTNIR Spectroscopies,” Talanta, Vol. 69, No. 5, 2006, pp. 1278- 1284. doi:10.1016/j.talanta.2006.01.002
- F. C. C. Oliveira, C. R. R. Brandáo, H. F. Ramalho, L. A. F. Da Costa, P. A. Z. Suarezand J. C. Rubim, “Adulteration of Diesel/Biodiesel Blends by Vegetable Oil as Determined by Fourier Transform (FT) Near Infrared Spectrometry and FT-Raman Spectroscopy,” Analytica Chimica Acta, Vol. 587, No. 2, 2007, pp. 194-199. doi:10.1016/j.aca.2007.01.045
- M. F. Pimentel, G. M. G. Ribeiro, R. S. da Cruz, L. Stragevitch, J. G. A. Pacheco and L. S. G. Teixeira, “Determination of Biodiesel Content When Blended with Mineral Diesel Fuel Using Infrared Spectroscopy and Multivariate Calibration,” Microchemical Journal, Vol. 82, No. 2, 2006, pp. 201-206. doi:10.1016/j.microc.2006.01.019
- M. A. Aliske, G. F. Zagonel, B. J. Costa, W. Veiga and C. Ketzer, “Measurement of Biodiesel Concentration in a Diesel Oil Mixture,” Fuel, Vol. 86, No. 10-11, 2007, pp. 1461-1464. doi:10.1016/j.fuel.2006.11.008
- L. L. N. Guarieiro, A. C. Pinto, P. Fernandes de Aguiar and N. M. Ribeiro, “Metodología Analítica para Cuantificar o Teor de Biodiesel na Mistura Biodiesel: Diesel Utilizando Espectroscopia na Região do Infravermelho,” Quimica Nova, Vol. 31, No. 2, 2008, pp. 421-426. doi:10.1590/S0100-40422008000200041
- M. Meira, C. M. Quintella, T. M. Ferrer, H. R. Goncalves, A. K. Guimaráes, M. Andrade, P. R. da Costa and L. M. Pepe, “Identificação de Adulteração de Biocombustível por Adição de Óleo Residual aoDiesel por Espectrofluorimetria Total 3D e Análise das Componentes Principais,” Quimica Nova, Vol. 34, No. 4, 2011, pp. 621-624. doi:10.1590/S0100-40422011000400013
- M. F. Ferrão, M. de Souza, R. E. Panta, D. Fachini, A. E. Gerbase and L. Marder, “Simultaneous Determination of Quality Parameters of Biodiesel/Diesel Blends Using HATR-FTIR Spectra and PLS, iPLS or siPLS Regressions,” Fuel, Vol. 90, No. 2, 2011, pp. 701-706. doi:10.1016/j.fuel.2010.09.016
NOTES
*The authors declare that no conflict of interests exists.
#Corresponding author.