American Journal of Analytical Chemistry
Vol.3 No.10(2012), Article ID:23621,10 pages DOI:10.4236/ajac.2012.310090
Determination of Heavy Metals at Sub-ppb Levels in Water by Graphite Furnace Atomic Absorption Spectrometry Using a Direct Introduction Technique after Preconcentration with an Iminodiacetate Extraction Disk
Department of Applied Chemistry, Meiji University, Kawasaki, Japan
Email: *tetsuo@meiji.ac.jp
Received August 20, 2012; revised September 21, 2012; accepted September 28, 2012
Keywords: Water Sample; Heavy Metal; Preconcentration; Iminodiacetate Extraction Disk; Direct Introduction Technique; Graphite Furnace Atomic Absorption Spectrometry
ABSTRACT
A direct analysis method combining an iminodiacetate extraction disk (IED) with graphite furnace atomic absorption spectrometry was developed for the determination of Co, Ni, Cu, Cd, Sn, Pb, and Bi at sub-ppb levels in water. A 100 mL water sample was adjusted to pH 5.6 with nitric acid and a 1 mol·L–1 ammonium acetate solution, and then passed through an IED (diameter, 47 mm; effective filtering diameter, 35 mm) at a flow rate of 80 - 100 mL·min–1 to preconcentrate seven analytes. The IED was dried at 100˚C for 20 min in an electric oven, and 110 - 145 small disks, each 2 mm in diameter, were punched out from the IED. A small disk was introduced into the graphite furnace and atomized according to a heating program. For Cd, Sn, Pb, and Bi measurements, Pd was used as a chemical modifier to enhance the absorbances. Calibration was performed using aqueous standard solutions. The detection limits, corresponding to three times the standard deviation (n = 5) of the blank values, were 0.092 mg·L–1 for Co, 0.12 mg·L–1 for Ni, 0.40 mg·L–1 for Cu, 0.077 mg·L–1 for Cd, 0.92 mg·L–1 for Sn, 0.61 mg·L–1 for Pb, and 0.80 mg·L–1 for Bi with an enrichment factor of 140 using a 100-mL water sample. A spike test for the seven analytes in tap water, rainwater, river water, and mineral drinking water showed quantitative recoveries (93% - 108%).
1. Introduction
Some heavy metals are considered to be essential trace elements for the human body because they act as catalysts in enzymatic reactions and are deeply involved in the metabolism of glucose and lipids. In contrast, other heavy metals have higher toxicity and carcinogenicity. Therefore, it is important to determine the heavy metal content of environmental samples.
Instrumental sensitivity is not always sufficient for the determination of heavy metals in water because their concentrations are generally at sub-ppb levels. Therefore, it is necessary to combine a preconcentration technique with an instrumental analysis method, such as atomic absorption spectrometry (AAS), inductively coupled plasma atomic emission spectrometry (ICP-AES), and inductively coupled plasma mass spectrometry (ICP-MS), for the determination of heavy metals in water.
Solid-phase extraction (SPE) has recently become popular for separation and/or preconcentration [1]. In particular, disk-type SPE has been widely used to preconcentrate a large-volume water sample (e.g., 100 - 1000 mL) for inorganic [2-6] and organic [7-11] analyses because it offers higher flow rates than column-type SPE owing to its large cross-sectional area. Iminodiacetate Extraction Disks (IEDs) are useful for the preconcentration of trace metals in water because of their high selectivity for heavy metals. Kuriyama et al. [12] and Ouyang et al. [13] reported a method for the determination of Al, Mn, Fe, Co, Ni, Cu, Zn, Cd, and Pb in water by ICP-AES with an IED. A 1000-mL water sample (pH 5.6 - 5.8) was passed through an IED at a flow rate of 100 - 150 mL·min–1 to preconcentrate the nine analytes, and these analytes were eluted from the IED with 9 - 10 mL of 3 mol·L–1 nitric acid. The eluate was then diluted to 10 - 20 mL with purified water or distilled water. Lee et al. [14] also reported a method for the determination of V, MnCo, Ni, Cu, Mo, Cd, and U in water by ICP-MS with an IED. However, the elution step may give rise to a negative error owing to incomplete elution of the analytes from the IED. Therefore, direct analysis of analytes in the IED is necessary to avoid analyte loss.
Several direct analysis methods combining an IED with Laser-Induced Breakdown Spectroscopy (LIBS) [15, 16] or X-ray fluorescence (XRF) spectrometry [17,18] have been reported for the determination of heavy metals in water. Direct introduction/AAS [19] is also attractive. However, a method combining IED with direct introduction/AAS has not yet been developed for the determination of heavy metals in water. Furthermore, it is difficult to introduce an IED directly into the furnace because a commercially available IED is 47 mm in diameter. This problem can be solved by adopting a punching technique before AAS analysis [20-23].
The present investigation concerns a further application of direct introduction/AAS to determine heavy metals at sub-ppb levels in water. This method involves preconcentration of Co, Ni, Cu, Cd, Sn, Pb, and Bi with an IED. Furthermore, the discussion is extended to elemental mapping, the size of the small disk, the atomization conditions, and the calibration curves and detection limits. The detection limits of the proposed method are also compared with those reported in the literature [12-15, 17,18]. The proposed method was successfully applied for the determination of the seven analytes in tap water, rainwater, river water, and mineral drinking water.
2. Experimental
2.1. Apparatus
A ZEEnit 60 atomic absorption spectrometer (Analytik Jena AG, Jena, Germany) was used in conjunction with Hitachi hollow-cathode lamps, a transversely heated graphite atomizer, and an SSA 61Z solid sampling system (Analytik Jena AG). The Zeeman effect was employed for background correction under two-field mode (0.8 T magnetic field strength) conditions. Pure argon (99.995%) was used as the carrier gas during drying and pyrolysis, except during atomization, where the gas flow was stopped. Atomization was conducted in Solid Sampling (SS) graphite tubes (Analytik Jena AG, Part No. 407-152.013) with SS graphite platforms (Analytik Jena AG, Part No. 407-152.023). The integrated absorbance (peak area) was used exclusively for signal evaluation and quantification. The instrumental conditions are given in Table 1.
A micro energy-dispersive XRF (μ-EDXRF) spectrometer (Rigaku Corp., Tokyo, Japan) was used for elemental mapping of the IED to confirm the homogeneities of the analytes on it.
Aqueous samples were injected into the SS platform using an Eppendorf Model Reference—4800 pipette (10 μL fixed volume, Eppendorf, Hamburg, Germany).
A Demi-Ace Model-15 deionizer (Kurita Water Industries, Tokyo, Japan) was used to prepare deionized water. An HM-30V pH meter (DKK-TOA, Tokyo, Japan) was used for pH control of the sample solution. An FS-320 electric oven (Advantec Toyo Kaisha, Tokyo, Japan) was used to dry the IED.
2.2. Reagents and Samples
Stock standard solutions (1000 mg·L–1) of Co, Ni, Cu, Cd, Sn, Pb, and Bi were purchased from Junsei Chemical (Tokyo, Japan). Calibrating standard solutions of Co, Ni, Cu, Cd, Sn, Pb, and Bi were prepared by accurate dilution of the respective stock standard solutions. A 1000 mg·L–1 Pd stock standard solution for AAS (analyticalreagent grade, Wako Pure Chemical, Osaka, Japan) was used as a chemical modifier.
An IED (3M EmporeTM extraction disk, 47 mm diameter, 0.5 mm thickness, 3M, St. Paul, MN) was used throughout the study.
Tap water samples were obtained from Kawasaki and Fujisawa, Kanagawa, Japan. Rainwater was sampled at Kawasaki, Kanagawa, Japan. River water was sampled from the Tamagawa River, Okutama, Tokyo, Japan. Bottled mineral drinking water samples were brought from Kawasaki, Kanagawa, Japan. Water samples were filtered through a glass-fiber filter (GMF 150, 1.0 μm pore size, 47 mm diameter, 0.73 mm thickness, Whatman, Kent, England) and analyzed immediately using the proposed method.
2.3. Procedure
An IED (diameter, 47 mm; effective filtering diameter, 35 mm) was soaked with methanol and then conditioned successively with 20 mL of 3 mol·L–1 nitric acid, 100 mL of deionized water, and 50 mL of 0.1 mol·L–1 ammonium
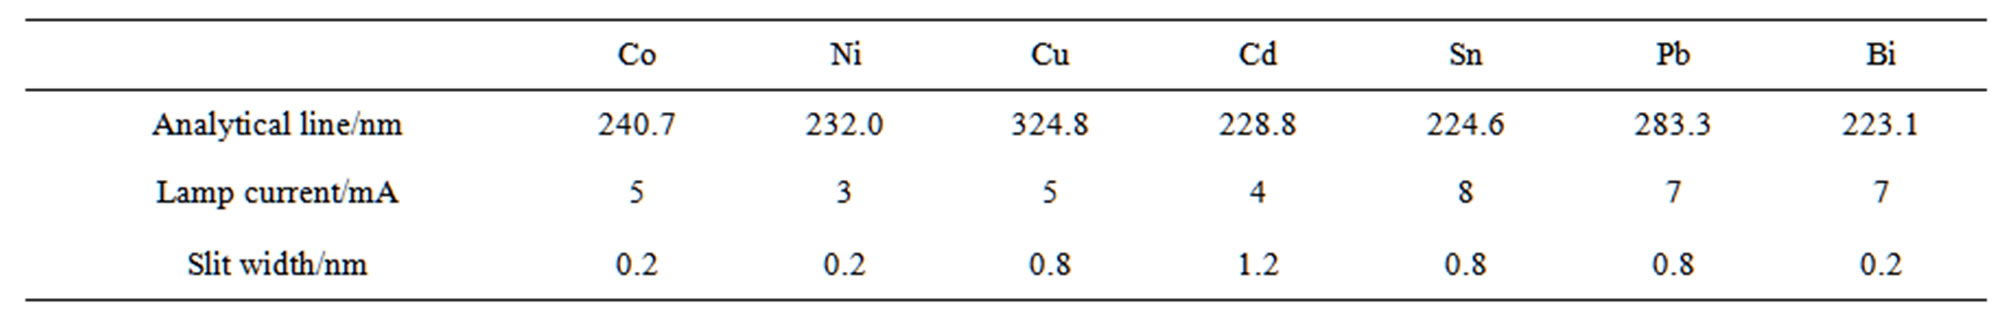
Table 1. Instrumental conditions of atomic absorption spectrometry for Co, Ni, Cu, Cd, Sn, Pb, and Bi.
acetate solution (pH 5.6). A 100-mL water sample was first adjusted to pH 5.6 [12-14,18] with nitric acid and a 1 mol·L–1 ammonium acetate solution because the carboxylate groups in the iminodiacetic acid are negatively charged at a pH of greater than 5, and the IED functions as a cation exchanger or metal chelator when the pH approaches neutral. After pH adjustment, the 100-mL water sample was passed through the IED at a flow rate of 80 - 100 mL·min–1 [18] to preconcentrate Co, Ni, Cu, Cd, Sn, Pb, and Bi. The IED was subsequently washed with 20 mL of deionized water. It was then dried at 100˚C for 20 min in the electric oven, and 110 - 145 small disks, each 2 mm in diameter, were punched out from the IED.
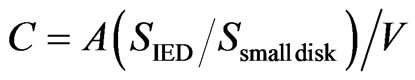
A small disk was placed on the SS platform with a wooden toothpick and introduced into the graphite furnace. For the Cd, Sn, Pb, and Bi measurements, suitable amounts of Pd were added before introduction into the furnace. The specimen was dried, pyrolyzed, and atomized according to the heating program described below (Table 2). Calibration was performed using the aqueous standards, which were pipetted manually onto the SS platform, introduced into the graphite furnace, and analyzed under the same atomization conditions. Calibration curves for the seven analytes were built by plotting the integrated absorbance versus the amount. The analyte concentrations in water were calculated using the following equation:
 (1)
(1)
where C (mg·L–1) is the analyte concentration in water, A (ng) is the absolute amount of analyte on the small disk obtained from the calibration curve, SIED is the effective filtration area of the IED (962 mm2), Ssmall disk is the area of the small disk (3.14 mm2), and V (mL) is the sample volume.
3. Results and Discussion
3.1. Elemental Mapping
The analytes on the IED should have a homogeneous distribution because the analyte concentrations in water are based on the area ratio of the IED and the small disk (Equation (1)). The homogeneities of the analytes on the IED were evaluated using elemental mapping of the fluorescent X-ray intensities. For XRF measurements, it is necessary to preconcentrate the analytes to a high density on the IED before they break through. In this experiment, therefore, a 100-mL deionized water sample (pH 5.6) containing 1 mg each of Co, Ni, Cu, Cd, Sn, Pb, and Bi was passed through the conditioned IED at a flow rate of 1 mL·min–1. The IED was then dried at 100˚C for 20 min in the electric oven, coated with a commercially available laminate film to prevent damage to the IED by X-ray irradiation [6,18], and measured using m-EDXRF spectrometer. The mapping conditions were 100 points (1 mm diameter) in 18 ´ 18 mm2 of the scanning area. As an example, elemental mapping images of Cu, Cd, and Pb on the IED are shown in Figure 1. Each X-ray intensity varied slightly, and the relative standard deviations (RSDs) (n = 100) of the X-ray intensities were 1.8% for Co Kα, 2.1% for Ni Kα, 2.0% for Cu Kα, 3.3% for Cd Kα, 4.1% for Sn Kα, 2.1% for Pb Lβ, and 3.4% for Bi Lα. The results (i.e., RSDs of less than 5%) indicate that the analytes are homogeneously distributed on the IED. Consequently, the analyte concentrations in water can be determined using Equation (1).
3.2. Size of Small Disks
We next investigated the size of the small disks from the IED introduced into the furnace. When the IED was punched with three different sizes of hole punch (1, 2, and 3 mm diameter), the sample masses were 0.26, 1.20, and 3.18 mg, respectively. Considering the sample mass (typically 1 mg) in direct introduction/AAS [19], we decided to use the 2-mm-diameter hole punch for this study. In addition, 372 small disks, each 2 mm in diameter, were punched out from the IED and then weighed directly on the SS platforms. The average mass of the small disks was 1.29 mg, and the RSD (n = 372) of the mass was 7.4%. In fact, it is possible to conduct repeated measurements of the analytes because 110 - 145 small disks, each 2 mm in diameter, could be prepared from the effective filtration area of an IED. Furthermore, by preserving small disks containing known amounts of the analytes in a desiccator, equipment calibration can also be performed using them.
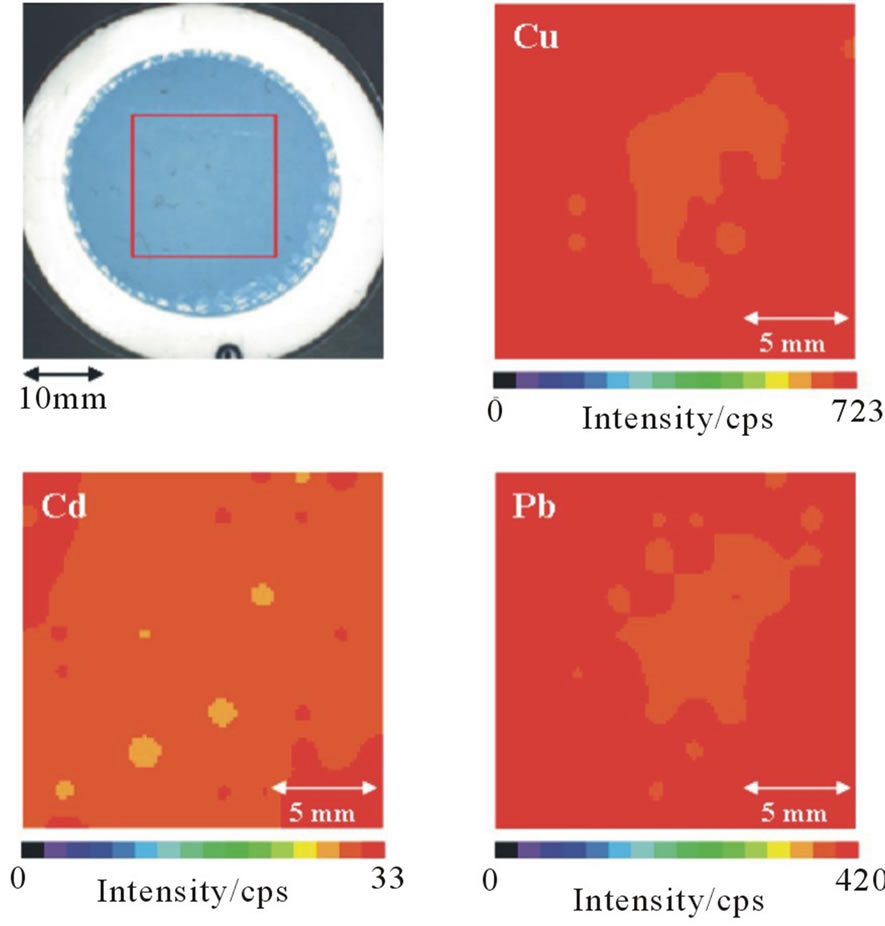
Figure 1. Elemental mapping images of Cu, Cd, and Pb on the IED.
3.3. Atomization Conditions
Our laboratory has successfully applied the direct introduction/AAS method to a variety of inorganic materials, such as carbonate rocks [24], silicate rocks [25], quartz and rock crystals [26], zirconia [27], silicon nitride and silicon carbide [28], human and artificial teeth [29], and soils [30]. If the pyrolysis temperature is insufficient for the decomposition of an IED comprising 90% poly(styrenedivinylbenzene) copolymer functionalized with an iminodiacetic acid group and 10% polytetrafluoroethylene, extremely high background absorption caused by the evolution of smoke may be observed during the atomization step. Therefore, a pyrolysis temperature of 800˚C (60 s) was adopted to remove the organic matrix before atomization. In contrast, the analytes were atomized at the temperatures recommended by the manufacturer. When the analytes (Co, Ni, Cu, Cd, Sn, Pb, and Bi) on a small disk (2 mm diameter) from the IED were atomized under the above-mentioned conditions, the absorbancetime profiles of only Pb and Bi showed double peaks consisting of a large first peak and a small second peak, as shown in Figure 2(a). In contrast, when a palladium nitrate solution was added to the small disk as a chemical modifier for the elements of the 13 - 16 groups [31] before it was introduced into the furnace, the absorbance-time profiles of Pb and Bi showed a single broad peak, as shown in Figure 2(b). The results suggest that the first peak may be due to vaporization of the analyte element, and the second peak may be attributable to condensation and revaporization of the analyte element. The reason is that the double peaks could be eliminated by the addition of Pd, which prevents the evaporation of elements of the 13 - 16 groups by forming a thermally stable compound (i.e., a solid solution and/or intermetallic compound). A comparison of the absorbance-time profiles of Pb and Bi reveals that the Bi signal was almost the same as the background signal. The overlap of the background signal with the Bi signal did not become a serious problem because background correction was carried out using the Zeeman effect instead of continuum sources (mainly deuterium lamp) throughout the study [32]. In addition, Cd, Sn, Pb, and Bi may evaporate during pyrolysis because these analytes are volatile. Palladium is also effective in preventing evaporation of Cd [33,34]. Therefore, the effect of the amount of Pd on the integrated absorbances of Cd, Sn, Pb, and Bi was investigated. Figure 3 shows the variation in the integrated absorbances of Cd, Sn, Pb, and Bi on the small disk with the amount of Pd. The integrated absorbances of Sn, Pb, and Bi increased with an increase in the amount of Pd and leveled off above 0.25 mg for Pb and 2 μg for Sn and Bi. In contrast, the integrated absorbance of Cd increased remarkably up to 4 μg.
The atomization conditions for the determination of
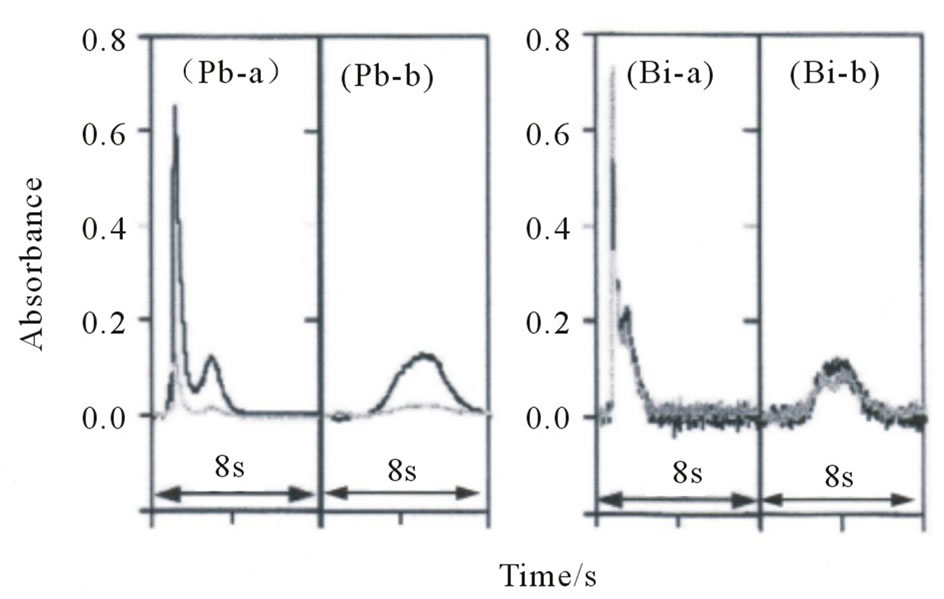
Figure 2. Absorbance-time profiles of Pb and Bi on a small disk (2 mm diameter) from the IED (a) without and (b) with the addition of Pd(NO3)2 solution. Black line is the atomic absorption; gray line is the background absorption.
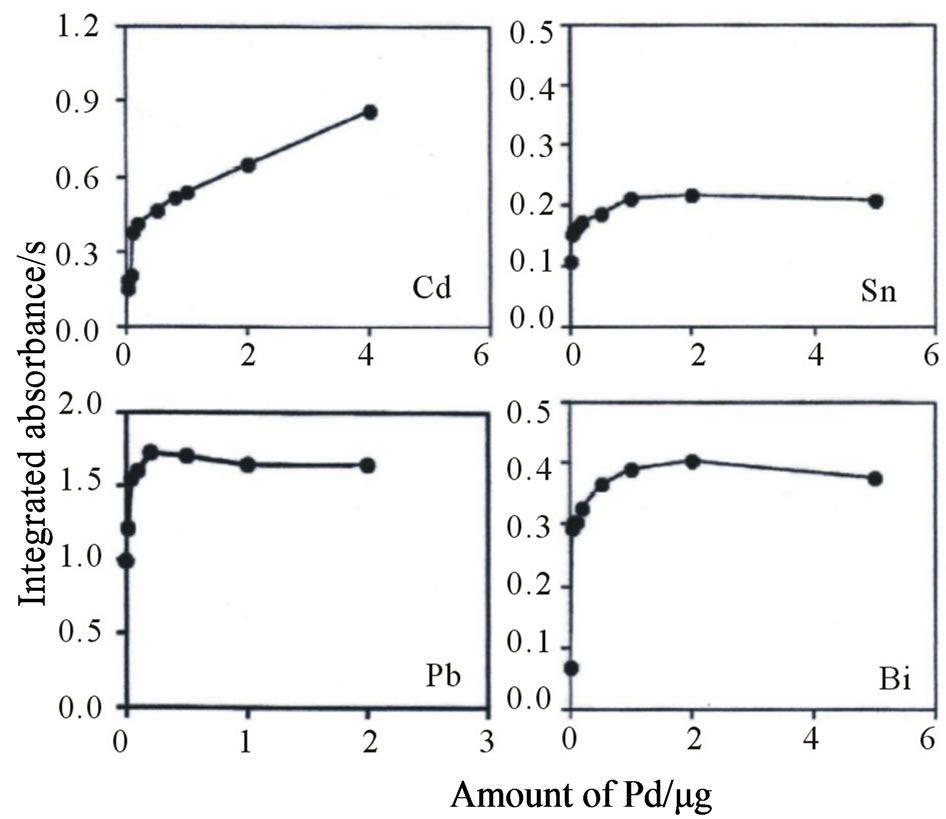
Figure 3. Variation in the integrated absorbances of Cd, Sn, Pb, and Bi on a small disk (2 mm diameter) from the IED with the amount of Pd.
Co, Ni, Cu, Cd, Sn, Pb, and Bi are given in Table 2.
3.4. Calibration Curves and Detection Limits
In direct introduction/AAS, calibration is performed using solid standards or aqueous standards [19]. Because solid standards are more expensive, it is preferable to use aqueous standards for calibration. However, the difference in matrices between the solid and liquid forms may cause different atomization processes. Therefore, we prepared calibration curves (Figure 4) for Co, Ni, Cu, Cd, Sn, Pb, and Bi by using two series of calibrating standards consisting of the analytes in a small disk (2 mm diameter) from the IED and an aqueous standard under the proposed atomization conditions (Table 2). The calibration curves established using both standards showed good linearity at less than 3 ng for Co, Ni, and Cu; 0.5 ng
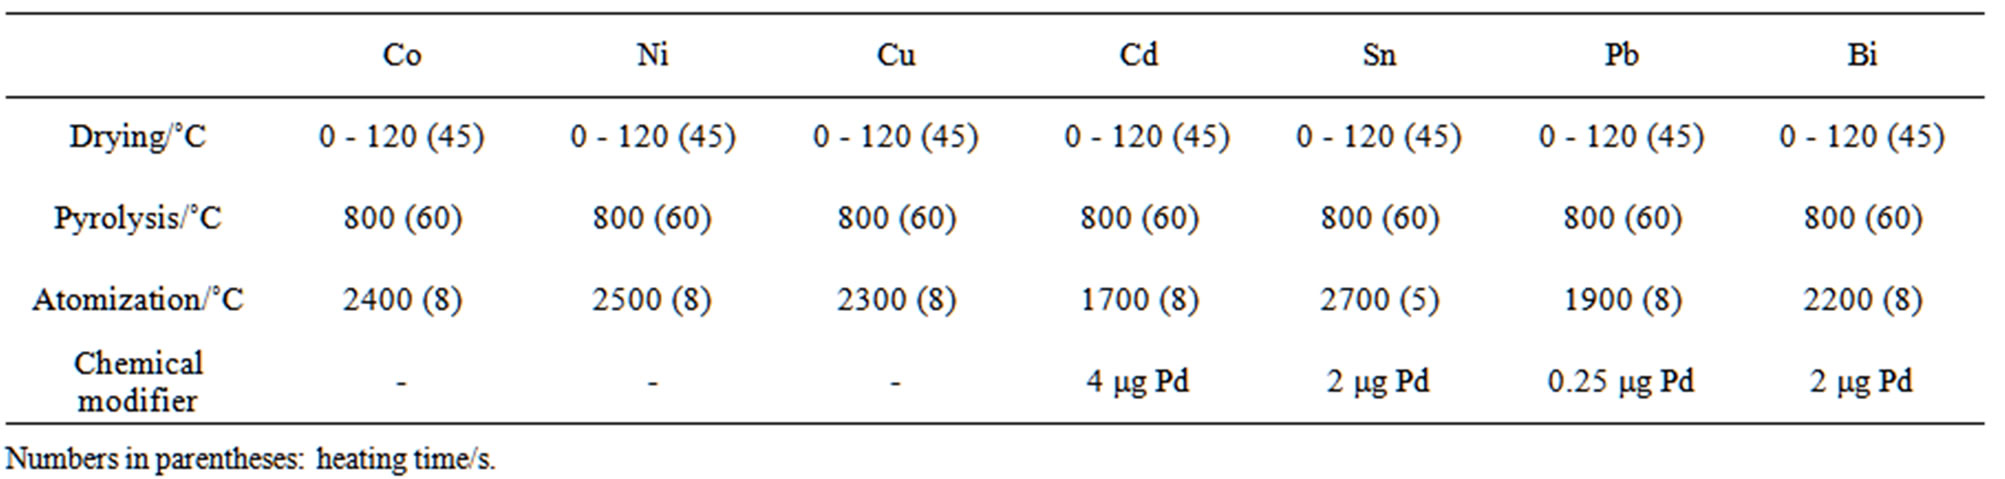
Table 2. Atomization conditions for the determination of Co, Ni, Cu, Cd, Sn, Pb, and Bi.
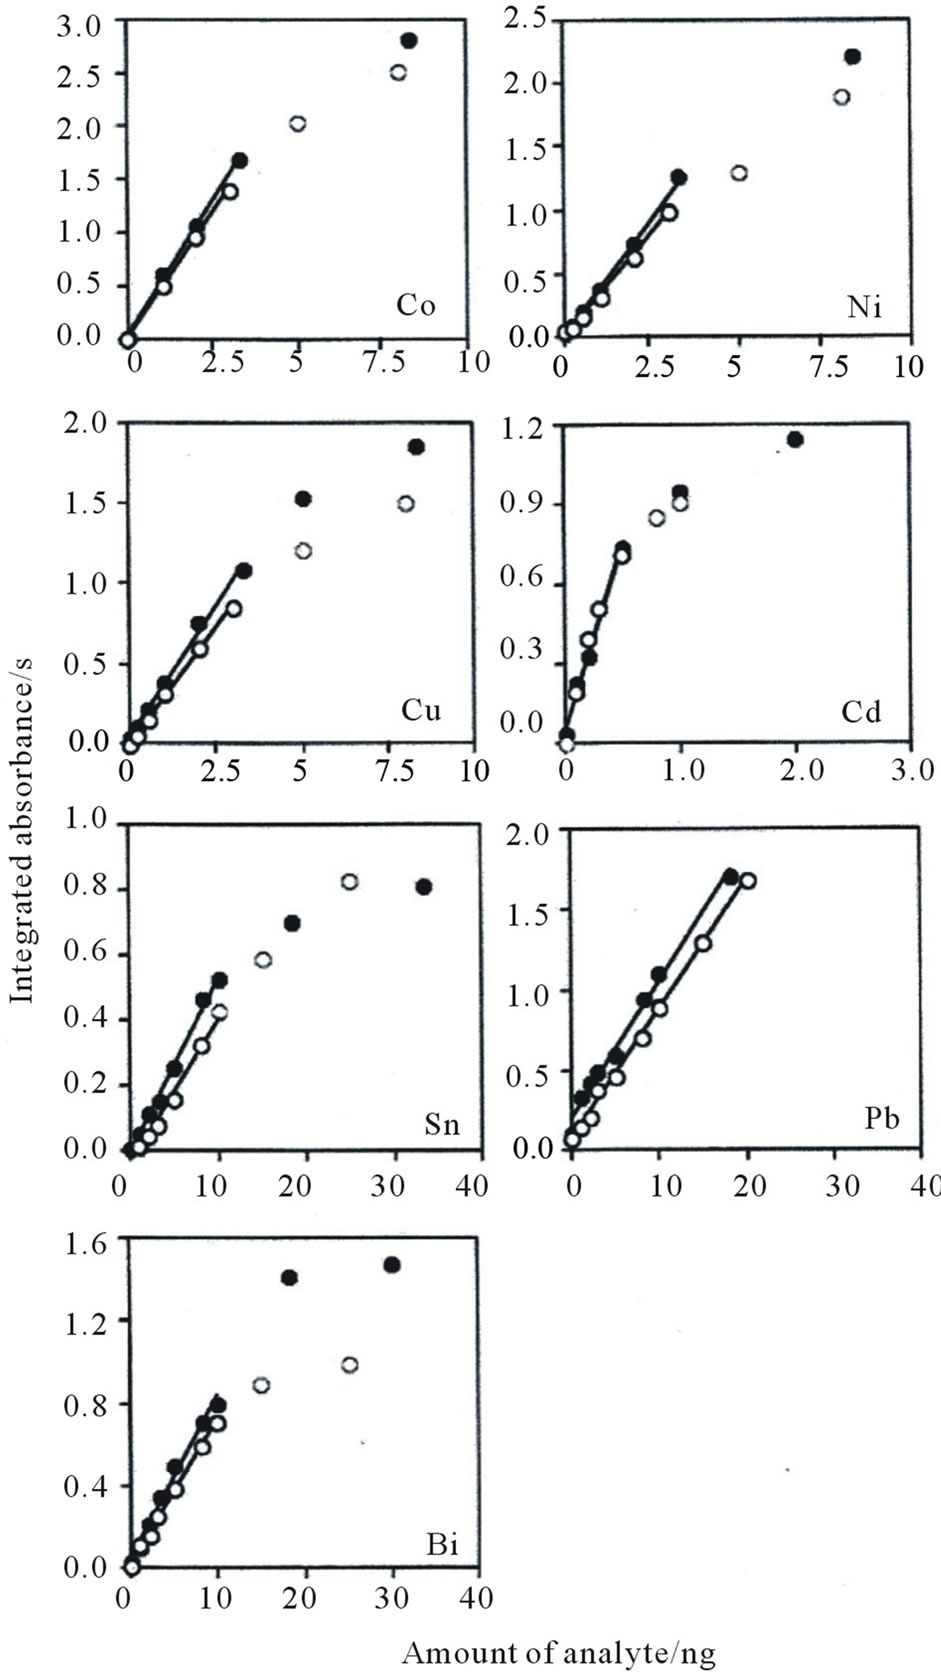
Figure 4. Calibration curves of Co, Ni, Cu, Cd, Sn, Pb, and Bi in a small disk (2 mm diameter) from the IED (●) and an aqueous standard (○).
for Cd; 10 ng for Sn and Bi; and 20 ng for Pb. A decrease in the integrated absorbance was also observed for all the analytes except for Pb as a result of the Lorentz pressure effect. Furthermore, the slopes of the calibration curves for the small disk were almost identical to those for the aqueous standard, indicating that the aqueous standard can be used to determine the seven analytes on the small disk. The detection limits, corresponding to three times the standard deviation (n = 5) of the blank values, were 0.030 ng for Co, 0.038 ng for Ni, 0.13 ng for Cu, 0.025 ng for Cd, 0.30 ng for Sn, 0.20 ng for Pb, and 0.26 ng for Bi. When an enrichment factor of 140, calculated by dividing the sample volume (ca. 100 g) by the mass of an IED (ca. 0.7 g), was achieved using a 100-mL water sample, the detection limits were 0.092 mg·L–1 for Co, 0.12 mg·L–1 for Ni, 0.40 mg·L–1 for Cu, 0.077 mg·L–1 for Cd, 0.92 mg·L–1 for Sn, 0.61 mg·L–1 for Pb, and 0.80 mg·L–1 for Bi.
Table 3 compares the detection limits of the proposed method with those obtained by combining an IED with ICP-AES [12,13], ICP-MS [14], LIBS [15], or XRF spectrometry [17,18] for the determination of heavy metals in water. The detection limits of the proposed method are lower than those of LIBS and comparable to those of XRF spectrometry. However, although the detection limits are higher than those of ICP-AES and ICP-MS, which involve an elution step, at least sub-ppb levels of heavy metals in water can be determined directly without an elution step by using the proposed method.
3.5. Application to Water Samples
We first investigated the repeatability of the proposed method using 100 mL synthetic mixtures of 6 mg·L–1 Co, 9 mg·L–1 Ni, 9 mg·L–1 Cu, 0.9 mg·L–1 Cd, 15 mg·L–1 Sn, 15 mg·L–1 Pb, and 6 mg·L–1 Bi. The RSDs for five measurements were 4.4% for Co, 3.2% for Ni, 5.0% for Cu, 6.2% for Cd, 4.7% for Sn, 5.1% for Pb, and 4.8% for Bi. Next the proposed method was applied to the determination of Co, Ni, Cu, Cd, Sn, Pb, and Bi in tap water, rainwater, river water, and mineral drinking water. Calibrations were performed using a suite of standard solutions, and the analyte concentrations in the water samples were calculated using Equation (1). The accuracy of the analytical values was evaluated by a spike test for the seven analytes in 100- mL water samples. The results of the spike test are given in Table 4. The recoveries for the seven analytes in the water samples were satisfactory (93% - 108%). The good recoveries indicate that the proposed method is useful for
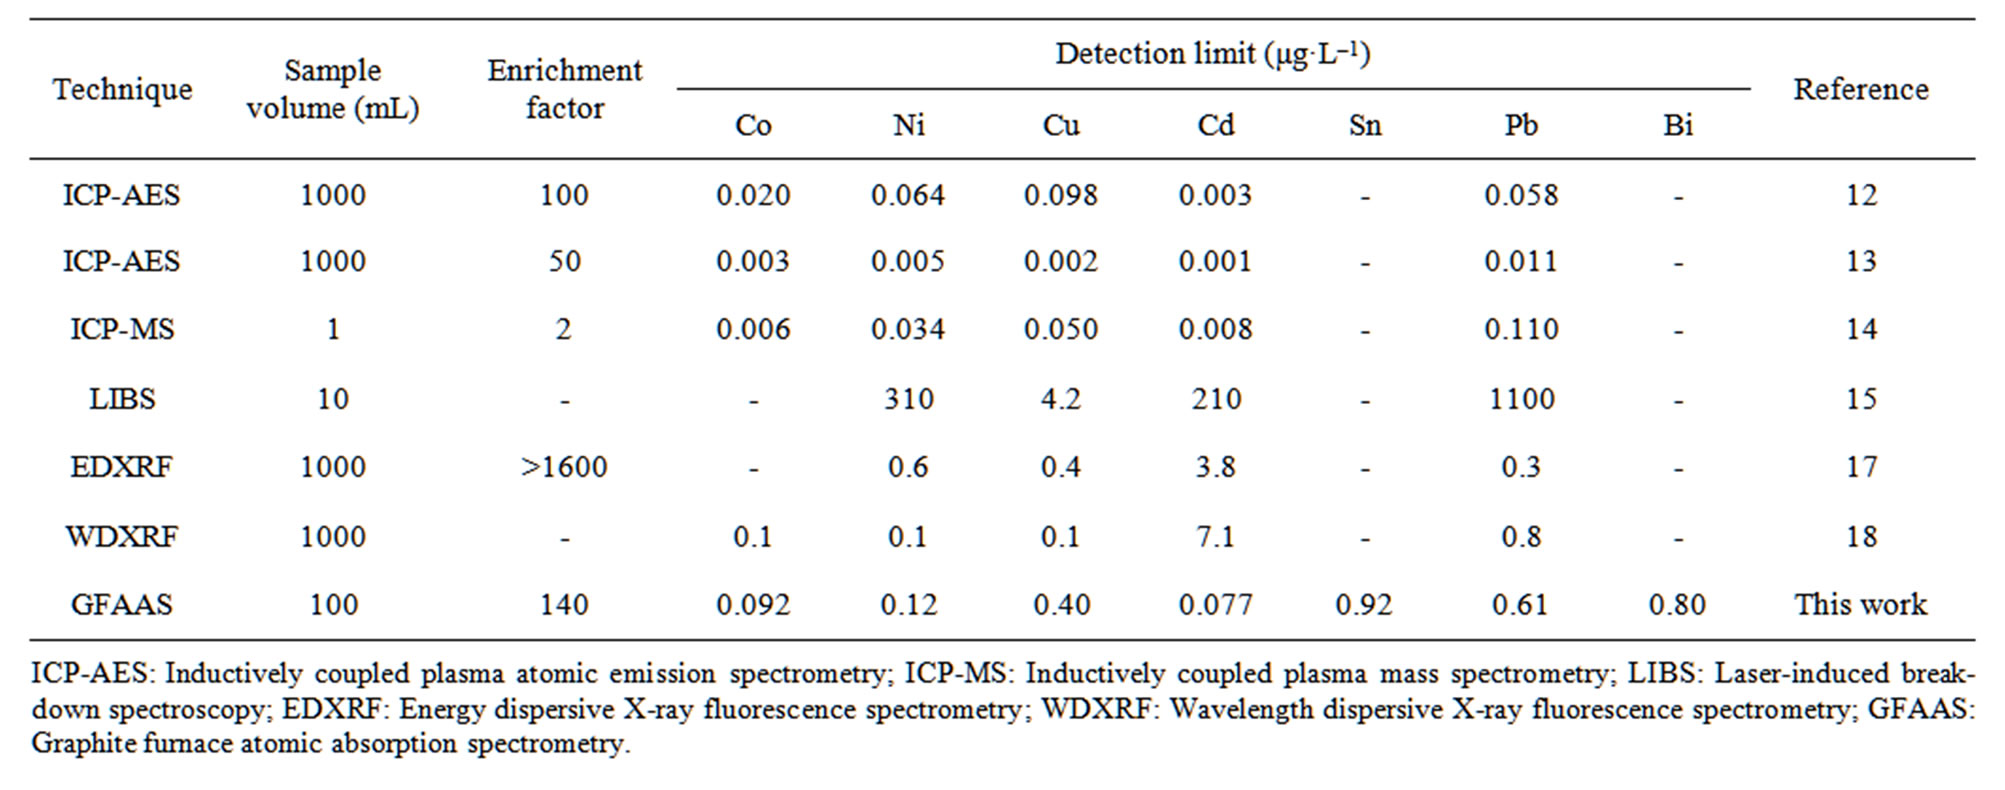
Table 3. Comparison of the detection limit of the proposed method with those of the published techniques for the determination of heavy metals in water using IED preconcentration.
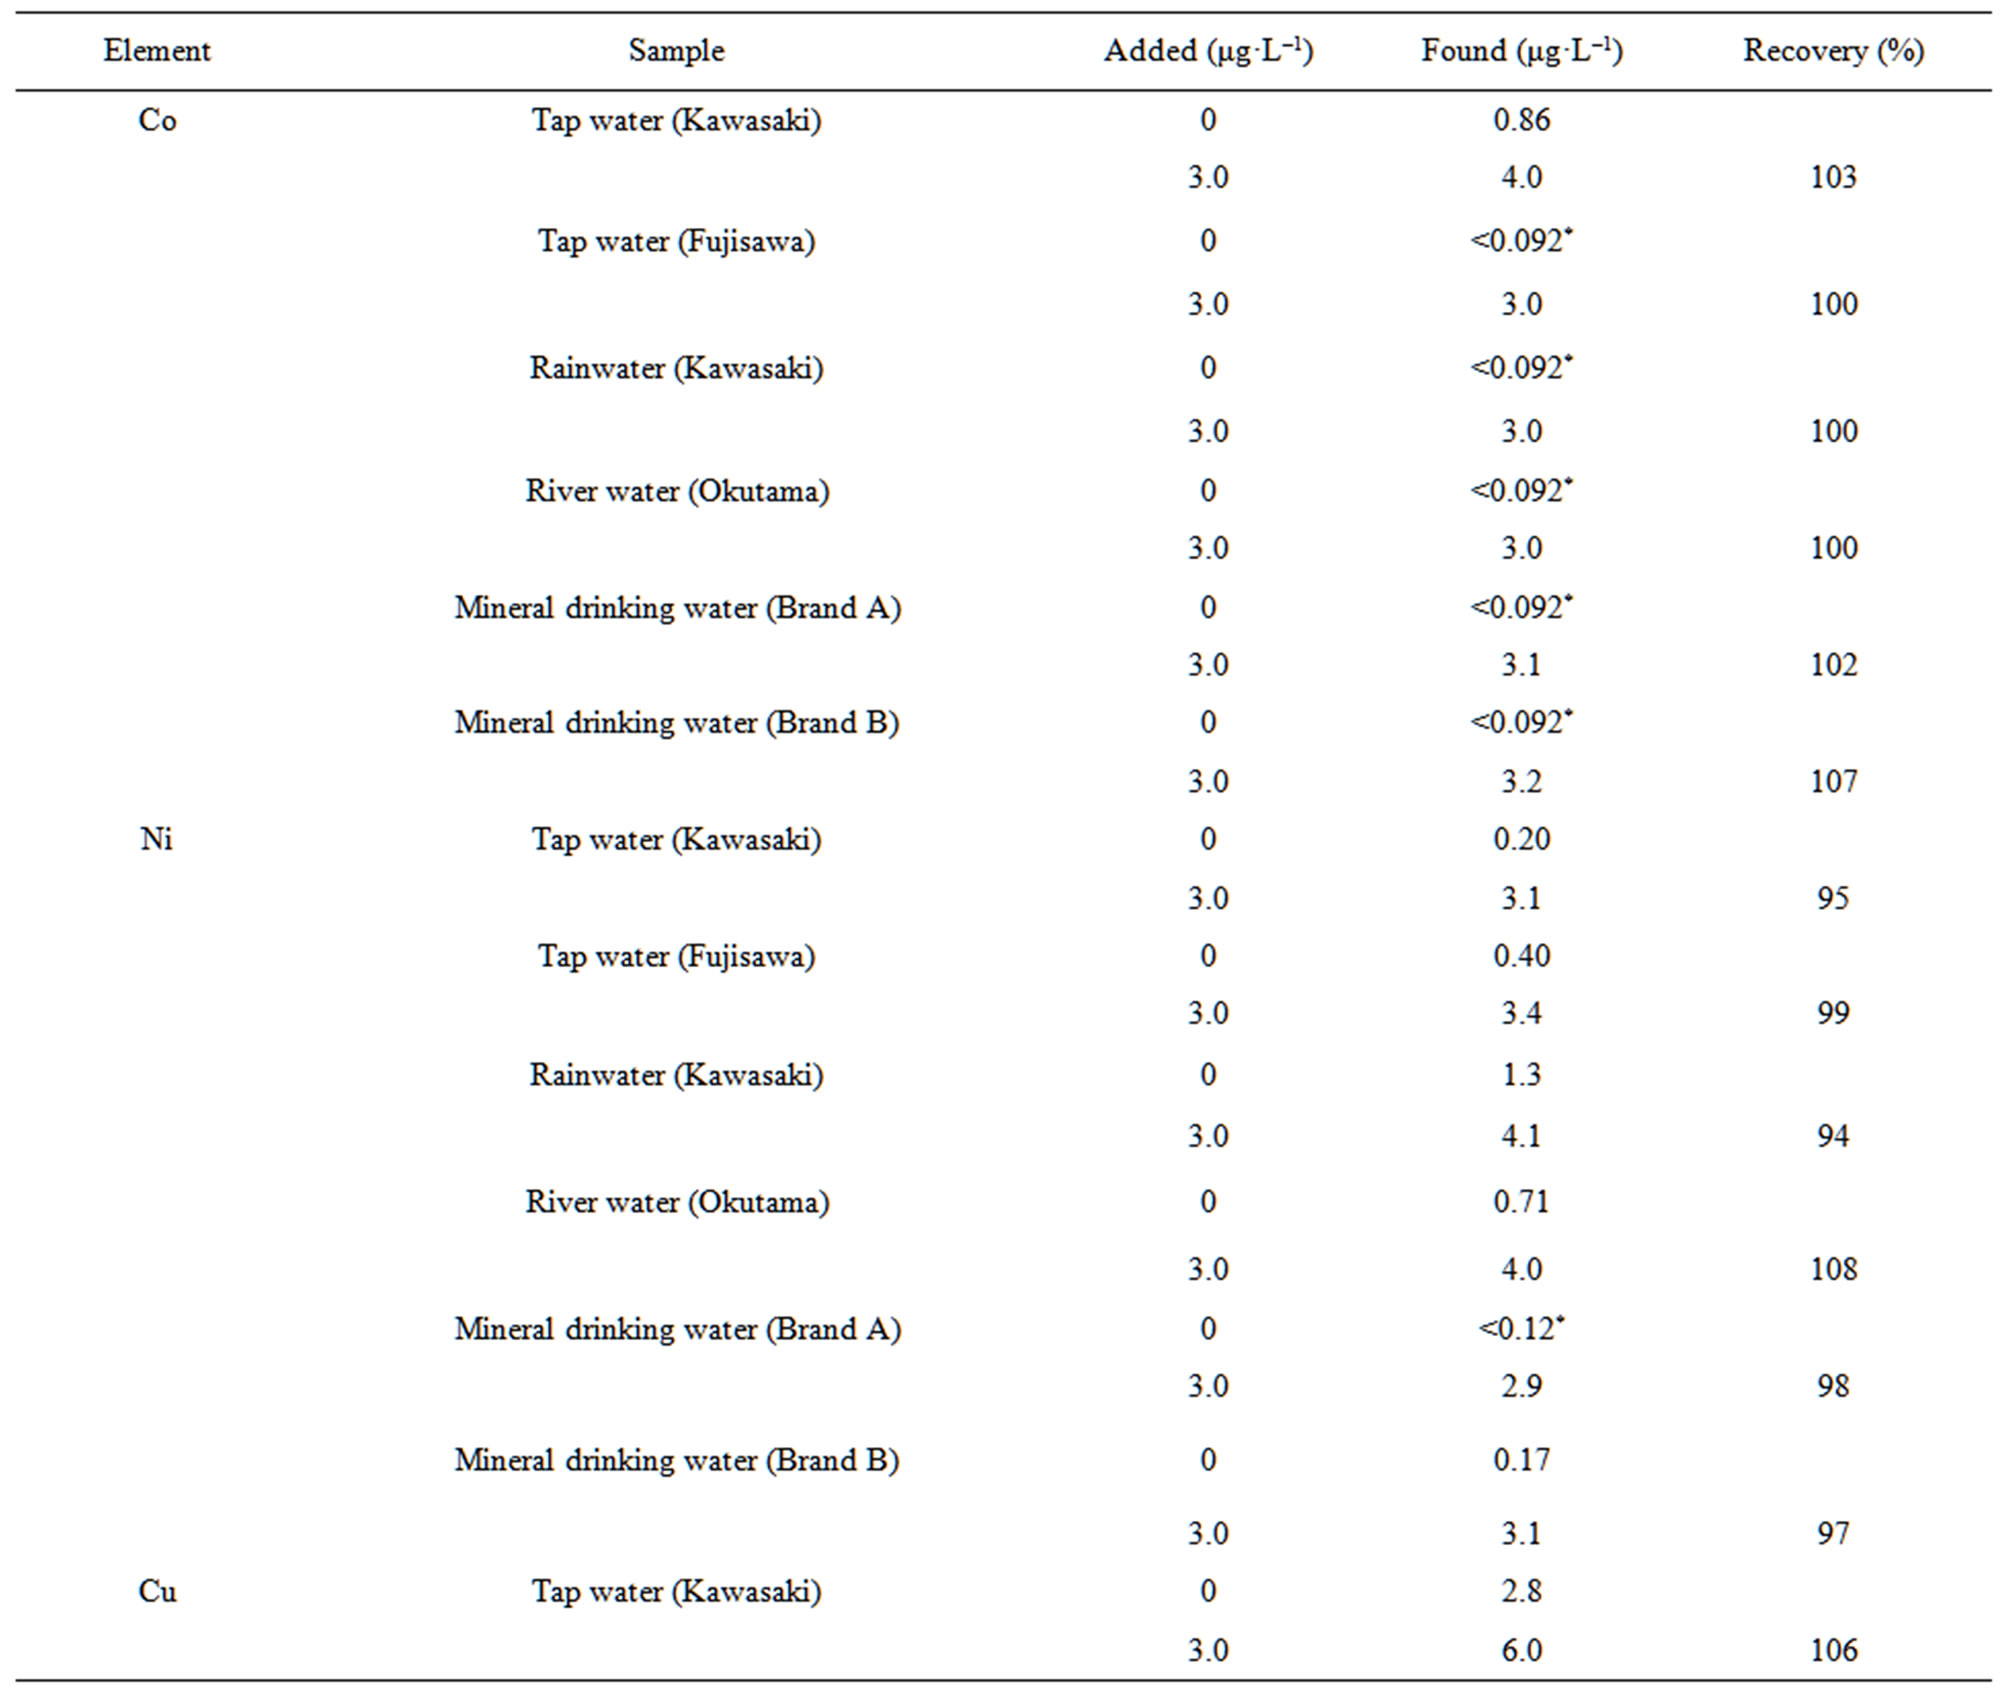
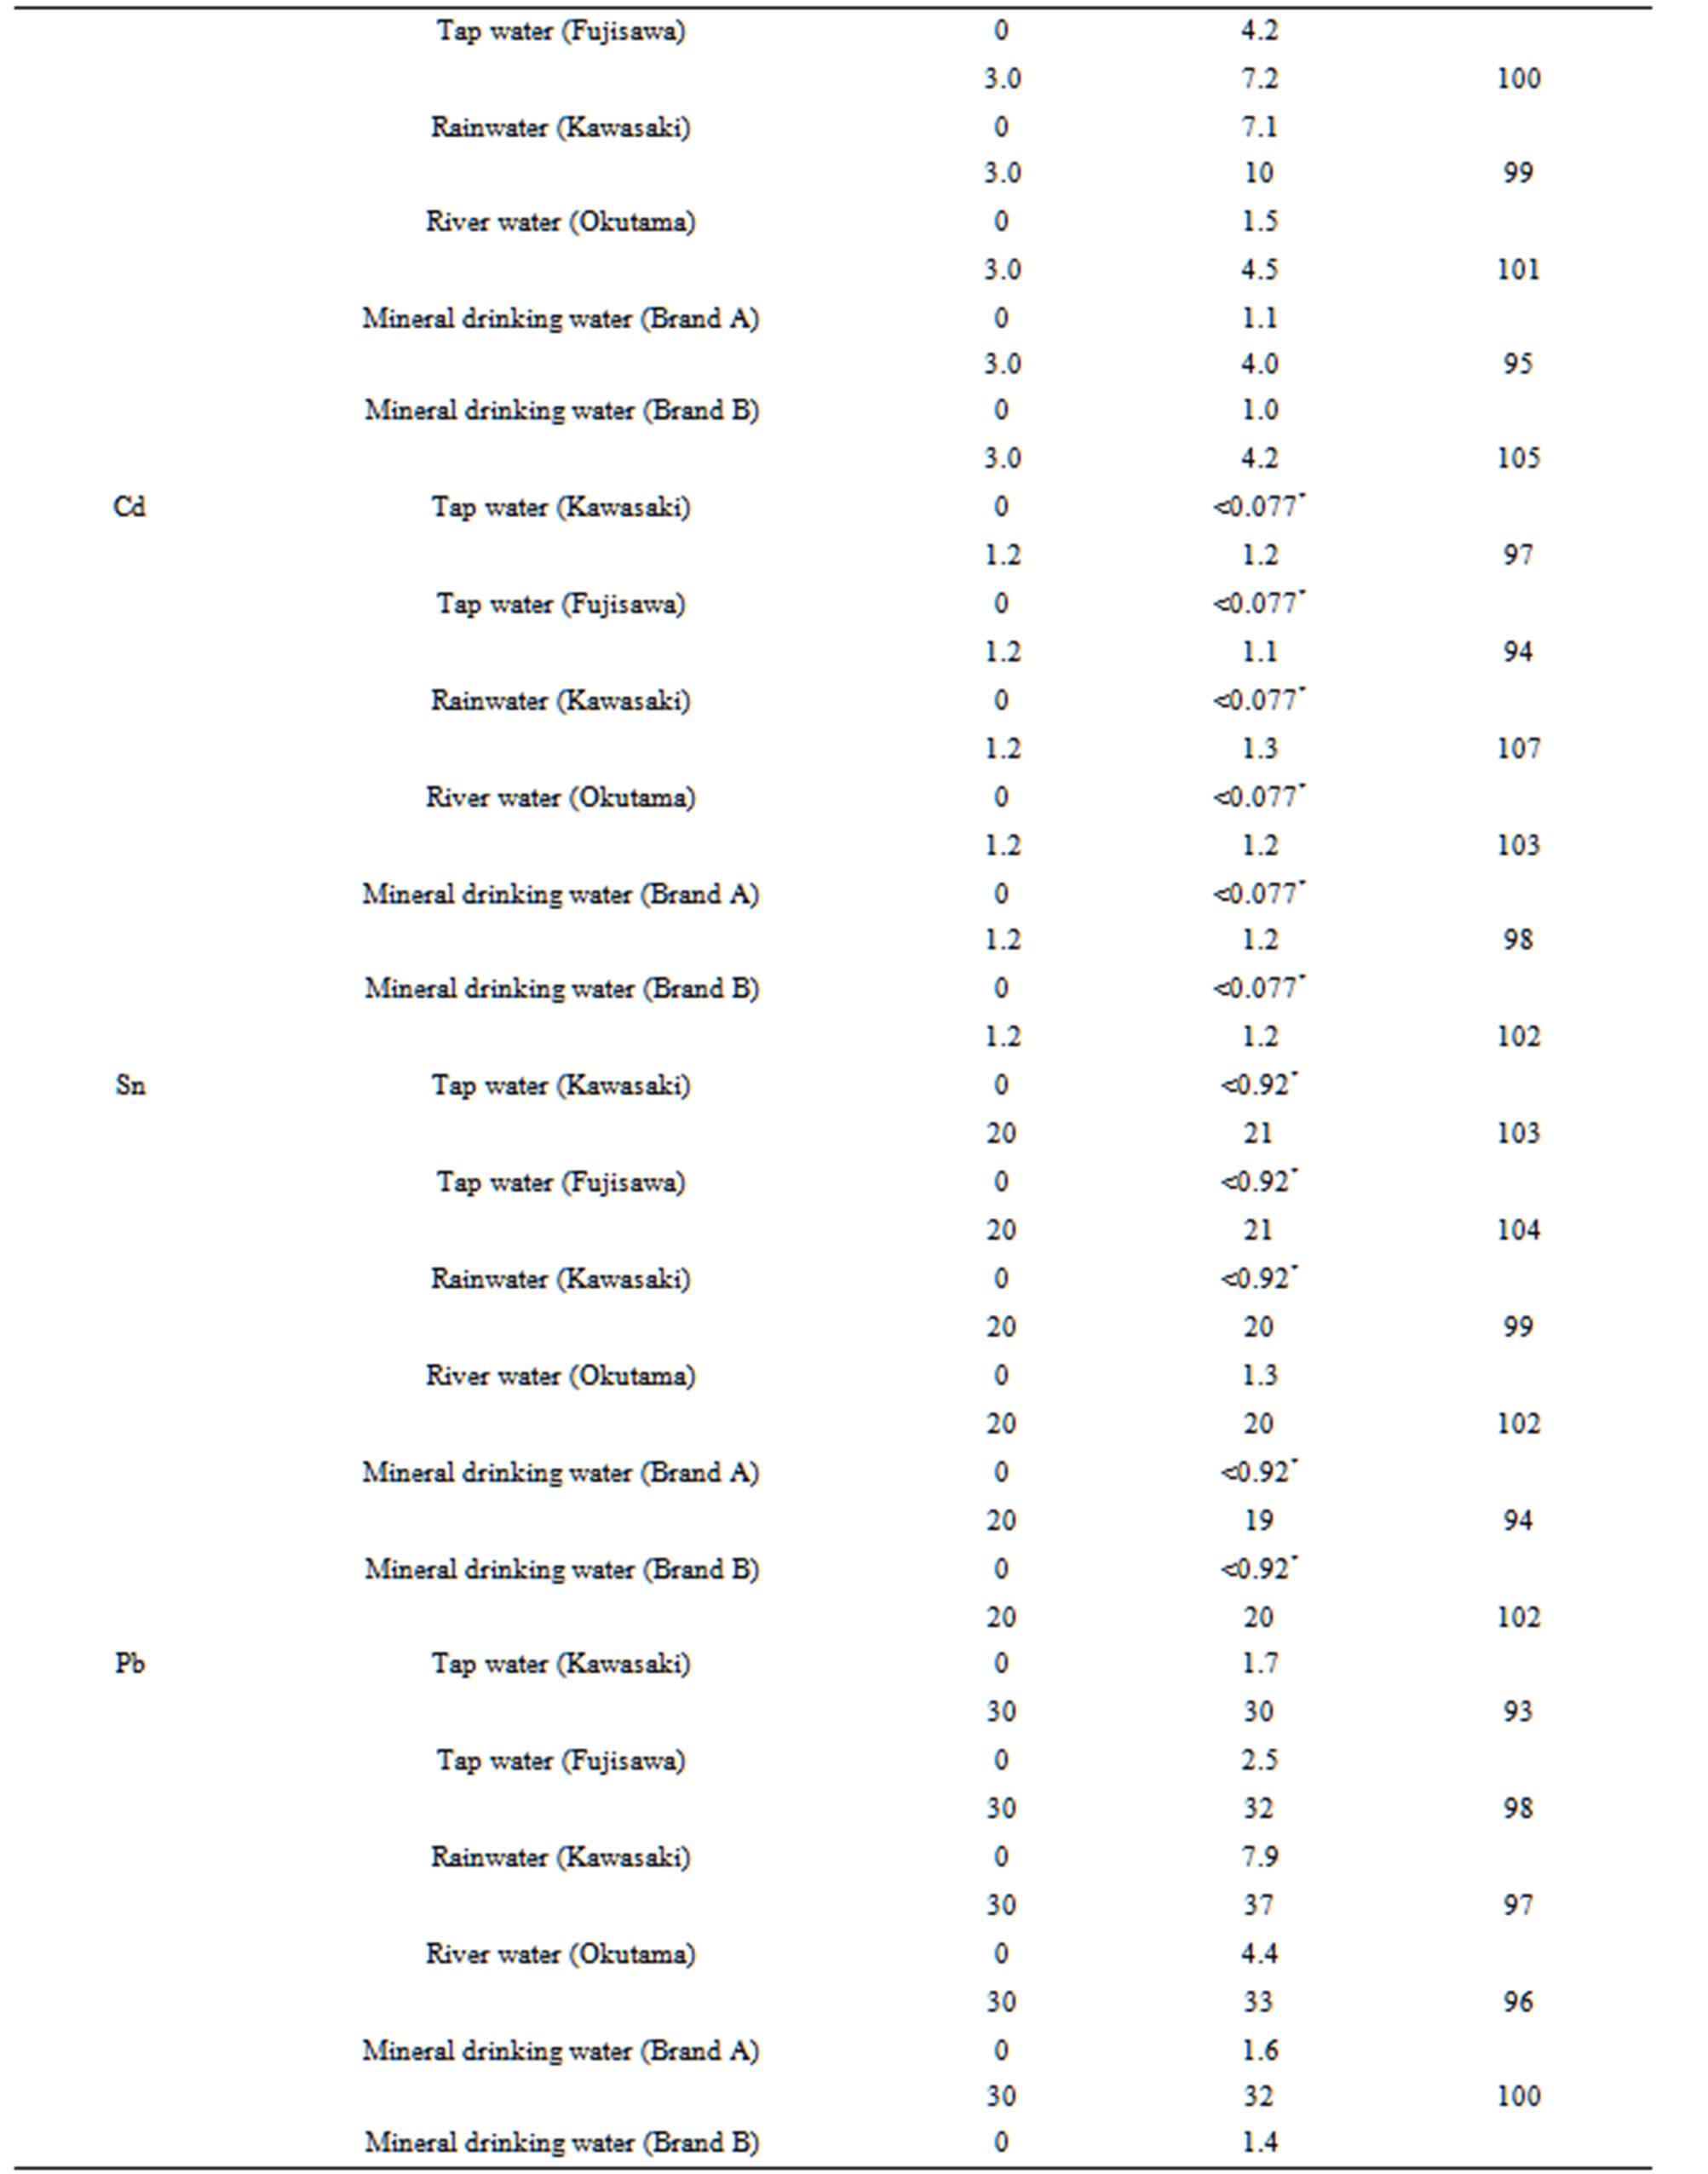
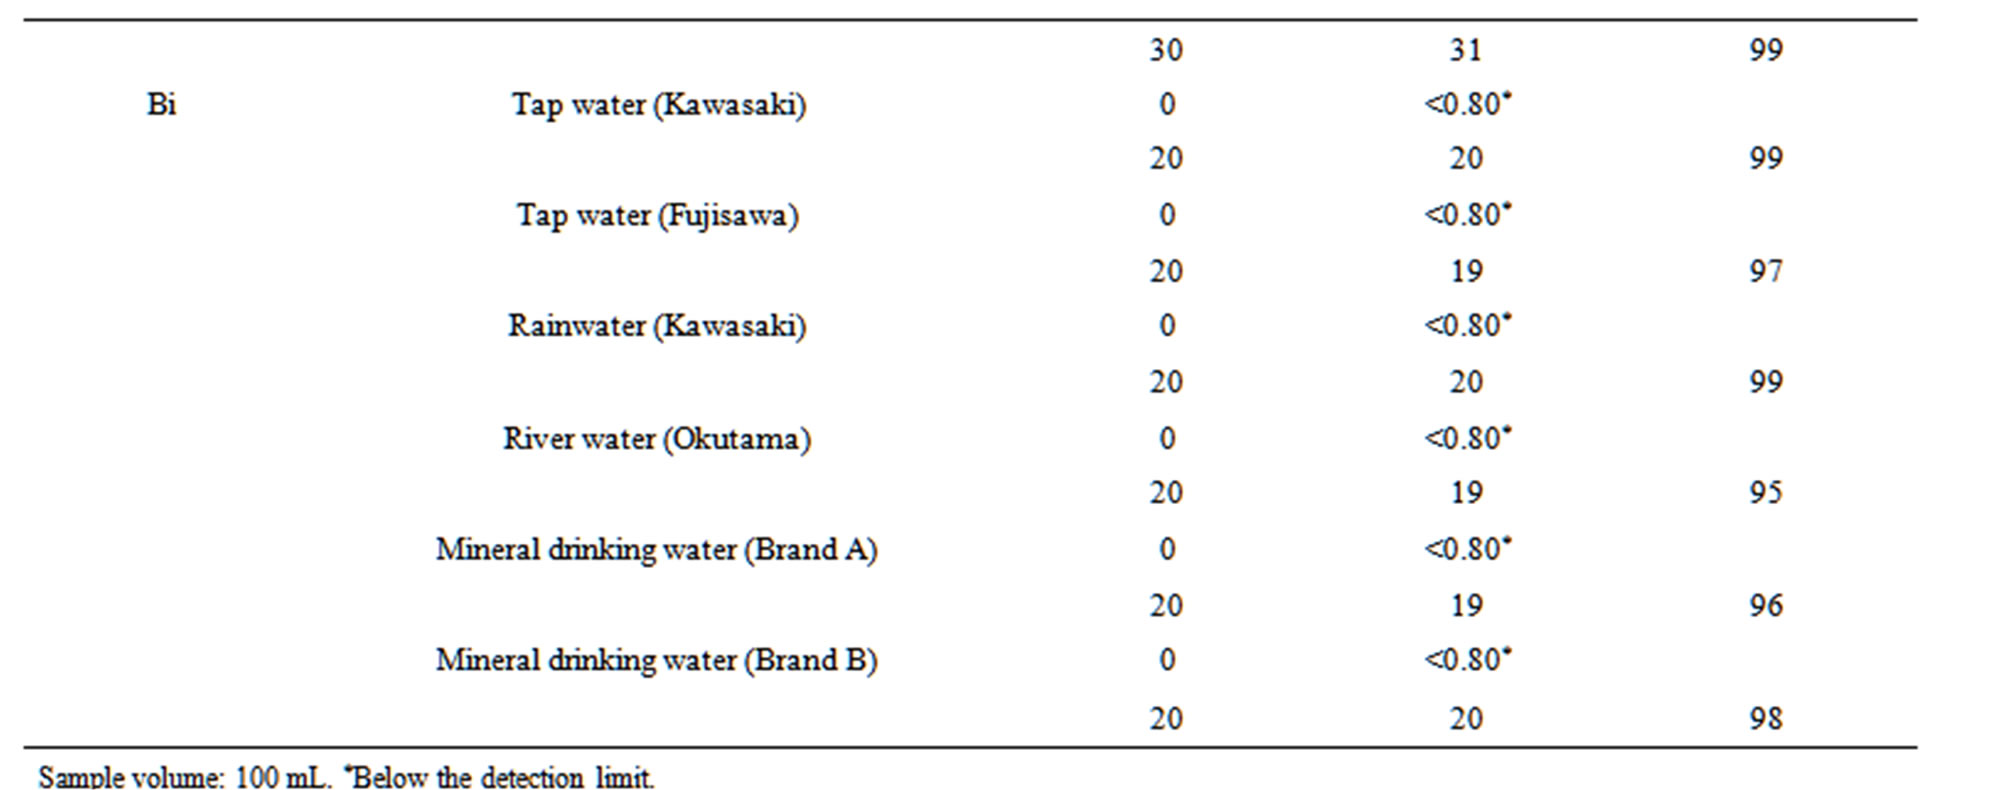
Table 4. Spike tests for Co, Ni, Cu, Cd, Sn, Pb, and Bi added to six water samples.
the determination of heavy metals at sub-ppb levels in water.
4. Conclusion
A direct analysis method combining IED with graphite furnace AAS was proposed for the determination of Co, Ni, Cu, Cd, Sn, Pb, and Bi at sub-ppb levels in water. An IED was used to preconcentrate the seven analytes. The seven analytes could be determined without an elution step by directly introducing a small disk (2 mm diameter) from the IED into the furnace. The slopes of the calibration curves established using the small disk agreed well with those established using an aqueous standard, which indicated that calibration against aqueous standards is feasible. When an enrichment factor of 140 was obtained using a 100-mL water sample, the detection limits were 0.092 mg·L–1 for Co, 0.12 mg·L–1 for Ni, 0.40 mg·L–1 for Cu, 0.077 mg·L–1 for Cd, 0.92 mg·L–1 for Sn, 0.61 mg·L–1 for Pb, and 0.80 mg·L–1 for Bi. A spike test for the seven analytes in tap water, rainwater, river water, and mineral drinking water showed quantitative recoveries (93% - 108%).
REFERENCES
- V. Camel, “Solid Phase Extraction of Trace Elements,” Spectrochimica Acta Part B: Atomic Spectroscopy, Vol. 58B, No. 7, 2003, pp. 1177-1233. doi:10.1016/S0584-8547(03)00072-7
- T. Miura, T. Morimoto, K. Hayano and T. Kishimoto, “Determination of Uranium in Water Samples by ICPAES with Chelating Resin Disk Preconcentration,” Bunseki Kagaku, Vol. 49, No. 4, 2000, pp. 245-249. doi:10.2116/bunsekikagaku.49.245
- Y. Takaku, Y. Kudo, J. Kimura, T. Hayashi, I. Ota, H. Hasegawa and S. Ueda, “Determination of Rare-Earth Elements in Environmental Water Using Chelating Resin Disk Separation/ICP-MS,” Bunseki Kagaku, Vol. 51, No. 7, 2002, pp. 539-544. doi:10.2116/bunsekikagaku.51.539
- Y. Koike, J. Sato and T. Nakamura, “Gamma-Ray Spectrometry of 210Pb in Rainwater Using Preconcentration with Iminodiacetate Extraction Disk,” Bunseki Kagaku, Vol. 53, No. 12, 2004, pp. 1469-1473. doi:10.2116/bunsekikagaku.53.1469
- T. Inui, K. Fujita, M. Kitano and T. Nakamura, “Determination of Cr(III) and Cr(VI) at Sub-ppb Levels in Water with Solid-Phase Extraction/Metal Furnace Atomic Absorption Spectrometry,” Analytical Sciences, Vol. 26, No. 10, 2010, pp. 1093-1098. doi:10.2116/analsci.26.1093
- T. Inui, W. Abe, M. Kitano and T. Nakamura, “Determination of Cr(III) and Cr(VI) in Water by WavelengthDispersive X-Ray Fluorescence Spectrometry after Preconcentration with an Ion-Exchange Resin Disk,” X-Ray Spectrometry, Vol. 40, No. 4. 2011, pp. 301-305. doi:10.1002/xrs.1317
- K. Kuriyama and Y. Kashihara, “Application of DiskFormat Solid Phase Extraction to Pesticide Analysis,” Kankyo Kagaku, Vol. 5, No. 4. 1995, pp. 807-819. doi:10.5985/jec.5.807
- C. Fujimoto and T. Yoshizawa, “Determination of Organochlorine Pesticides in Water Using Solid-Phase Extraction,” Kankyo Kagaku, Vol. 9, No. 1, 1999, pp. 11-21. doi:10.5985/jec.9.11
- A. Tanabe, T. Ibaraki, H. Yagoh, K. Kawata and M. Sakai, “Determination of Pesticides and Transformation Products in Environmental Water by Using a Membrane Extraction Disk,” Kankyo Kagaku, Vol. 9, No. 3, 1999, pp. 607-615. doi:10.5985/jec.9.607
- O. Kiguchi and K. Saitoh, “Simultaneous Determination of Polar and Nonpolar Pesticides in Water Samples by Solid-Phase Multilayered Disk Extraction Using Polystylene Gel and Activated Carbon Disk along with GC/MS,” Bunseki Kagaku, Vol. 49, No. 8, 2000, pp. 575-582. doi:10.2116/bunsekikagaku.49.575
- T. Wakui, H. Imura and K. Ohashi, “Solid-Phase Extraction and Concentration of Trace Chlorophenols with Extractant-Impregnated Membrane Disks,” Bunseki Kagaku, Vol. 52, No. 9, 2003, pp. 825-828. doi:10.2116/bunsekikagaku.52.825
- K. Kuriyama, T. Ouyang, N. Wang and Y. Furusho, “Rapid Extraction of Heavy Metals from Water Using Iminodiacetate Chelating Membrane,” Kogyo Yosui, Vol. 481, No. 11, 1998, pp. 29-36.
- T. Ouyang, N. Wang, K. Iwashima, K. Kuriyama and Y. Furusho, “Simultaneous Multi-Element Preconcentration in Aqueous Environmental Samples Using Iminodiacetate Extraction Disk (IED) Followed by ICP-AES Analysis,” Kankyo Kagaku, Vol. 9, No. 2, 1999, pp. 347-357. doi:10.5985/jec.9.347
- K.-H. Lee, M. Oshima and S. Motomizu, “Inductively Coupled Plasma Mass Spectrometric Determination of Heavy Metals in Sea-Water Samples after Pre-Treatment with a Chelating Resin Disk by an On-Line Flow Injection Method,” Analyst, Vol. 127, No. 6, 2002, pp. 769- 774. doi:10.1039/b201210n
- N. E. Schmidt and S. R. Goode, “Analysis of Aqueous Solutions by Laser-Induced Breakdown Spectroscopy of Ion Exchange Membranes,” Applied Spectroscopy, Vol. 56, No. 3, 2002, pp. 370-374. doi:10.1366/0003702021954746
- C. R. Dockery, J. E. Pender and S. R. Goode, “Speciation of Chromium via Laser-Induced Breakdown Spectroscopy of Ion Exchange Polymer Membranes,” Applied Spectroscopy, Vol. 59, No. 2, 2005, pp. 252-257. doi:10.1366/0003702053085061
- X. Hou, H. L. Peters, Z. Yang, K. A. Wagner, J. D. Batchelor, M. M. Daniel and B. T. Jones, “Determination of Trace Metals in Drinking Water Using Solid-Phase Extraction Disks and X-Ray Fluorescence Spectrometry,” Applied Spectroscopy, Vol. 57, No. 3, 2003, pp. 338-342. doi:10.1366/000370203321558263
- W. Abe, S. Isaka, Y. Koike, K. Nakano, K. Fujita and T. Nakamura, “X-Ray Fluorescence Analysis of Trace Metals in Environmental Water Using Preconcentration with an Iminodiacetate Extraction Disk,” X-Ray Spectrometry, Vol. 35, No. 3, 2006, pp. 184-189. doi:10.1002/xrs.892
- M. Resano, F. Vanhaecke and M. T. C. de Loos-Vollebregt, “Electrothermal Vaporization for Sample Introduction in Atomic Absorption, Atomic Emission and Plasma Mass Spectrometry a Critical Review with Focus on Solid Sampling and Slurry Analysis,” Journal of Analytical Atomic Spectrometry, Vol. 23, No. 11, 2008, pp. 1450-1475. doi:10.1039/b807756h
- M. Yamaguchi, N. Okubo, H. Yokoyama, T. Ui and E. Asada, “Determination of Lead in Airborne Particulates Using Direct Introduction of Filter Paper by Graphite Furnace Atomic Absorption Spectrometry,” Bunseki Kagaku, Vol. 31, No. 10, 1982, pp. 561-564. doi:10.2116/bunsekikagaku.31.10_561
- K. Nakano and S. Ichisugi, “Atomic Absorption Spectrometry of Silver Collected on Ion-Exchange Filter Paper by Directly Heating the Filter Paper,” Bunseki Kagaku, Vol. 34, No. 9, 1985, pp. 573-575. doi:10.2116/bunsekikagaku.34.9_573
- H. Kawai, Y. Katayama, Y. Ninomiya and J. Okuda, “Determination of Trace Metals in Polyethylene Terephtalate Films by Punched-Out Film Introduction/Graphite Furnace AAS,” Bunseki Kagaku, Vol. 43, No. 12, 1994, pp. 1193-1196. doi:10.2116/bunsekikagaku.43.1193
- A. Isozaki, Y. Morita, T. Okutani and T. Matsumura, “Direct Determination of Lead in Suspended Particulate Matter in Air by Tungsten Furnace-Atomic Absorption Spectrometry with a Punching Technique,” Analytical Sciences, Vol. 12, No. 10, 1996, pp. 755-759. doi:10.2116/analsci.12.755
- T. Nakamura, K. Okubo and J. Sato, “Atomic Absorption Spectrometric Determination of Copper in Calcium Carbonate Scale and Carbonate Rocks by Direct Atomization of Solid Samples,” Analytica Chimica Acta, Vol. 209, No. 1, 1988, pp. 287-292. doi:10.1016/S0003-2670(00)84574-2
- T. Nakamura, H. Oka, H. Morikawa and J. Sato, “Determination of Lithium, Beryllium, Cobalt, Nickel, Copper, Rubidium, Caesium, Lead and Bismuth in Silicate Rocks by Direct Atomization Atomic Absorption Spectrometry,” Analyst, Vol. 117, No. 2, 1992, pp. 131-135. doi:10.1039/an9921700131
- T. Nakamura, R. Sasagawa and J. Sato, “Determination of Manganese and Copper in Synthetic and Natural Quartz Samples by Direct Atomization-AAS,” Bunseki Kagaku, Vol. 41, No. 2, 1992, pp. 89-94. doi:10.2116/bunsekikagaku.41.2_89
- T. Nakamura, H. Oka, M. Ishii and J. Sato, “Direct Atomization Atomic Absorption Spectrometric Determination of Be, Cr, Fe, Co, Ni, Cu, Cd, and Pb in Water with Zirconium Hydroxide Coprecipitation,” Analyst, Vol. 119, No. 6, 1994, pp. 1397-1401. doi:10.1039/an9941901397
- T. Nakamura, Y. Noike, Y. Koizumi and J. Sato, “Atomic Absorption Spectrometric Determination of Copper and Lead in Silicon Nitride and Silicon Carbide by Direct Atomization,” Analyst, Vol. 120, No. 1, 1995, pp. 89-94. doi:10.1039/an9952000089
- T. Nakamura, T. Kusata, H. Matsumoto and J. Sato, “Atomic Absorption Spectrometric Determination of Cadmium and Lead in Human and Artificial Teeth by Direct Atomization Technique,” Analytical Biochemistry, Vol. 226, No. 2, 1995, pp. 256-262. doi:10.1006/abio.1995.1223
- K. Fujita and T. Nakamura, “Screening of Heavy Metals in Soil by Direct Sampling/Metal Furnace Atomic Absorption Spectrometry,” Bunseki Kagaku, Vol. 58, No. 7, 2009, pp. 609-615. doi:10.2116/bunsekikagaku.58.609
- K. Matsumoto, “Palladium as a Matrix Modifier in Graphite-Furnace Atomic Absorption Spectrometry of Group IIIB-VIB Elements,” Analytical Sciences, Vol. 9, No. 4, 1993, pp. 447-453. doi:10.2116/analsci.9.447
- F. J. Fernandez, S. A. Myers and W. Slavln, “Background Correction in Atomic Absorption Utilizing the Zeeman Effect,” Analytical Chemistry, Vol. 52, No. 4, 1980, pp. 741-746. doi:10.1021/ac50054a033
- A. Komatsu, M. Kitano and T. Nakamura, “Determination of Hazardous Metals in Plastics by Metal Furnace Atomic Absorption Spectrometry with Direct Solid-Sampling Technic,” Bunseki Kagaku, Vol. 58, No. 9, 2009, pp. 785-791. doi:10.2116/bunsekikagaku.58.785
- S. Morimoto, T. Ashino and K. Wagatsuma, “Role of a Binary Metallic Modifier in the Determination of Cadmium in Graphite Furnace Atomic Absorption Spectrometry,” Analytical Sciences, Vol. 26, No. 7, 2010, pp. 809- 813. doi:10.2116/analsci.26.809
NOTES
*Corresponding author.