American Journal of Analytical Chemistry
Vol. 3 No. 8 (2012) , Article ID: 21908 , 4 pages DOI:10.4236/ajac.2012.38067
Simultaneous Quantification of Ibuprofen and Paracetamol in Tablet Formulations Using Transmission Fourier Transform Infrared Spectroscopy
National Centre of Excellence in Analytical Chemistry, University of Sindh, Jamshoro, Pakistan
Email: chemist_ali2007@yahoo.com, *tufail.sherazi@yahoo.com, mahesar_sarfaraz@yahoo.com, jani_rauf@yahoo.com
Received May 17, 2012; revised June 21, 2012; accepted June 29, 2012
Keywords: Transmission FTIR; Pharmaceutical Formulation; Ibuprofen; Paracetamol; Simultaneous Determination; Quantitative Analysis
ABSTRACT
A very simple, non-destructive, inexpensive and green strategy was applied for the simultaneous determination of ibuprofen (IBP) and paracetamol (PC) using transmission Fourier Transform Infrared (FTIR) spectroscopy in tablet formulations for routine quality control laboratories. For the determination of the active pharmaceutical ingredients (API), KBr pellets containing known amount of standards and samples were used for acquisition of the FTIR spectra. The partial least squares (PLS) calibration model was developed using the spectral region from 1781 - 1683 cm−1 for IBP and 1630 - 1530 cm−1 for PC. The excellent coefficients of determination (R2), 0.9999 and 0.9998 were achieved for IBP and PC, respectively. The accuracy of calibration model was also verified through root mean square error of cross validation (RMSECV) which was found to be 0.064. This work clearly shows the capability of transmission FTIR spectroscopy for assessment of exact quantity of API to control the quality of finished products as well as during processing in pharmaceutical industries without involvement of any solvent.
1. Introduction
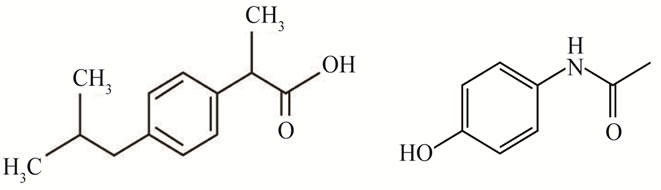
Non-steroidal anti-inflammatory drugs (NSAIDs) are widely used for curing mild as well as severe inflammatory diseases like rheumatoid arthritis, osteoarthritis, ankylosing spondylitis, and bartter’s syndrome. PC and IBP are more frequently prescribed as these are effective anti-inflammatory, analgesic and antipyretic medicine with considerably less gastrointestinal adverse effect than other NSAIDs [1-3]. PC is common analgesic and anti-pyretic drug that is used for the relief of fever, headaches and other minor aches and pains [4,5]. IBP has shown good efficacy against gouty arthritis, psoriatic arthritis and ankylosing spondylitis. It also controls pyrexia and relieves the swelling or pain due to sprains and strains specially sports injuries [6-8] (Figure 1).
The analysis of PC and IBP either in individual form or in binary mixture has been usually and routinely carried out by titrimetry [9], spectrophotometry [10-12], derivative spectrophotometry [13,14], spectrofluorimetry [15,16], electrophoresis [17,18], voltametry [19,20], high performance liquid chromatography [21,22] and liquid chromatography/mass spectrometry (LC/MS) [23,24]. All these techniques require lengthy procedures and some amount of the organic solvents contributing towards high cost of the analysis and generating waste. FTIR spectroscopy is a simple, rapid and non-destructive technique which is playing a great role for the rapid determination of various components present in the simple as well as complex matrices [25-27]. Initially FT-IR Spectroscopy was considered as a qualitative too but since last two decades tremendous quantitative work has been published. The FTIR group of National Centre of Excellence in Analytical Chemistry (NCEAC) has already
 (a) (b)
Figure 1. Chemical structure of (a) paracetamol and (b) ibuprofen.
developed the methods using SB-ATR-FTIR spectroscopy for the assessment of different quality parameters of oils and fats [28-34].
Thus FTIR spectroscopy along with chemometrics can be applied efficiently from raw material identification to final product analysis of pharmaceutical formulations. Non-destructive and fast analytical nature of FTIR spectroscopy can be exploited in an advantageous manner in wide range of applications in modern industries. In spectral analysis quantitative calibration techniques like chemometrics has been regarded as an important tool while monitoring quality and quantity of drugs in pharmaceutical formulations or biological systems, as it provides the advantage of not requiring any separation procedure in analysis of two or more drugs having spectral overlapping.
In this work, a solvent free, rapid, inexpensive and green method has been described for the simultaneous determination of PC and IBP using FTIR in multi-component pharmaceutical formulations for routine quality control. This method uses unique approach of analysing real sample in its original form with no sample preparation. It requires only grinding of sample for pellet formation.
2. Experimental
2.1. Standards and Samples
Ibuprofen (Assay 99.9%) and paracetamol standard (Assay 99.9%) for the present study to establish calibration was purchased from Sigma-Aldrich. KBr used to formulate standard and sample pellets was of spectroscopic grade. The different solid pharmaceutical formulations having PC and IBP as API were purchased from local drug stores and pharmaceutical laboratories.
2.2. Optimization of FT-IR Spectral Features
Thermo Nicolet 5700 FT-IR spectrometer equipped with removable KBr optics and deuterated triglycine sulphate (DTGS) detector was used for recording infrared spectra of standards and samples. All the spectra were recorded in the form of pellet. All spectra were acquired in Mid Infrared region i.e. 4000 - 400 cm−1 at a nominal resolution of 8 cm−1 accumulating 32 scans per spectrum. The fresh background spectrum from KBr pellet was taken every time before recording standard as well as sample spectra under the same instrumental conditions.
2.3. FT-IR Calibration Study
A stock solution of equal concentration of PC and IBP mixture in KBr was prepared. Then set of 25 standards of PC and IBP mixture with varying concentrations in the range of 0.001 mg to 1.0 mg in KBr pellet were prepared and run on FTIR. By the use of TQ Analyst software 7.2 (Thermo Electron Corporation, Madison, WI, USA, 2004), multivariate calibration model PLS based on standard spectra was developed. Specific region of 1781 - 1683 cm−1 for IBP and 1630 - 1530 cm−1 for PC was selected for best results.
2.4. Sample Preparation Procedure
In this method except grinding no prior sample treatment is required for FT-IR run. The pharmaceutical samples were accurately weighed and grinded in mortar until fine powder was obtained. 1 mg sample was weighed and 99 mg of dried and powdered KBr was added to prepare KBr pellets, then thoroughly mixed in order to homogenise the mixture. Afterwards, the pellet was condensed in the 13-mm die at a pressure of 5 tons for 3 min. Each time pellet was made of 100 mg and same pressure was applied to ensure the homogeneity. These pellets were scanned from 4000 to 400 cm−1 on FTIR to record spectra.
2.5. Limit of Detection and Quantification
The limit of detection (LOD), described as the minimum concentration from which it is possible to deduce the presence of the analyte with reasonable statistical certainty. To determine the limit of detection (LOD) and limit of quantification (LOQ) of proposed method, the selected band area was measured at low concentrations of standards, until the component related signal disappeared [35]. The analysis at the lowest amount which produced substantial signal was repeated eleven times and calculated by the following formula:
LOD = 3 × SD × C/M
where: SD is the standard deviation; C is the concentration of analyte and M is the mean band area.
While LOQ was determined by the same way with following equation:
LOQ = 10 × SD × C/M
2.6. Recovery Efficiency and Method Validation
In order to validate the results obtained by applying newly developed method, recovery studies were performed by standard addition method to ensure that the pharmaceutical laboratory will obtain accurate results in routine quality control analysis. In this study, various concentrations of standards i.e. (10, 20 and 50 mg) were added to a pharmaceutical sample with known concentration and then the total concentration was determined using the proposed method. The recovery efficiency (RE) was determined using following equation [28,29]:
RE (%) = (C – B/A) ×100
where, RE= amount of PC and IBP recovered (%),
B = actual concentration present in the sample before addition,
C = concentration of PC and IBP after addition,
A = amount added to sample.
3. Results and Discussion
The outcome of this work brings about considerable benefits in terms of speed, ease and expediency by the use of FT-IR spectroscopy for calculating the amount of the desired active specie during quality control analysis of pharmaceuticals. Figure 2 shows the group FTIR spectra of PC and IBP standards in varying concentration used for the calibration. In this method Transmission mode of FTIR is preferred because of the two main difficulties associated with ATR-FTIR mode. One is the less sensitivity owing to the short path length of ATR cell (~2 - 4 cm−1) in comparison to transmission mode and other is development of accurate calibration curve on ATR crystal, especially in the case of present study for the solid standards of various concentrations. Therefore, transmission FT-IR is the excellent choice for the accurate determination of two drugs simultaneously without using any solvent.
3.1. PLS Calibration Model
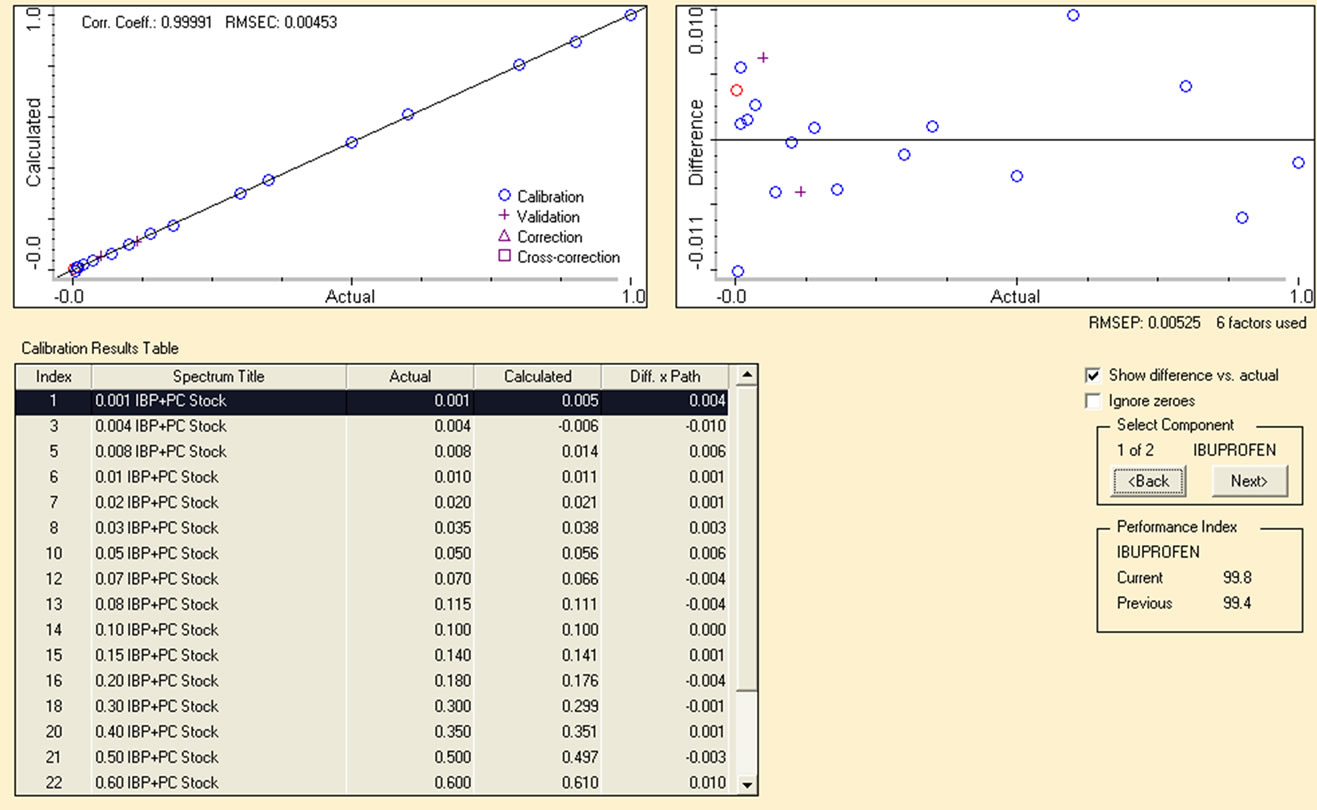
After acquiring FTIR spectra of the mixture of drugs, PLS model was applied to establish calibration for the quantitative determination of PC and IBP in pharmaceutical formulations. The region of 1630 - 1530 cm−1 for PC and 1781 - 1683 cm−1 for IBP was selected from the same spectra corrected with two point baseline identical to the region. The remarkable correlation coefficients (R2) were achieved 0.9998 and 0.9999 respectively between actual and predicted values with very small values of RMSEP, RMSEC and RMSECV 0.00525, 0.00453 and 0.064 for IBP and 0.0213, 0.00645 and 0.064 for PC respectively. The excellent calibration curve and a % difference plot between the actual and calculated values for calibration standards are displayed in Figure 3 accordingly.
From the % difference plot it is clearly evident that the calibrated model has predicted concentration of analytes absolutely well as calculated values are scattered within a narrow concentration range of 0.01% to 0.04% as compared with the original concentration. This indicates very good accuracy of the calibration of standards by applying multivariate chemometric model. Figure 4 is the extended form of FTIR spectra showing PLS region selected for the quantification of PC and IBP. PLS covers a specific region and extracts full information from all the absorption bands present within it to ensure reliability of the data obtained from each region under same optimized conditions.
3.2. Interference Study
The main idea behind the work was to achieve a green method avoiding lengthy extraction procedures and minimise the use of hazardous chemicals. As the formulation also contains other components along with active ingredient, hence the effect of some excipients commonly used in these pharmaceutical samples were analyzed. The spectra were taken containing the same ratio of the drug and active ingredients. It can be clearly seen from the Figure 5 that the IR bands present in the mixture of the PC and IBP standards have no any interference effect from the absorption bands present in mixture of excipients i.e. starch, magnesium stearate, lactose, avecil and talcum powder because there is no any overlap. The region selected for the quantitative analysis in the standard as well as in sample remains unaffected hence method
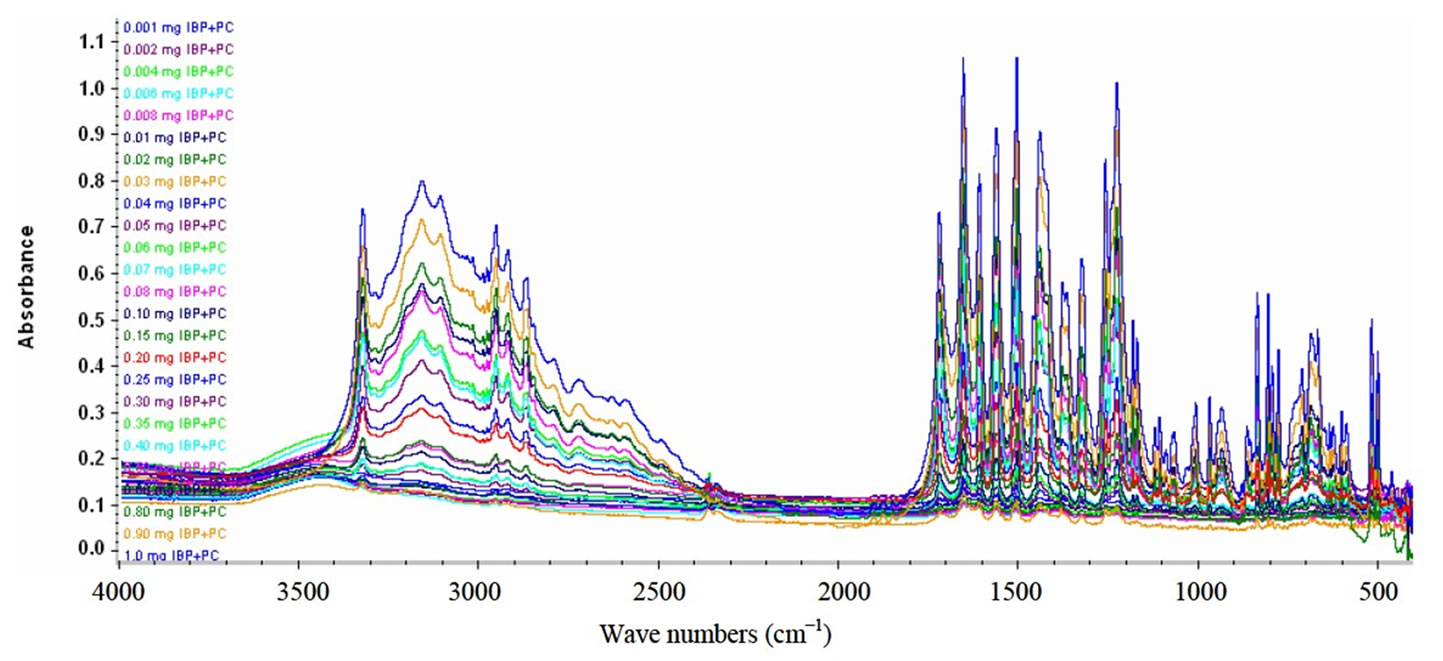
Figure 2. Group FT-IR spectra of PC and IB standards.
 (a)
(a)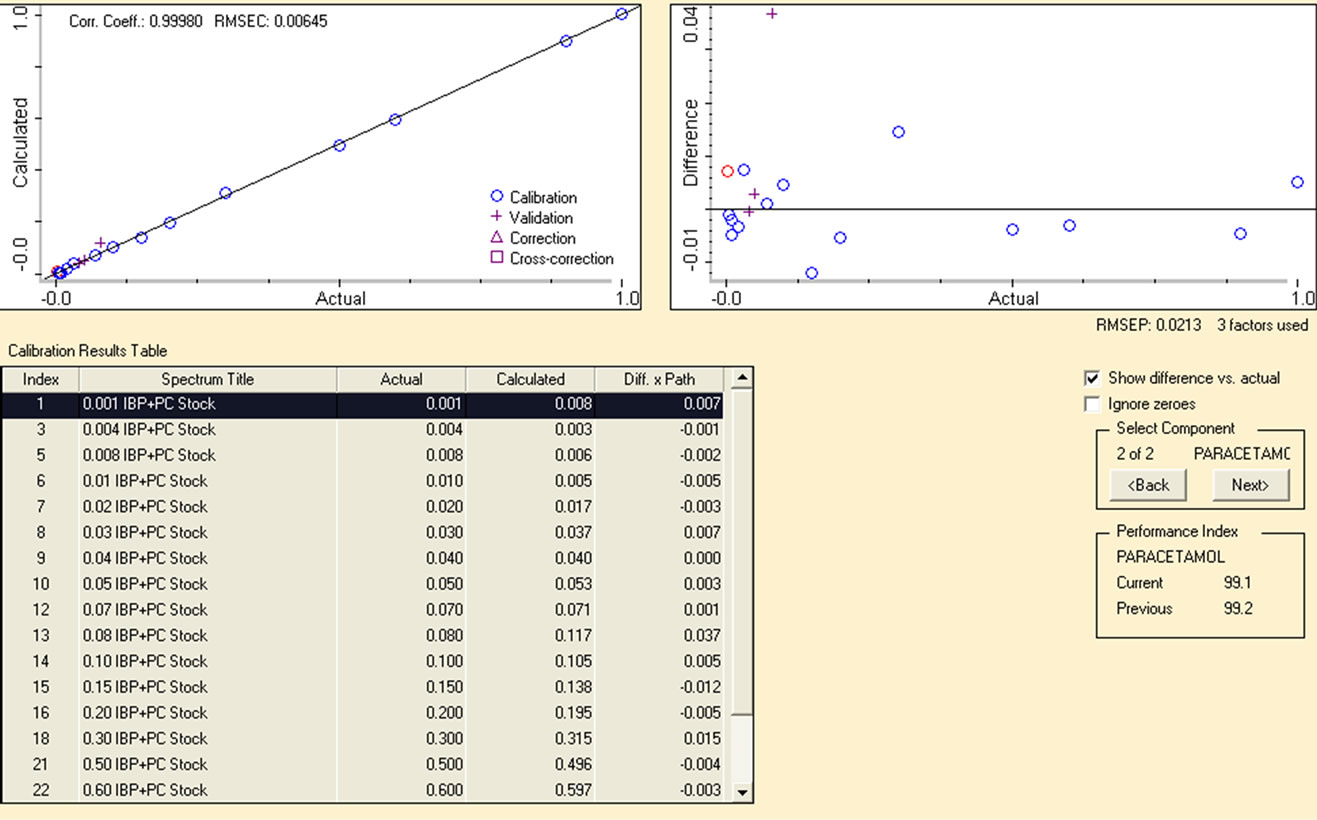 (b)
(b)
Figure 3. (a) Calibration curve for IBP in region 1781 - 1683 cm−1; (b) Calibration curve for PC in range of 1630 - 1530 cm−1.
proves to be practical making the strategy successful.
The regression equation obtained from the calibration was subsequently utilized for the calculation of concentration of PC and IBP in the real samples. The resulting concentrations found in pharmaceutical formulations by applying newly developed method are summarized in Table 1. The measured concentrations of API in analyzed samples manufactured by different commercial
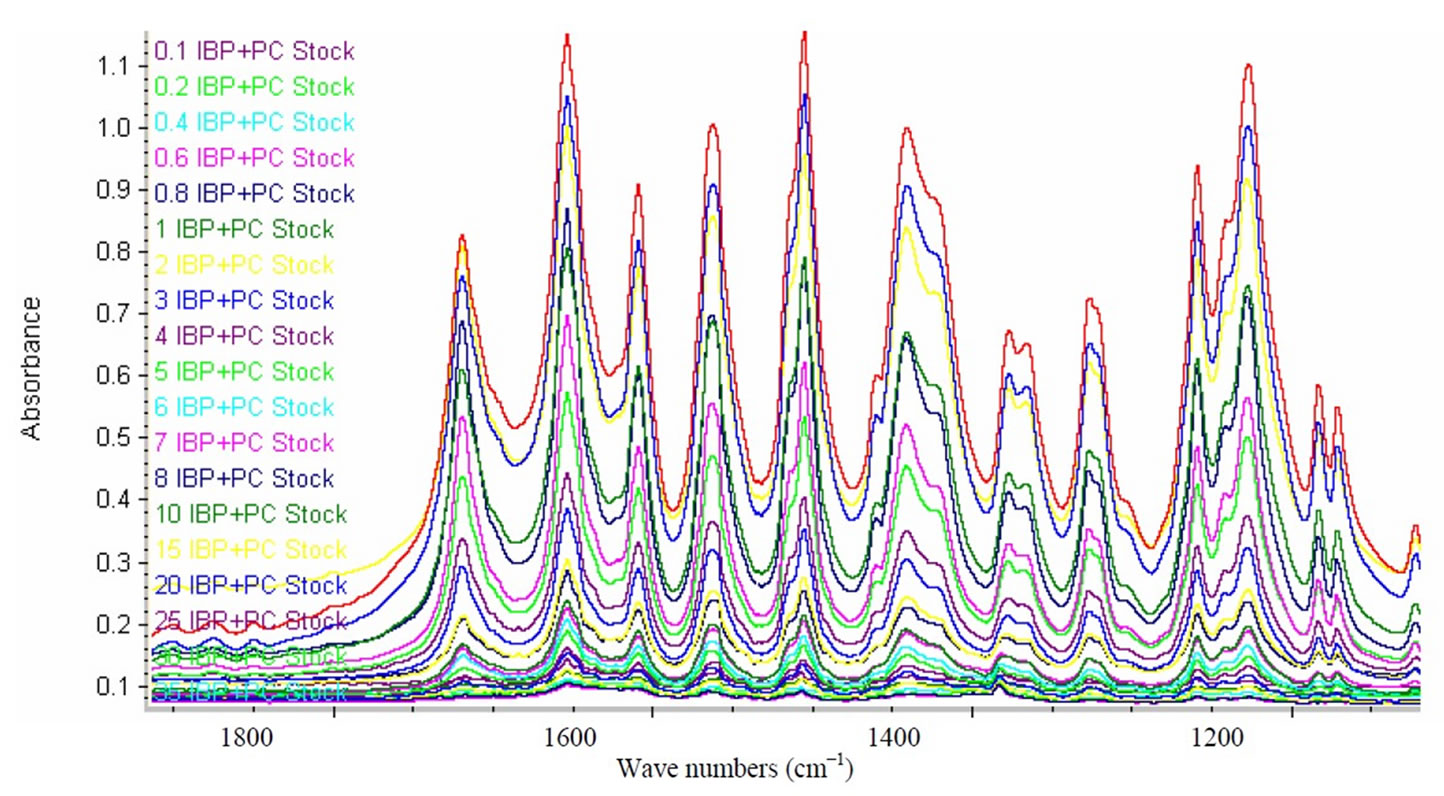
Figure 4. FTIR region selected for PLS calibration.
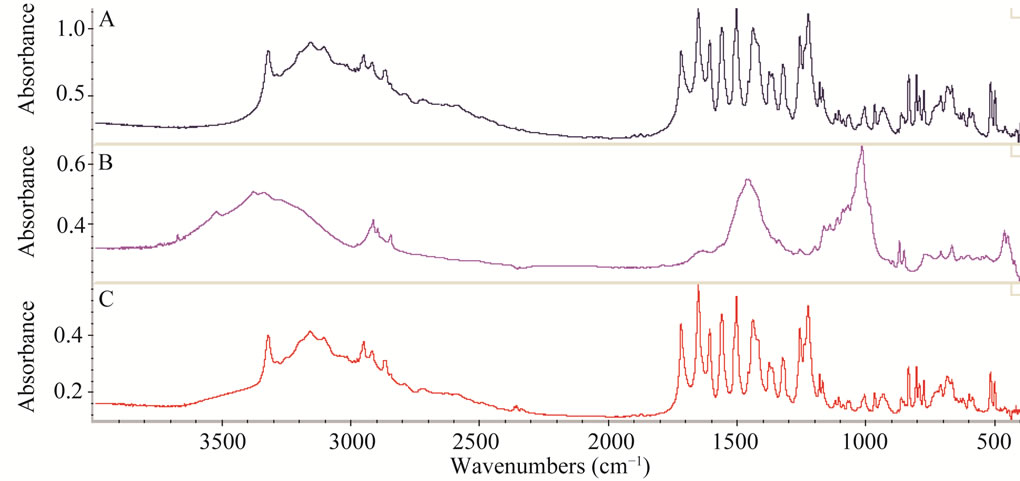
Figure 5. Three FTIR spectra where A is for standard PC and IBP mixture, B is for mixture of excipients i.e. starch, magnesium stearate, lactose, avecil and talcum powder and C is for pharmaceutical sample containing combination of IBP and PC as active.
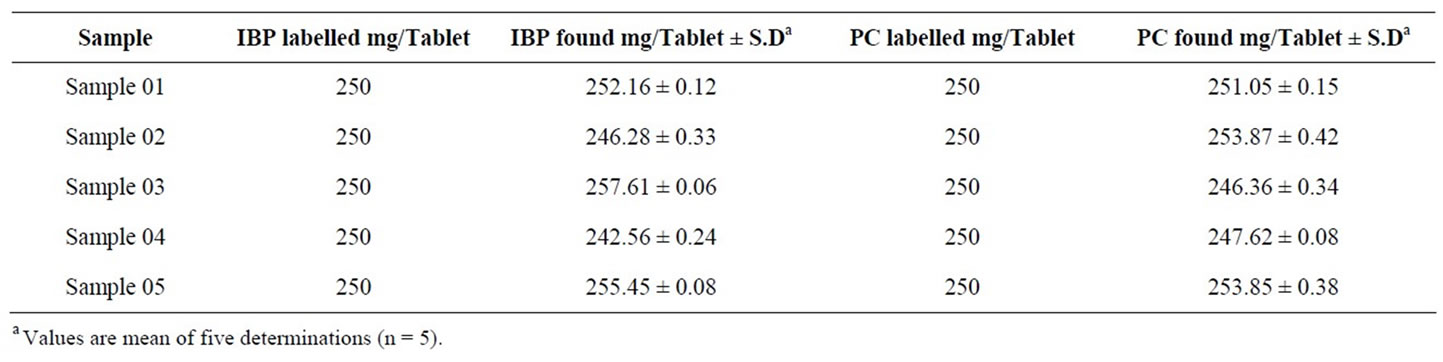
Table 1. Summary of results for the PC and IBP concentration found in various commercial brands.
laboratories were found to be between 97.02% to 103.04%, which are in good agreement of the labelled contents. These results were well within the permissible limits of the pharmacopoeia.
Figure 6 shows three spectra of 0.1 mg IBP, 0.1 mg PC and 0.1 mg mixture of both drugs. This indicates that region selected for IBP contains no band in PC spectrum and the region selected for PC exhibits no band in IBP
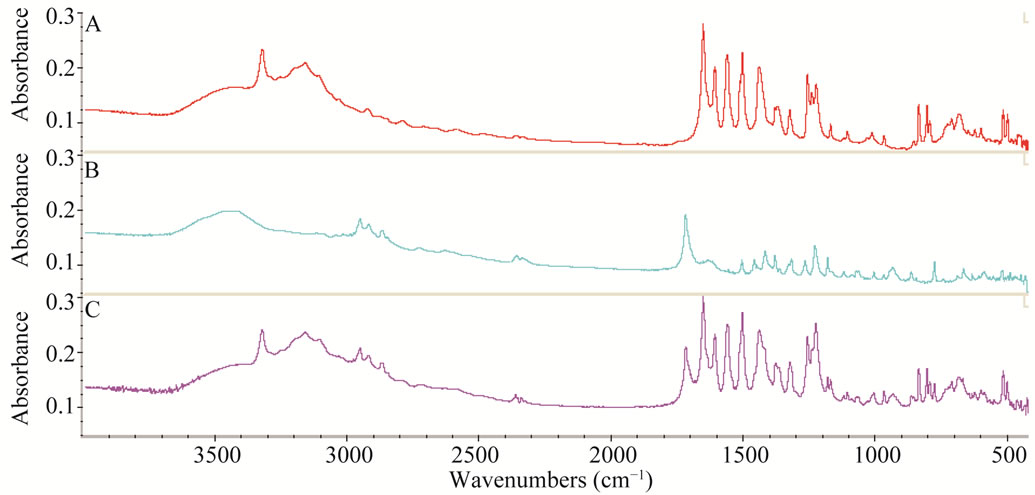
Figure 6. Three FTIR spectra A = 0.1 mg IBP, B = 0.1 mg PC and C = 0.1 mg mixture of both drugs respectively.
spectrum while binary mixture contains both bands in the range which are well separated prominent bands. Therefore, it becomes quite easy to determine the concentration of the both analytes from a single spectrum.
3.3. Method Validation
For the validation of the method and to evaluate the accuracy of the proposed method recovery efficiency was checked through standard addition method on one preanalyzed selected sample. The results of the standard addition method given in Table 2 were found to be highly accurate and precise. The recovery values (98.70% to 101.20%) with very low standard deviation prove the method to be feasible for routine analysis in pharmaceutical laboratories. The acceptable recovery range as per AOAC guidelines for single laboratory validation is 90% - 108% [36].
Furthermore different ratios of PC and IBP were tried by keeping one component constant and continuously adding other component to check the response of both ingredients using proposed method. Each time fresh amounts were taken to avoid any error arising from the non homogenous mixing of two components. Table 3 expresses the recovery results which are very much satisfactory. These results reveal the overwhelming success of the method and also indicate that matrix of the formulation does not have any significant interference effect over the analyte.
3.4. Precision and Accuracy of the Proposed Method
The validity of the proposed procedure was checked with known concentration of ibuprofen (IBP) and paracetamol (PC) after 1, 4, and 8 hour in KBr pellets. Applying t-test no significant difference at 95% confidence was observed in the results.
3.5. Statistical Figures of Merit
Table 4 shows the statistical figures of merit for the proposed method and its comparison with two reference methods already reported for simultaneous analysis of PC and IBP. The data reveals that mean recovery by applying this method was found much higher with low standard deviation values which indicated the high accuracy of the results. The correlation coefficient is also very good i.e. near to unity. The data was furthermore tested by applying student t-test at 95% confidence level. The calculated t-value was less than the tabulated value hence there exists no significant difference between the population means of the results. The limit of Detection (LOD) and limit of quantification (LOQ) were determined as 0.001 mg·g–1 and 0.012 mg·g–1 respectively. These values indicate high sensitivity of transmission FT-IR spectroscopy.
4. Conclusion
This method for the simultaneous assessment of PC and IBP in pharmaceutical samples is straightforward analytical method which is inexpensive and environmental friendly. It eliminates the complexity of usual extraction methods allowing faster analysis without using hazardous organic chemicals. It can definitely find wide applications in pharmaceutical industry as it is in accordance with the green chemistry needs and fulfils industrial demand of rapid and economical method. This new approach of using transmission FTIR for direct determination of two components in pharmaceutical preparations where several excipients are present provides an alternate for the expensive and lengthy procedures used for quality control analysis routinely performed in pharmaceutical industry.
5. Acknowledgements
Pakistan Science Foundation is gratefully acknowledged
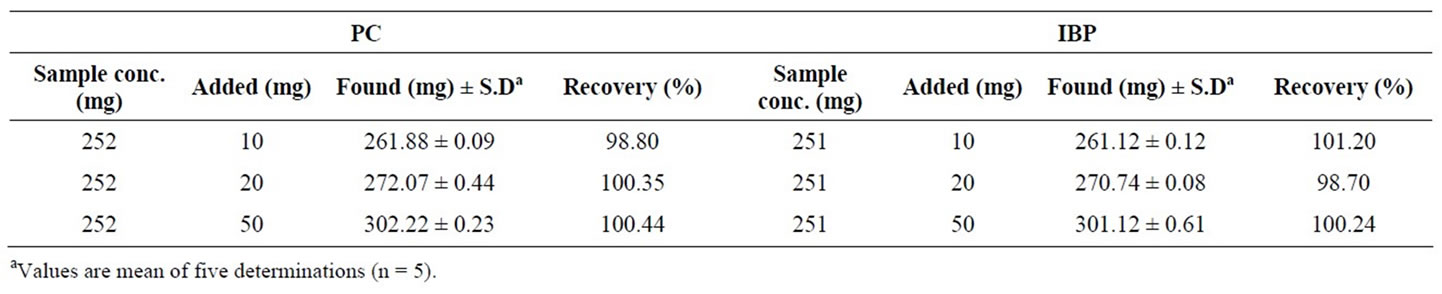
Table 2. Results of recovery after exogenous addition of known amount of standards on selected sample.
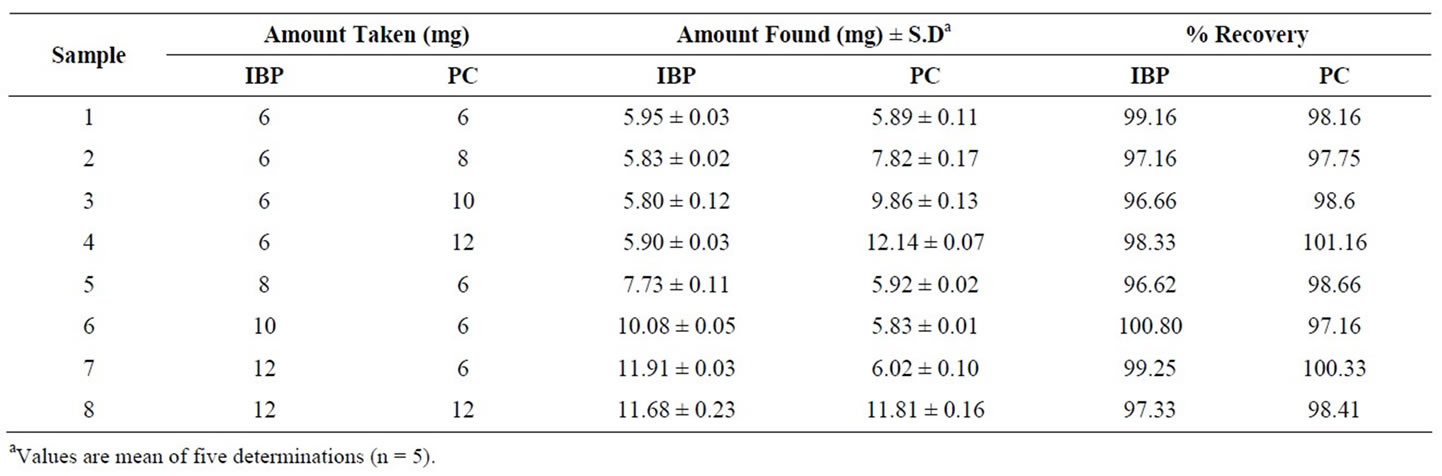
Table 3. Recovery results showing different ratio of mixtures of two drugs.
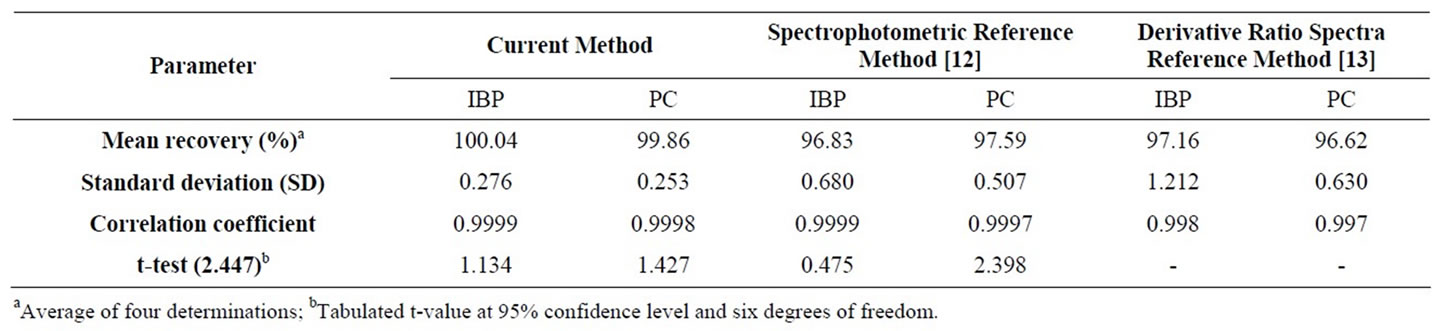
Table 4. Statistical figures of merit for the proposed method and comparison with two reference methods.
for providing the financial support to carry out this research work under project No. PSF/Res/S-SU/Chem/441.
REFERENCES
- D. R. Mehlisch, M. D. S. Aspley, S. E. Daniels and D. P. Bandy, “Comparison of the Analgesic Efficacy of Concurrent Ibuprofen and Paracetamol with Ibuprofen or Paracetamol alone in the Management of Moderate to Severe Acute Postoperative Dental Pain in Adolescents and Adults: A Randomized, Double-Blind, Placebo-Controlled, Parallel-Group, Single-Dose, Two-Center, Modified Factorial Study,” Clinical Therapeutics, Vol. 32, No. 5, 2010, pp. 882-895. doi:10.1016/j.clinthera.2010.04.022
- D. Velasco, C. B. Danoux, J. A. Redondo, C. Elvira, J. S. Román, P. S. Wray and S. G. Kazarian, “pH-Sensitive Polymer Hydrogels Derived from Morpholine to Prevent the Crystallization of Ibuprofen,” Journal of Controlled Release, Vol. 149, No. 2, 2011, pp. 140-145. doi:10.1016/j.jconrel.2010.10.015
- Y. Sun, K. Takaba, H. Kido, M. N. Nakashima and K. Nakashima, “Simultaneous Determination of Arylpropionic Acid Nonsteroidal Anti-Inflamatory Drugs in Pharmaceutical Formulations and Human Plasma by HPLC with UV Detection,” Journal of Pharmaceutical and Biomedical Analysis, Vol. 30, No. 5, 2003, pp. 1611-1619. doi:10.1016/S0731-7085(02)00549-6
- S. Husain, M. Kifayatullah and R. Sekhar, “Simultaneous Determination of Ibuprofen and Acetaminophen in Pharmaceutical Preparations by Proton Magnetic Resonance Spectroscopy,” Journal of AOAC International, Vol. 77, No. 6, 1994, pp. 1443-1446.
- H. E. Abdellatef, M. M. Ayad, S. M. Soliman and N. F. Youssef, “Spectrophotometric and Spectrodensitometric Determination of Paracetamol and Drotaverine HCl in Combination,” Spectrochimica Acta Part A: Molecular and Biomolecular Spectroscopy, Vol. 66, No. 4-5, 2007, pp. 1147-1151. doi:10.1016/j.saa.2006.05.028
- P. Valderrama and R. J. Poppi, “Second Order Standard Addition Method and Fluorescence Spectroscopy in the Quantification of Ibuprofen Enantiomers in Biological Fluids,” Chemometrics and Intelligent Laboratory Systems, Vol. 106, No. 2, 2011, pp. 160-165. doi:10.1016/j.chemolab.2010.05.012
- C. D. Palma, R. D. Paola, C. Perrotta, E. Mazzon, D. Cattaneo, E. Trabucchi, S. Cuzzocrea and E. Clementi, “Ibuprofen-Arginine Generates Nitric Oxide and Has Enhanced Anti-Inflammatory Effects,” Pharmacological Research, Vol. 60, No. 4, 2009, pp. 221-228. doi:10.1016/j.phrs.2009.06.002
- A. O. Santini, J. E. D. Oliveira, H. R. Pezza and L. Pezza, “A New Potentiometric Ibuprofenate Ion Sensor Immobilized in a Graphite Matrix for Determination of Ibuprofen in Tablets,” Microchemical Journal, Vol. 84, No. 1-2, 2006, pp. 44-49. doi:10.1016/j.microc.2006.04.007
- K. G. Kumar and R. Letha, “Determination of Paracetamol in Pure Form and in Dosage Forms Using N,N-Dibromo Dimethylhydantoin,” Journal of Pharmaceutical and Biomedical Analysis, Vol. 15, No. 11, 1997, pp. 1725-1728. doi:10.1016/S0731-7085(96)01976-0
- M. R. Khoshayand, H. Abdollahi, M. Shariatpanahi, A. Saadatfard and A. Mohammadi, “Simultaneous Spectrophotometric Determination of Paracetamol, Ibuprofen and Caffeine in Pharmaceuticals by Chemometric Methods,” Spectrochimica Acta Part A: Molecular and Biomolecular Spectroscopy, Vol. 70, No. 3, 2008, pp. 491-499. doi:10.1016/j.saa.2007.07.033
- Sirajuddin, A. R. Khaskheli, A. Shah, M. I. Bhanger, A. Niaz and S. A. Mahesar, “Simpler Spectrophotometric Assay of Paracetamol in Tablets and Urine Samples,” Spectrochimica Acta Part A: Molecular and Biomolecular Spectroscopy, Vol. 68, No. 3, 2007, pp. 747-751. doi:10.1016/j.saa.2006.12.055
- D. Basu, K. K. Mahalanabis and B. Roy, “Application of Least Squares Method in Matrix Form: Simultaneous Determination of Ibuprofen and Paracetamol in Tablets,” Journal of Pharmaceutical and Biomedical Analysis, Vol. 16, No. 5, 1998, pp. 809-812. doi:10.1016/S0731-7085(97)00111-8
- Y. M. Issa, S. I. M. Zayed and I. H. I. Habib, “Simultaneous Determination of Ibuprofen and Paracetamol Using Derivatives of the Ratio Spectra Method,” Arabian Journal of Chemistry, Vol. 4, No. 3, 2011, pp. 259-263. doi:10.1016/j.arabjc.2010.06.044
- E. Dinç, C. Yücesoy and F. Onur, “Simultaneous Spectrophotometric Determination of Mefenamic Acid and Paracetamol in a Pharmaceutical Preparation Using Ratio Spectra Derivative Spectrophotometry and Chemometric Methods,” Journal of Pharmaceutical and Biomedical Analysis, Vol. 28, No. 6, 2002, pp. 1091-1100. doi:10.1016/S0731-7085(02)00031-6
- T. Madrakian, A. Afkhami and M. Mohammadnejad, “Second-Order Advantage Applied to Simultaneous Spectrofluorimetric Determination of Paracetamol and Mefenamic Acid in Urine Samples,” Analytica Chimica Acta, Vol. 645, No. 1-2, 2009, pp. 25-29. doi:10.1016/j.aca.2009.05.002
- M. A. Oliva, R. A. Olsina and A. N. Masi, “Selective Spectrofluorimetric Method for Paracetamol Determination through Coumarinic Compound Formation,” Talanta, Vol. 66, No. 1, 2005, pp. 229-235. doi:10.1016/j.talanta.2004.11.015
- S. Azhagvuel and R. Sekar, “Method Development and Validation for the Simultaneous Determination of Cetirizine Dihydrochloride, Paracetamol, and Phenylpropanolamine Hydrochloride in Tablets by Capillary Zone Electrophoresis,” Journal of Pharmaceutical and Biomedical Analysis, Vol. 43, No. 3, 2007, pp. 873-878. doi:10.1016/j.jpba.2006.08.028
- M. Kazutaka, Y. Takahisa, M. Takayoshi, T. Daisuke, S. Toshiaki, I. Yoshinori and O. Ryozo, “A Rapid and Simultaneous Determination of Several Analgesic Antiinflammatory Agents by Capillary Zone Electrophoresis,” Therapeutic Drug Monitoring, Vol. 25, No. 5, 2003, pp. 574-580. doi:10.1097/00007691-200310000-00006
- B. C. Lourencao, R. A. Medeiros, R. C. R. Filho, L. H. Mazo and O. F. Filho, “Simultaneous Voltammetric Determination of Paracetamol and Caffeine in Pharmaceutical Formulations Using a Boron-Doped Diamond Electrode,” Talanta, Vol. 78, No. 3, 2009, pp. 748-752. doi:10.1016/j.talanta.2008.12.040
- S. S. Nair, S. A. John and T. Sagara, “Simultaneous Determination of Paracetamol and Ascorbic Acid Using Tetraoctylammonium Bromide Capped Gold Nanoparticles Immobilized on 1,6-Hexanedithiol Modified Au Electrode,” Electrochimica Acta, Vol. 54, No. 27, 2009, pp. 6837-6843. doi:10.1016/j.electacta.2009.06.077
- I. Baranowska, P. Markowski and J. Baranowski, “Simultaneous Determination of 11 Drugs Belonging to Four Different Groups in Human Urine Samples by ReversedPhase High-Performance Liquid Chromatography Method,” Analytica Chimica Acta, Vol. 570, No. 1, 2006, pp. 46-58. doi:10.1016/j.aca.2006.04.002
- K. R. I. Lorenzini, J. A. Desmeules, M. Besson, J. L. Veuthey, P. Dayer and Y. Daali, “Two-Dimensional Liquid Chromatography-Ion Trap Mass Spectrometry for the Simultaneous Determination of Ketorolac Enantiomers and Paracetamol in Human Plasma: Application to a Pharmacokinetic Study,” Journal of Chromatography A, Vol. 1216, No. 18, 2009, pp. 3851-3856. doi:10.1016/j.chroma.2009.02.071
- X. Chen, J. Huang, Z. Kong and D. Zhong, “Sensitive Liquid Chromatography-Tandem Mass Spectrometry Method for the Simultaneous Determination of Paracetamol and Guaifenesin in Human Plasma,” Journal of Chromatography B, Vol. 817, No. 2, 2005, pp. 263-269. doi:10.1016/j.jchromb.2004.12.011
- H. G. Lou, H. Yuan, Z. R. Ruan and B. Jiang, “Simultaneous Determination of Paracetamol, Pseudoephedrine, Dextrophan and Chlorpheniramine in Human Plasma by Liquid Chromatography-Tandem Mass Spectrometry,” Journal of Chromatography B, Vol. 878, No. 7-8, 2010, pp. 682-688.
- M. H. Talpur, S. T. H. Sherazi and S. A. Mahesar, “Impact of Frying on Key Fatty Acid Ratios of Canola Oil,” European Journal of Lipid Science and Technology, Vol. 114, No. 2, 2012, pp. 222-228. doi:10.1002/ejlt.201100156
- M. H. Khaskheli, S. T. H. Sherazi, H. M. Ujan and S. A. Mahesar, “Transmission FT-IR Spectroscopic Analysis of Human Kidney Stones,” Turkish Journal of Chemistry, Vol. 36, No. 3, 2012, pp. 477-483.
- S. A. Mahesar, S. T. H. Sherazi, A. A. Kandhro, M. I. Bhanger, A. R. Khaskheli and M. Y. Talpur, “Evaluation of Important Fatty Acid Ratios in Poultry Feed Lipids by ATR FTIR Spectroscopy,” Vibrational Spectroscopy, Vol. 57, No. 2, 2011, pp. 177-181. doi:10.1016/j.vibspec.2011.06.009
- S. T. H. Sherazi, M. Ali and S. A. Mahesar, “Application of Fourier-Transform Infrared (FT-IR) Transmission Spectroscopy for the Estimation of Roxithromycin in Pharmaceutical Formulation,” Vibrational Spectroscopy, Vol. 55, No. 1, 2011, pp. 115-118. doi:10.1016/j.vibspec.2010.09.010
- S. A. Mahesar, A. Bendini, L. Cerretani, M. B-Carboginin and S. T. H. Sherazi, “Application of a Spectroscopic Method to Estimate the Olive Oil Oxidative Status,” European Journal of Lipid Science and Technology, Vol. 112, No. 12, 2010, pp. 1356-1362. doi:10.1002/ejlt.201000388
- S. A. Mahesar, A. A. Kandhro, L. Cerretani, A. Bendini, S. T. H. Sherazi and M. I. Bhanger. “Determination of Total Trans Fat Content in Pakistani Cereal Based Foods by SB-HATR FT-IR Spectroscopy Coupled with Partial Least Square Regression,” Food Chemistry, Vol. 123, No. 4, 2010, pp. 1289-1293. doi:10.1016/j.foodchem.2010.05.101
- S. T. H. Sherazi, M. Y. Talpur, S. A. Mahesar, A. A. Kandhro and S. Arain, “Main Fatty Acids Classes in Vegetable Oils by SB-ATR-Fourier Transform Infrared (FTIR) Spectroscopy,” Talanta, Vol. 80, No. 2, 2009, pp. 600-606. doi:10.1016/j.talanta.2009.07.030
- S. T. H. Sherazi, A. Kandhro, S. A. Mahesar, M. I. Bhanger, M. Y. Talpur and S. Arain, “Application of Transmission FT-IR Spectroscopy for the Trans Fat Determination in the Industrially Processed Edible Oils,” Food Chemistry, Vol. 114, No. 1, 2009, pp. 323-327. doi:10.1016/j.foodchem.2008.09.058
- F. R. van de Voort, J. Sedman and S. T. H. Sherazi, “Correcting For Underlying Absorption Interferences in FT-IR Trans Analysis of Edible Oils Using 2d Correlation Techniques,” Journal of Agricultural and Food Chemistry, Vol. 56, No. 5, 2008, pp. 1532-1537. doi:10.1021/jf0725068
- F. R. van de Voort, J. Sedman and S. T. H. Sherazi, “Improved Determination of Isolated Trans Isomers in edible oils by Fourier Transform Infrared Spectroscopy Using Spectral Reconstitution,” Journal of the Association of Official Analytical Chemists International, Vol. 90, No. 2, 2007, pp. 446-451.
- S. Naz, S. T. H. Sherazi. F. N. Talpur, M. Y. Taplur and H. Kara, “Instantaneous Fortitude of Bioactive Constituents in Deodorizer Distillate by GC-MS,” Journal of American Chemists Society (JAOCS), 2012, Accepted for publication.
- AOAC International, “AOAC Guidelines for Single Laboratory Validation of Chemical Methods for Dietary Supplements and Botanicals,” Association of Official Analytical Chemists, Arlington, 2002.
NOTES
*Corresponding author.