American Journal of Analytical Chemistry
Vol. 3 No. 5 (2012) , Article ID: 19429 , 17 pages DOI:10.4236/ajac.2012.35047
Multivariate Statistical Analysis of Phyllite Samples Based on Chemical (XRF) and Mineralogical Data by XRD
1Department of Rural Engineering, University of Almería, La Cañada de San Urbano, Spain
2Instituto de Ciencia de Materiales, Centro Mixto C.S.I.C.—US. Avda. Américo Vespuccio, Sevilla, Spain
Email: *egarzon@ual.es, pedroji@icmse.csic.es
Received March 5, 2012; revised April 5, 2012; accepted April 12, 2012
Keywords: Selection; Multivariate; Phyllites; XRF; XRD
ABSTRACT
It is presented the results obtained of a multivariate statistical analysis concerning the chemical and phase composition, as a characterization purpose, carried out with 52 rock phyllite samples selected from the provinces of Almería and Granada (SE Spain). Chemical analysis was performed by X-ray fluorescence (XRF). Crystalline phase analysis was performed by X-ray powder diffraction (XRD) and the mineralogical composition was then deduced. Quantification of weight loss (100˚ and 1000˚C) was carried out by thermal analysis. The aims of this investigation were to analyze and compare the chemical and mineralogical composition of all these samples and to find similarities and differences between them to allow a classification. Several correlations between results of the characterization techniques have been also investigated. All the data have been processed using the multivariate statistical analysis method. The XRF macroelements (10) and microelements (39) data generate one macrogroup with two new subgroups (1 and 2), and an isolated sample. In subgroup 1 of macroelements, a positive correlation was found between XRF results and geographic location characterized by lower MgO content, which is associated to its geological origins. When multivariate statistical analysis is applied to results obtained by XRD, two groups appear: the first one with a sample with zero percentage of iron oxide and the second one with the rest of the samples, which is classified in two groups. A correlation is observed between the alkaline content (XRF) and illite (XRD), CaO and MgO with dolomite and indirectly between the weight loss after heating at 1000˚C and the contents of phase minerals that lose structural water (illite + chlorite) or carbon dioxide (dolomite). The present investigation has interest and implications for geochemistry and analytical chemistry concerning earth rocks and silicate raw materials.
1. Introduction
Phyllites are foliated and metamorphized rocks with a low degree of schistosity. They can occasionally contain calcite, besides quartz, moscovite, talc, albite and chlorite, among other minerals. They have a silky sheen and feel greasy to the touch in a similar way to talc. They flake easily and have relatively little cohesion. Moreover, their colours vary from grey, greenish-grey, bluish-grey, violet or even brown or reddish [1-3].
In the Southeast of Spain, they can be found in abundance, linked with the Alpujárride complex and the basis of the Maláguide complex: Sierra Nevada and Sierra de Baza in Granada, the Cuevas de Almanzora area and Sierra Alhamilla in Almería, Cerro de la Peluca in Málaga and in the Murcia region [3-5]. They have also been found in large areas of the Andes, like Venezuela and México [6], and in other parts of the world, such as: Créete [7], China [8] ó Brasil [9].
Phyllites have been used traditionally in very specific areas of the Southeast of Spain, for such purposes as cover and waterproofing in roofs, ponds, for some parts of heterogeneous cross section dams, (Beninar dam) and for urban waste landfills (el Gorguel tip in Cartagena) due to its compacting properties and its scarce permeability to water [10-13]. On flat roofs, several compressed layers of phyllites of different sizes are placed on a cane matting basis supported by a framework of wooden beams. In other regions of the Southeast of Spain, where snowfall is frequent, they have gable or hip roofs. In these instances, they use clay tiles to cover the phyllite layer and even slate leaves [14,15].
At present, there are several applicable alternatives for waterproofing roofs, and impermeabilizing ponds and tips. Some of them are based on the use of high density polythene (HDPE) and polyvinyl (PVC). These materials eventually deteriorate despite their long durability and have to be replaced. Besides, being oil derivates, their relative cost has increased significantly in the last few years [6].
Another highly developed alternative is based on the use of materials of natural origin, such as bentonite. These can be classified as highly expandable (with Na), little expandable (with Ca) and intermediate. However, the most commonly used waterproof material is sodium bentonite [16]. Besides those mentioned above, other mixtures have been developed which combine polythene, polypropylene or geotextile layers with a layer of sodium bentonite, which acts as the waterproofing agent.
Another possibility exists, based on the use of natural materials which are plentiful in a particular area, such as phyllites. But this alternative is hardly developed, since it is currently applied as a cover for surfaces that require waterproofing, and is subsequently compacted manually [17]. After some time, it is necessary to carry out maintenance every year, replacing part of the materials that have been washed away by the rain. In terms of the above statements, it is necessary to classify phyllite deposits by their chemical and mineralogical characteristics using an adequate method. The purpose of the present investigation is to analyze and compare the chemical and mineralogical composition of a set of rock phyllite samples to find similarities and differences between them to allow a classification. The data have been processed using the multivariate statistical analysis method. Several correlations between results of the characterization methods have been also investigated. The significance of this contribution is addressed to geochemistry and analytical chemistry of earth rocks and silicate raw materials.
2. Materials and Methods
2.1. Materials, Techniques and Operating Conditions
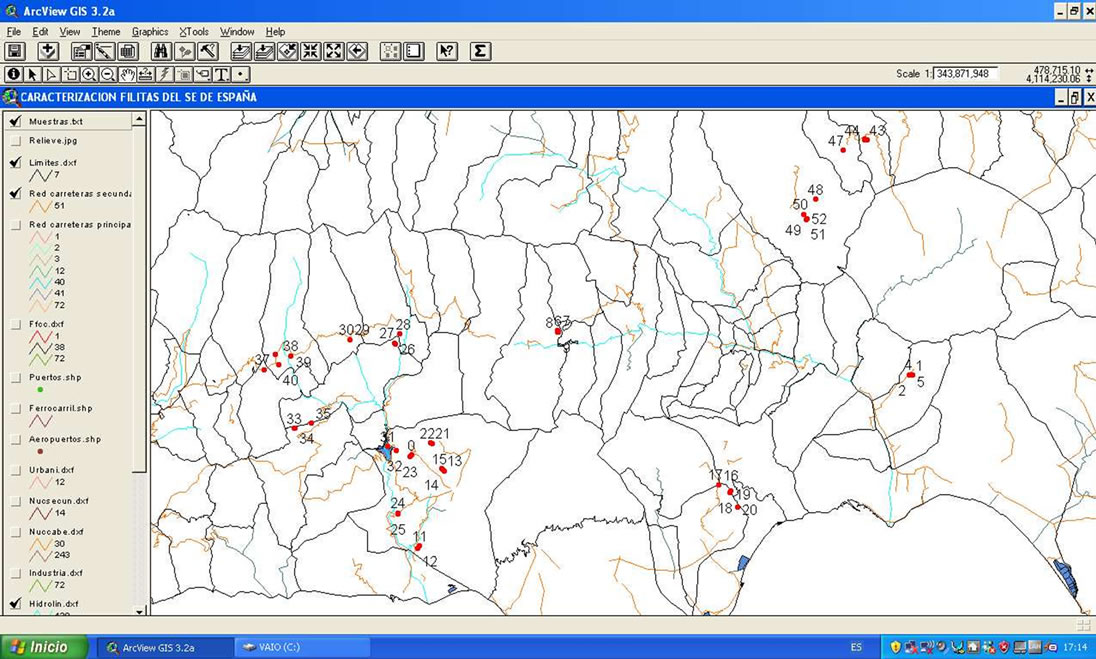
In this study, a total of 52 phyllite samples from Almería and Granada (provinces South Spain) have been analyzed. In Figure 1 the spatial location of each one of them is shown. For the analysis of the chemical composition of the samples under study, a Siemens SRS-3000 X ray Fluorescence sequential spectrometer (XRF) was employed and an Rh tube as X-ray source. Pressed pellets were made with the original samples by pressing them at 400 Mpa, after placing them on a cylindrical metal matrix.
The bulk mineralogical composition of the samples was determined by an analysis performed using X-ray powder diffraction (XRD). The samples were ground in an agate mortar and disoriented mounting for XRD was prepared. The X-ray diffractometer Siemens, D-501 model, was used. The instrument was operated at 36 kV and 26 mA using Ni-filtered CuKα radiation and graphite monochromator. The semiquantitative mineralogical compositions after crystalline phase analysis were calculated using the methods proposed by [18,19], applied by [20-22] and more recently by [23] with successful results considering clay minerals and accessories such as those identified by XRD in the 52 phyllite samples.
This method is adequate for mineral content higher than 5% in weight. When the mineral phase is identified but it is not possible to use X-ray peaks of relative intensity 100 to perform the calculations, the content is assumed to be “<2%” in weight. Source of errors which influence the shape of XRD diagrams and X-ray diagnostic peaks, such as background, orientation of phyllosilicates and grinding of the samples, were avoided [24,25].
The weight loss quantification was carried out using thermal treatments at temperatures of 110˚C and 1000˚C, using a sample amount of 1 g, after heating it in an oven for one hour. To calculate total weight loss the mean of three measurings was taken.
2.2. Statistical Analysis
In order to isolate and estimate the statistic validity of those groups that showed a similar chemical profile, the chemical composition data obtained by XRF (of both macroelements and microelements) and by XRD were analyzed using MVSA exploratory techniques: cluster analysis, main-component analysis and discriminant canonical analysis, which includes the Mahalanobis [26] distance calculation using the programme statgraphic-plus.
The XRF and XRD concentrations became logarithmic values to compensate the differences in magnitude between majority and minority values when calculating similarity coefficients [6,27]. In the statistical analyses the concentrations of microelements Lu and Tm were not taken into account because it was impossible to determine them in any of the samples. Discriminant canonical analyses were also carried out between the data of XRF, XRD and weight loss. In the latter, the data have not been transformed.
3. Results and Discussion
3.1. XRF and Multivariate Statistical Analysis
The results of the chemical analyses obtained by means of XRF in the 52 samples were transformed into logarithmic values and subjected to an exploratory statistical analysis using a Cluster analysis and an analysis of the main components. The purpose of this was to carry out an initial approximation to the general features presented by the set of data, and to determine the variables that showed a higher discriminating power to separate groups of phyllites with a similar chemical profile. These previous numerical analyses indicated that there were 49 variables: 10 macroelements and 39 microelements.
The macroelements were the following: SiO2, Al2O3,
 (a)
(a)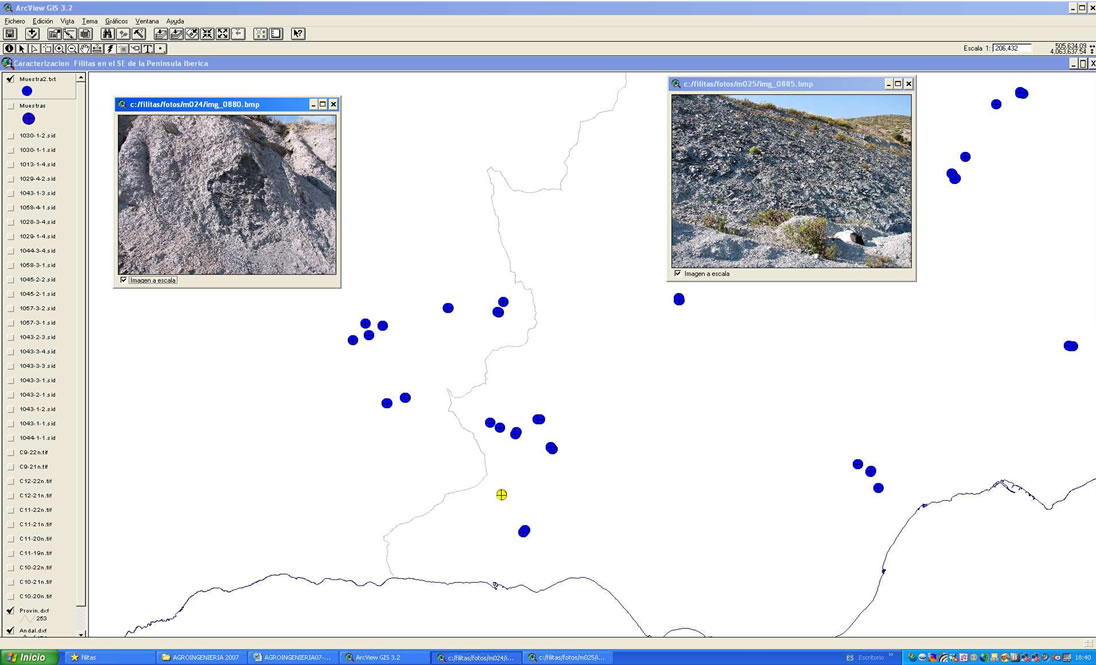 (b)
(b)
Figure 1. Location of phyllite sampling points (a) and illustration detail of pictures taken with a digital camera of the place where the samples were collected, which are linked to the yellow sample (b).
Fe2O3, MnO, MgO, CaO, Na2O, K2O, TiO2 y P2O5. The remaining variables only represent 0.06%. The component analysis showed that the first three components represent 79.50% of the total data variation (Figure 2). With regard to the first component which accounted for 43.167% of the variation, variables MnO, P2O5 and others correlated positively, while the rest of the variables did so in a negative way. In the second component with 19.04% of the variation, they were the variables Fe2O3, TiO2, K2O, MnO, P2O5 and others which correlated positively, while SiO2, MgO, CaO and Na2O correlated negatively. For the third component with 17.29% of the variation, variables SiO2, Al2O3 and K2O correlated negatively and the rest did so positively (Figure 2).
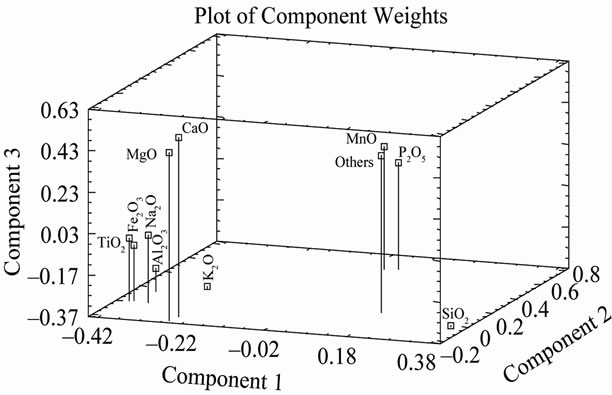
Figure 2. Plot of component weights of phyllites samples.
A Cluster analysis was carried out starting from the 10 macroelements mentioned, using the nearest-neighbour method and a Euclidean distance matrix gave a dendogram in which most samples cluster within a group (51) with different similarity levels, whilst sample 26 appears without a group, due to the fact that MnO y P2O5 concentrations are null (Figure 3 and Table 1). Within the first group, 2 subgroups appear. Likewise, within each subgroup there are new groupings.
Subgroup 1 (samples): 43, 44, 45, 46, 47, 48, 50, 51, 52.
Subgroup 2 (samples): 1, 2, 3, 4, 5, 6, 7, 8, 9, 10, 11, 12, 13, 14, 15, 16, 17, 18, 19, 20, 21, 22, 23, 24, 25, 27, 28, 29, 30, 31, 32, 33, 34, 35, 36, 37, 38, 39, 40, 41, 42 y 49.
The first subgroup is geographically located in areas which are very close to one another (between Castro de Filabres and Gérgal) and its main characteristic is lower concentrations of MgO (Figure 4).
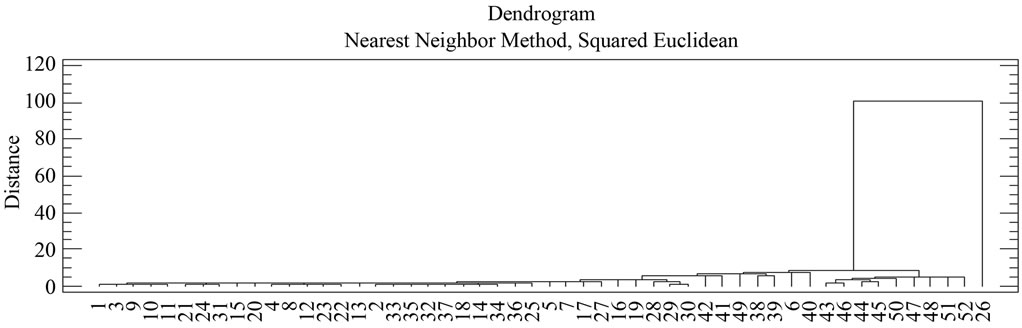
Figure 3. Dendogram of phyllite sample groups.
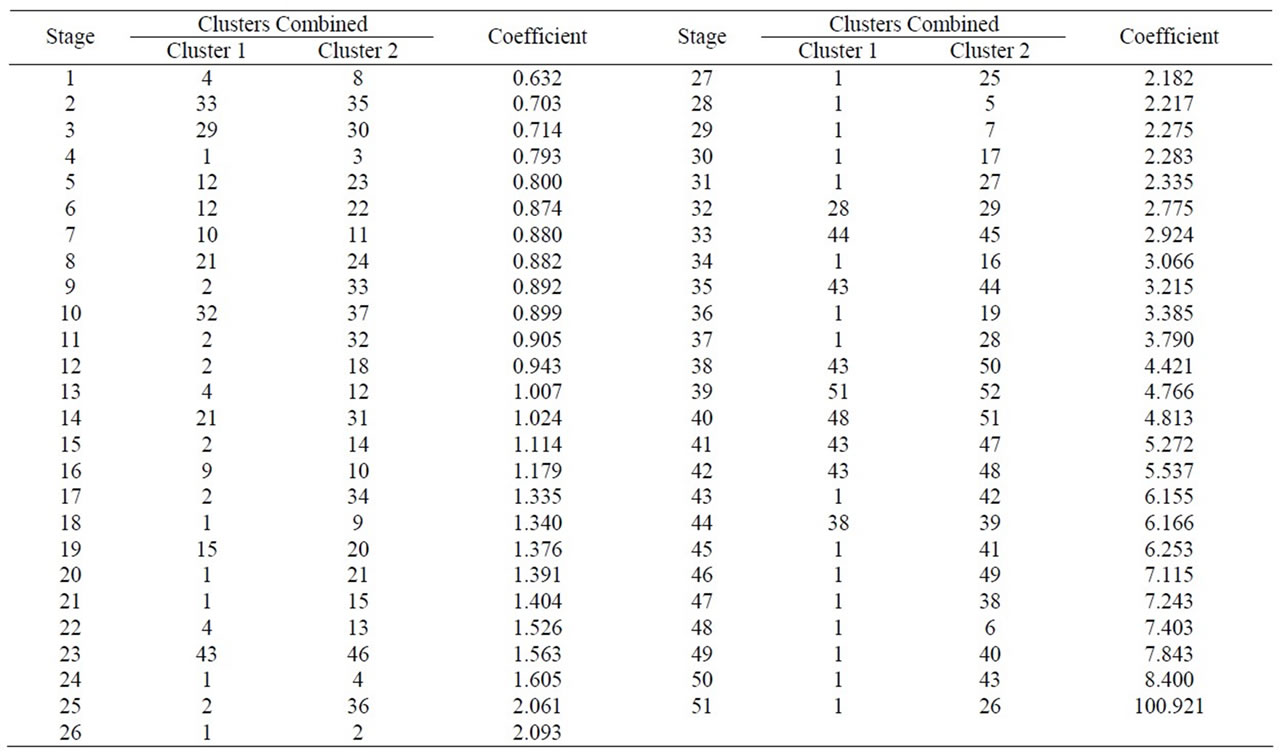
Table 1. Cluster analysis using the nearest-neighbour method and a Euclidean distance matrix (XRF macroelements).
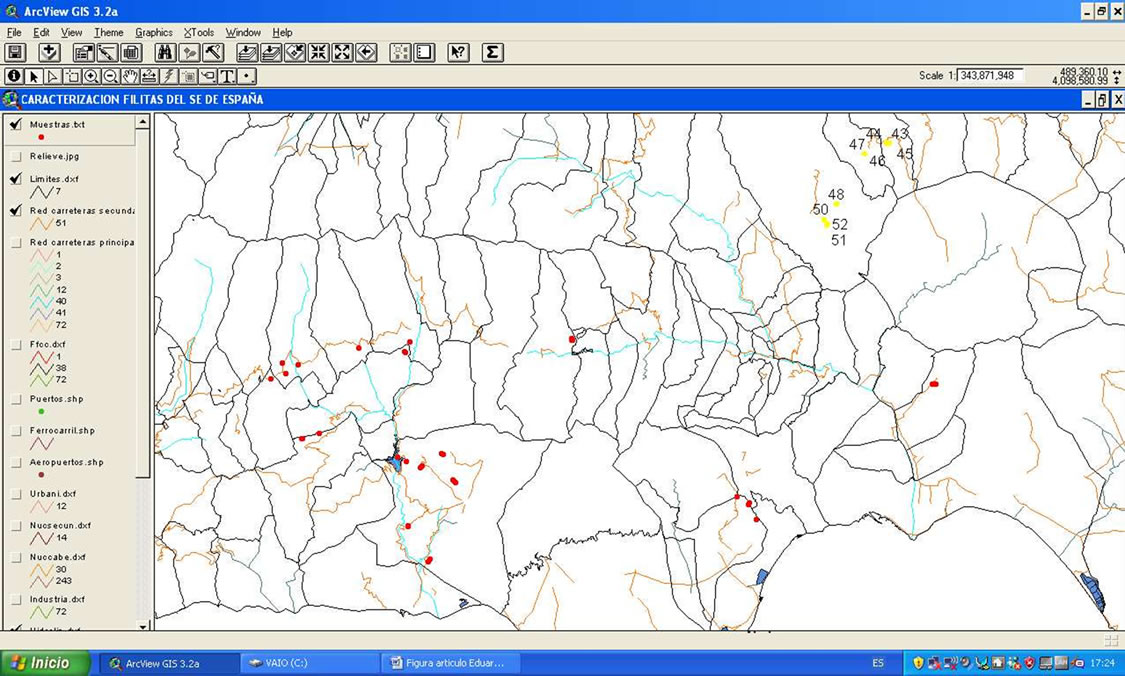
Figure 4. Subgroup 1 (macroelements) located between Castro de Filabres and Gérgal, with the characteristic of lower MgO concentrations.
To estimate the statistical validity of the groups obtained with the Cluster analysis and of the main components a final discriminant canonical analysis was carried out with which the Mahalanobis distance of each sample was calculated with regard to the centroid of each grouping. The results of this analysis confirmed the groupings that had been established. In all cases, the samples presented a 100% likelihood of belonging to the group in question. As to the Mahalanobis distance, group 1 proved to be very homogeneous, as its scores were between 0.545 and –0.275 with regard to its centroid. And Group 2 (26) is situated at –6.9 with regard to the centroid of group 1 (Figure 5 and Table 2).
As to the microelements, an analysis of the components reflects that the first 6 represent 82.91% of the total variation of the data (Figure 6 and Table 3). The first component accounted for 53.35% of the variation, variables Cl, Cs, Cu, S y Sb correlated negatively and the rest positively. The second component represents 15.52% of variability, and they were variables As. Cl, Er, Eu, F, Gd, Hf, La, Mo, Nb, Pb, Sm, Sn, Tb, Th, Tl, V, W, Y, Yb, Zn and Zr that correlated negatively. For the third component with 4.58% of the variation, They were variables Ba, Cl, Co, Cr, Cs, Cu, Ga, Hf, La, Mo, Pb, Rb, Sc, Sm, Sr, Ta, Tb, V, W, Zn that correlated negatively. As to the fourth component, it represents 3,53% of the variation, variables Ba, Cl, Dy, Er, Eu, F, Gd, Hf, La, Mo, Nb, Ni, Sm, Ta, Tb, Th, Y, Zn, Zr correlated negatively. And finally, the other two main components represent 3.31% and 2.6% of the total variation (Figure 6).
The Cluster analysis carried out (Figure 7 and Table 4) using the Nearest-Neighbor method and a Euclidean distance matrix, provided a dendogram in which most of the samples clustered within group 1, except sample 23 which remained ungrouped, as it registered the lowest values among the following microelements: Eu, Gd, Nb, Th, Zn y Ba, Dy, Er, Ga, Hf, Sm, Th, V, Y, Yb, Zr (these microelements are always followed by 49). Likewise, within group 1 two subgroups appeared. One where all the samples appeared and the other one with ungrouped sample 24, which had the highest values of Ta, next to the lowest value of U. And within subgroup 1 once more two blocks appeared:
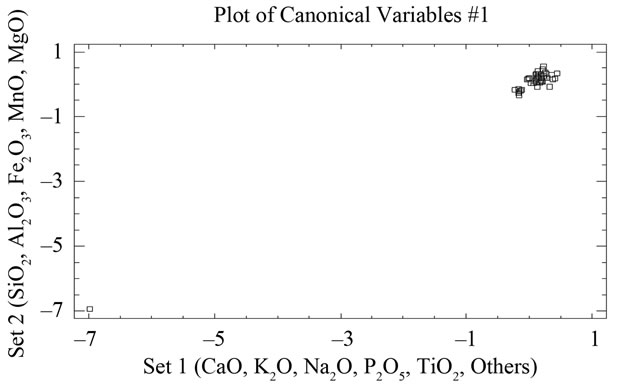
Figure 5. Representation of the samples and their groupings according to the scores of the first five components, from the logarithmic transformation of element concentration given by WDXRF.
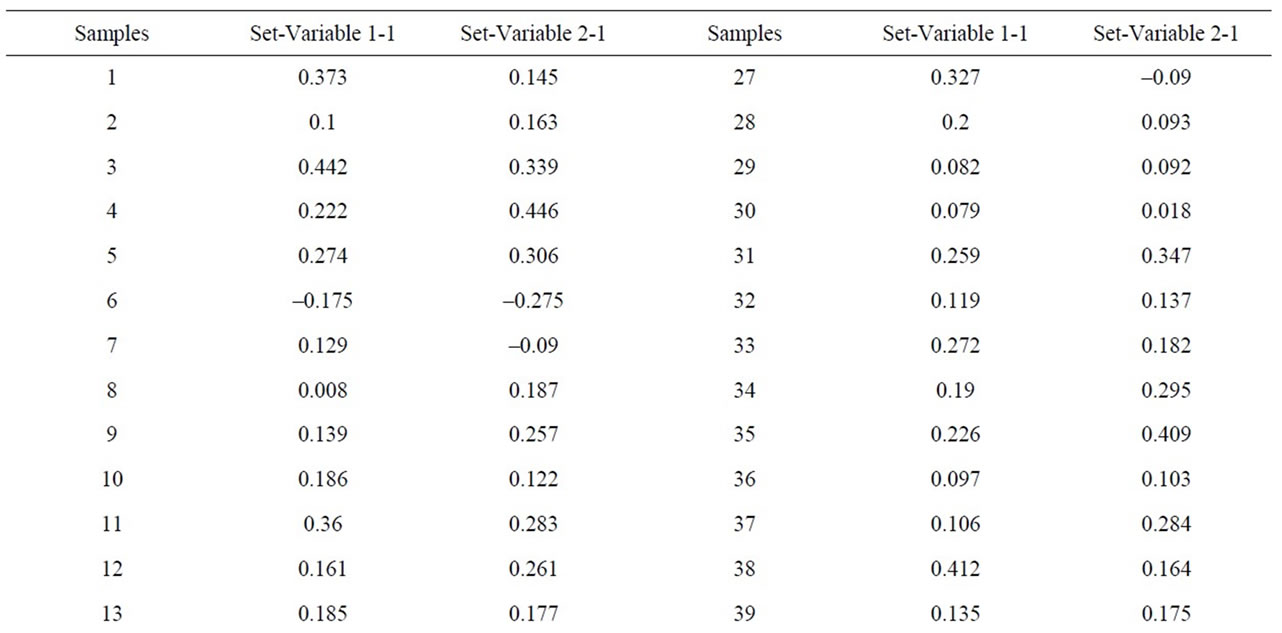
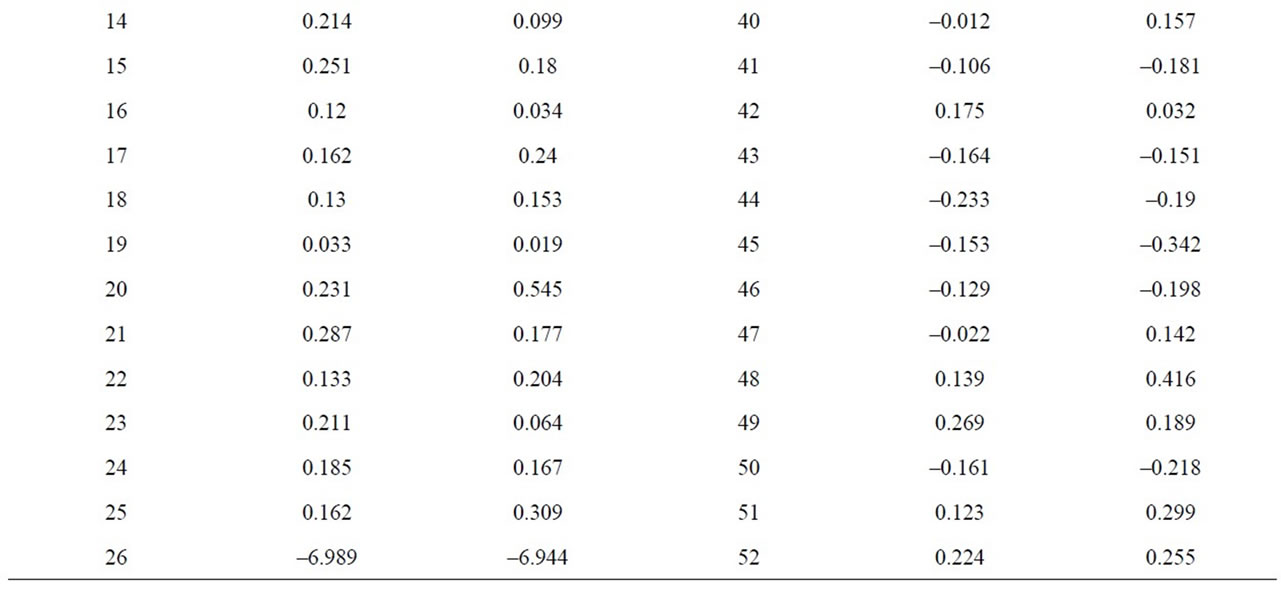
Table 2. Discriminant canonical analysis with the calculation the Mahalanobis distance (XRF macroelements).
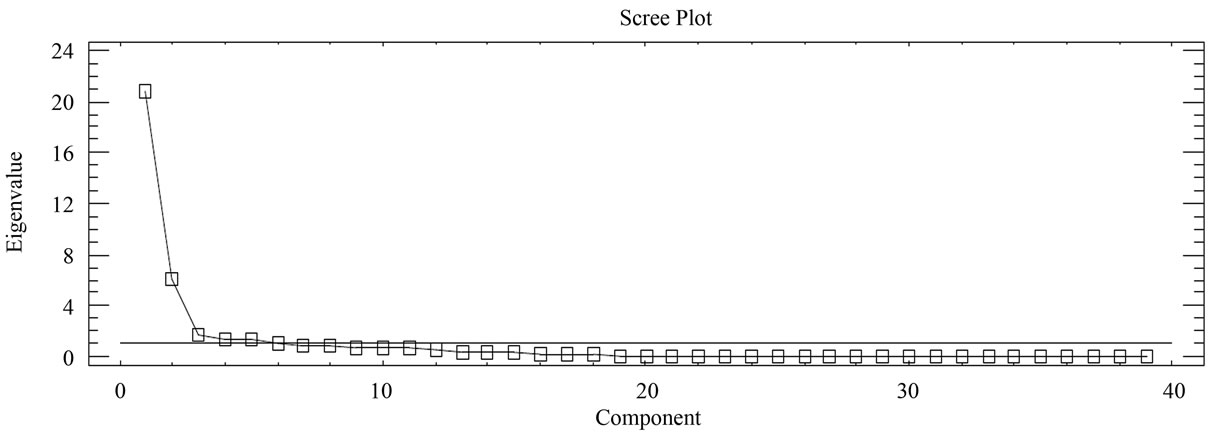
Figure 6. Scree plot of phyllite samples (39 microelements).
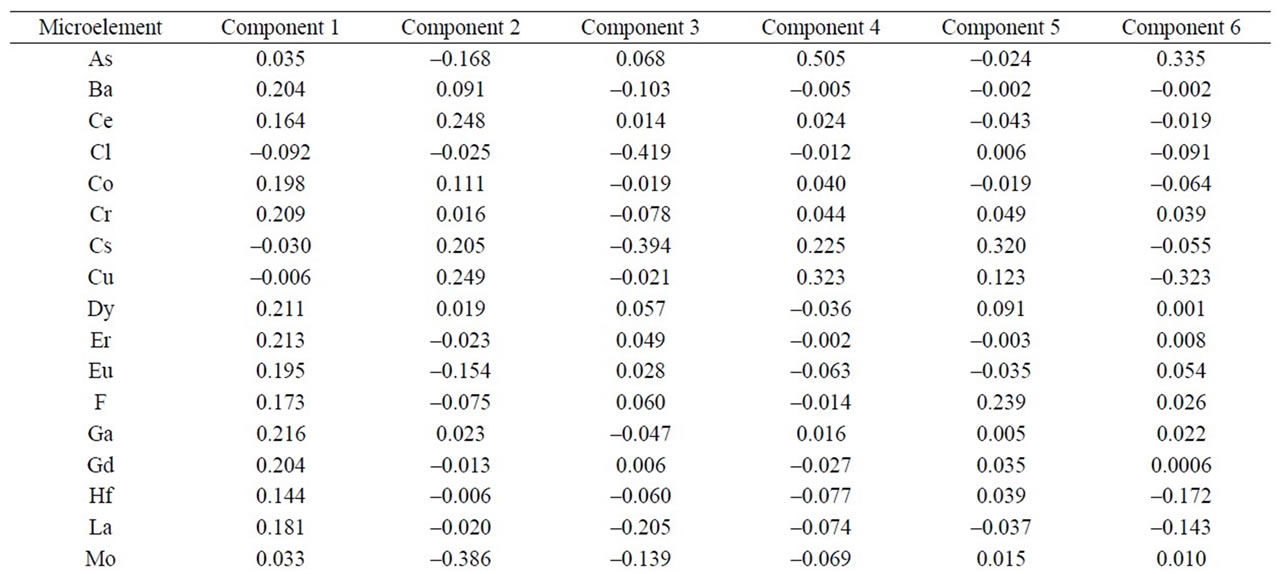
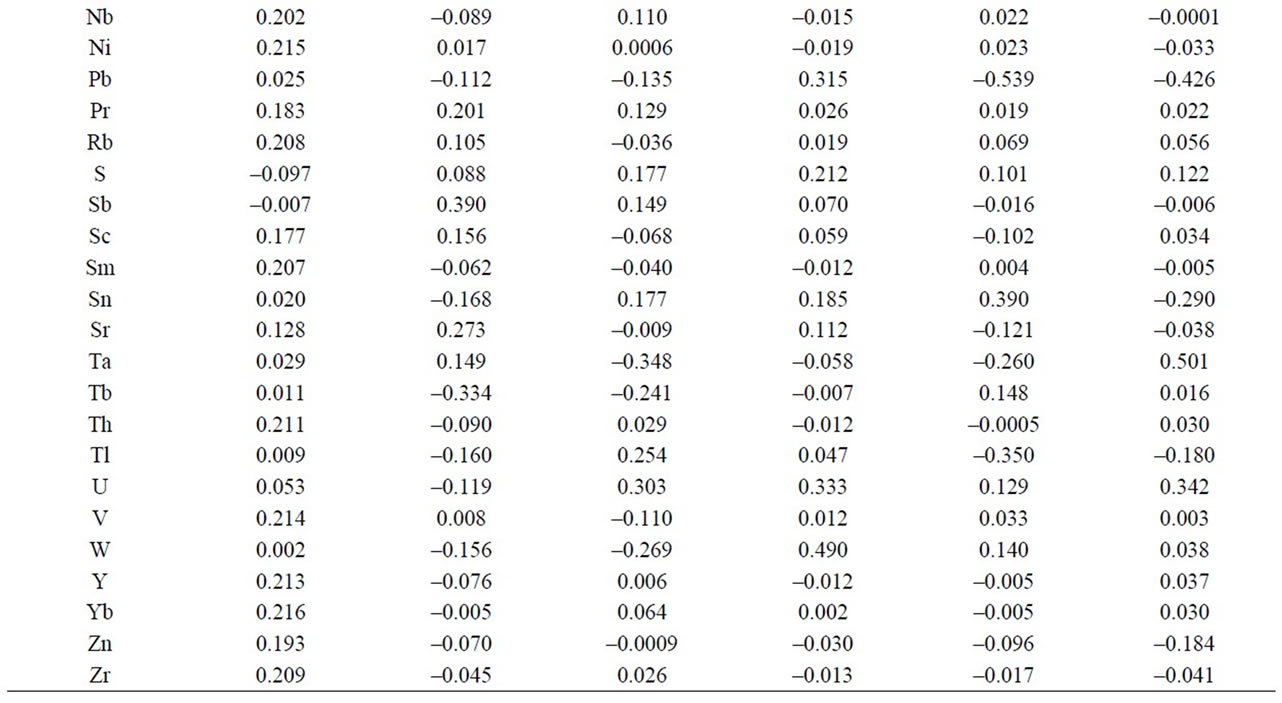
Table 3. Table of component weights of phyllites samples (39 microelements).

Figure 7. Dendogram of phyllite sample groups (39 microelements, 52 samples).
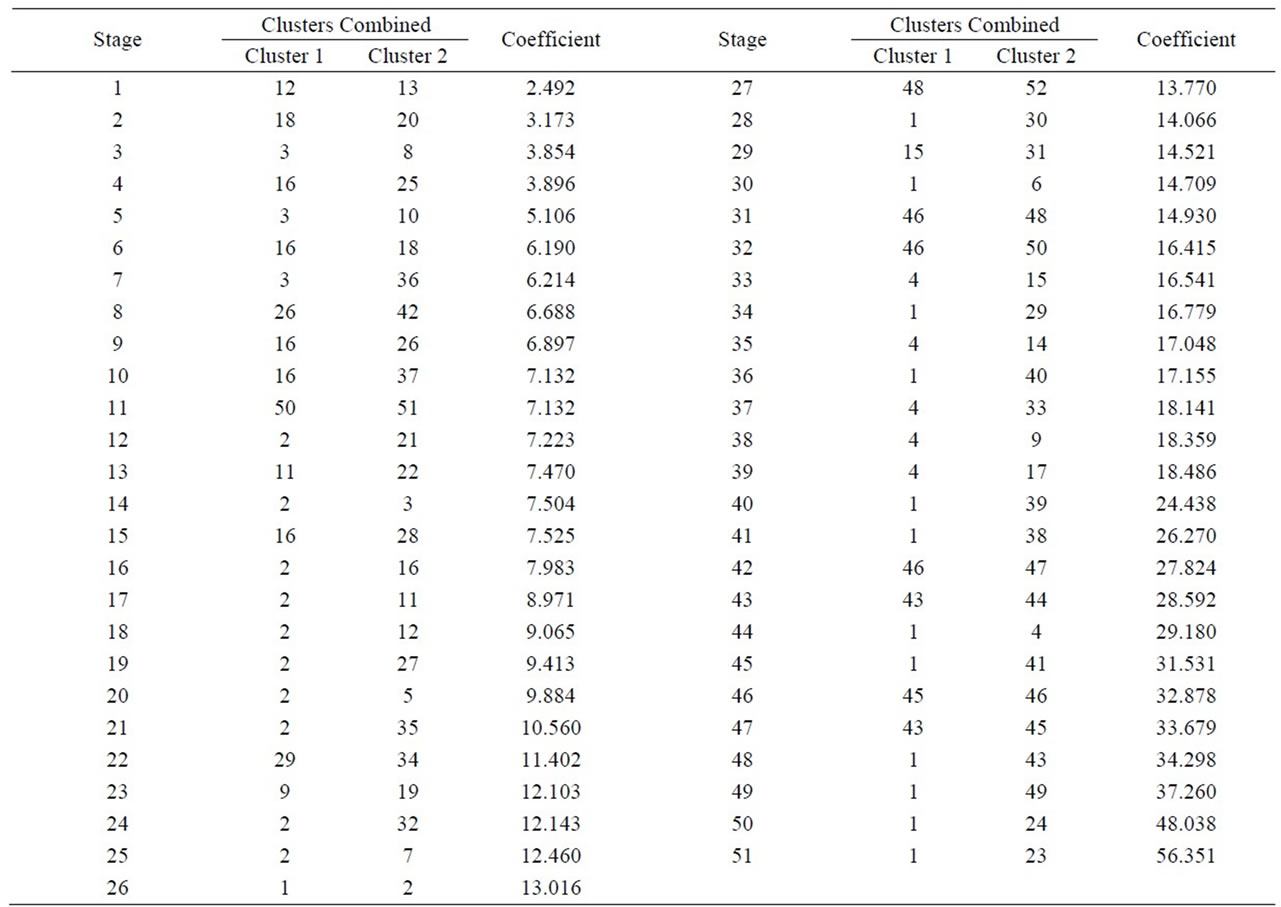
Table 4. Cluster analysis using the nearest-neighbour method and a Euclidean distance matrix (XRF microelements).
Block 1 (samples): 1, 2, 3, 4, 5, 6, 7, 8, 9, 10, 11, 12, 13, 14, 15, 16, 17, 18, 19, 20, 21, 22, 25, 26, 27, 28, 29, 30, 31, 32, 33, 34, 35, 36, 37, 38, 39, 40, 41, 42, 43, 44, 45, 46, 47, 48, 50, 51, 52.
Block 2 (samples): 49.
Block 2 registered the lowest values of Ni y de Ce, Co, Cr, La, Pr, Rb, Sc, Sr (higher than 23) or the highest chlorine values (in this case lower than sample 9).
Finally, a discriminant canonical analysis was carried out in which the Mahalanobis distance for each sample was calculated too with regard to the centroid of each grouping in order to verify the groups established with the Cluster analysis. The results of this analysis confirmed the groupings established. In all cases, the samples showed a 100% likelihood of belonging to the group in question. As to the Mahalanobis distance, group 1 was very heterogeneous with regard to its centroid. And group 2 (23) is located at –2.51 with respect to the centroid of group 1 (Figure 8 and Table 5).
3.2. XRD and Statistical Analysis
A semi-quantitative analysis was carried out by X ray diffraction of the phyllite samples, yielding the following global results: 30% - 85% of quartz, 5% - 25% mica (illite), 2% - 23% chlorite, 3% - 18% feldspar, not detected-15% iron oxide (hematites y goethite) and dolomite (not detected-32%). Smaller proportions of the following have also been identified: calcite (not detected-8%) and an interstratified phase [28], although it is difficult to estimate the exact proportion. All these results are presented in Table 6.
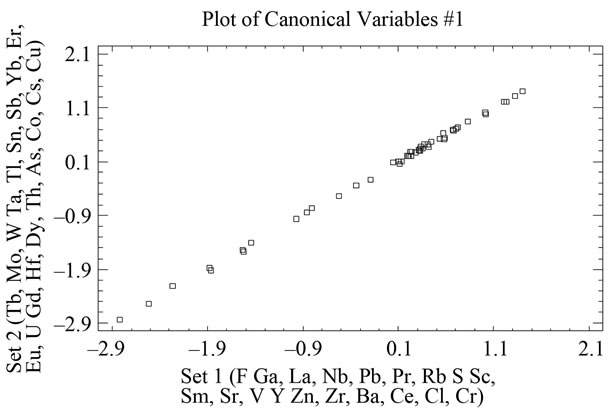
Figure 8. Representation of the samples and their groupings according to the scores of the first twenty components, from the logarithmic transformation of element concentration given by WDXRF.
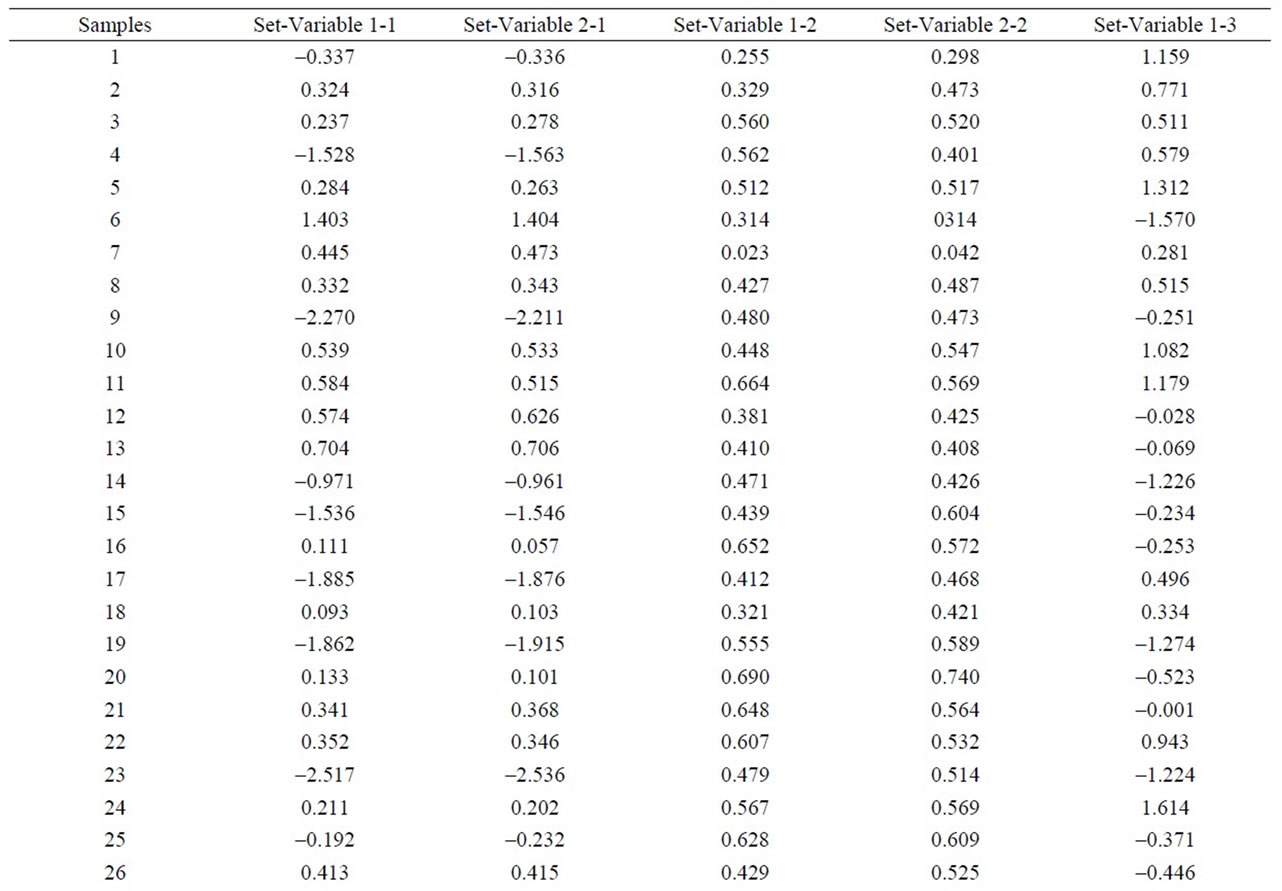
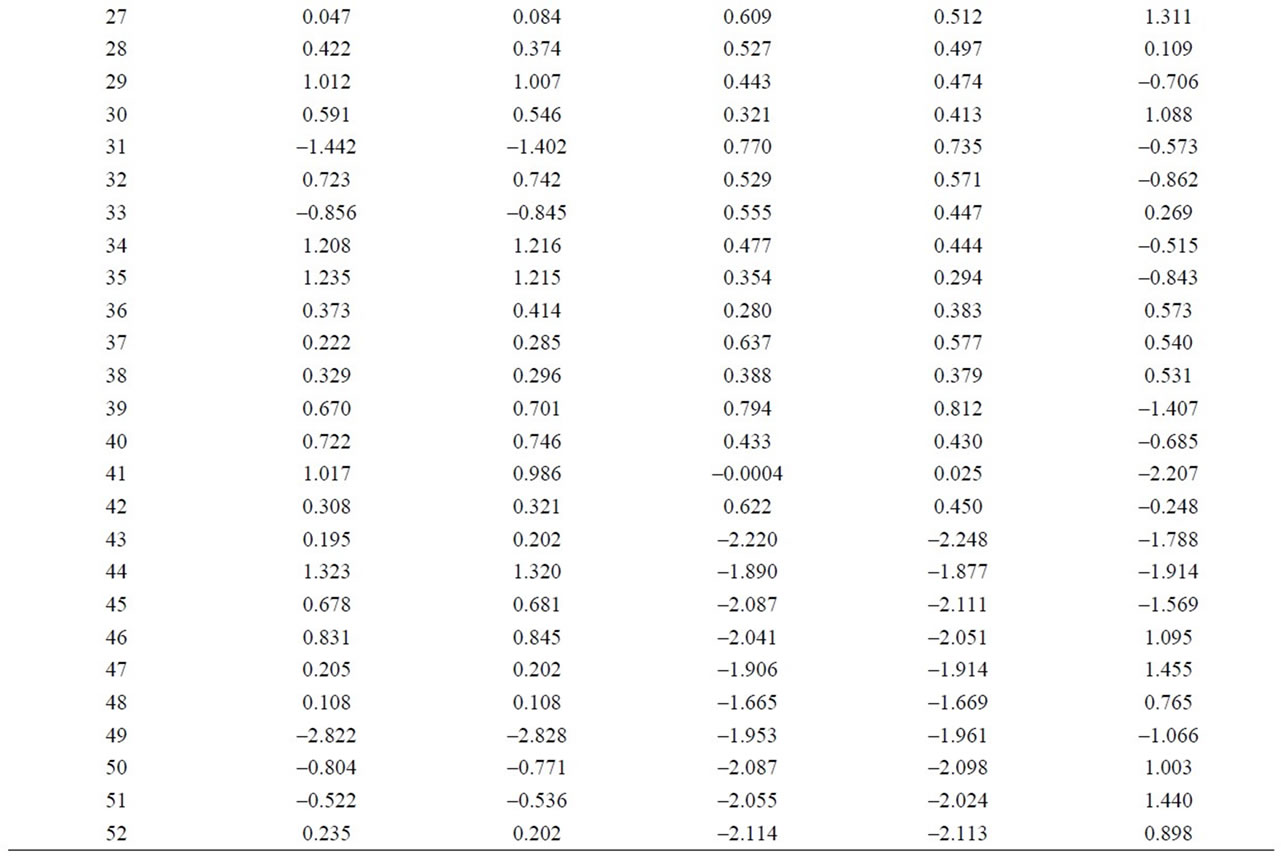
Table 5. Discriminant canonical analysis with the calculation the Mahalanobis distance (XRF microelements).
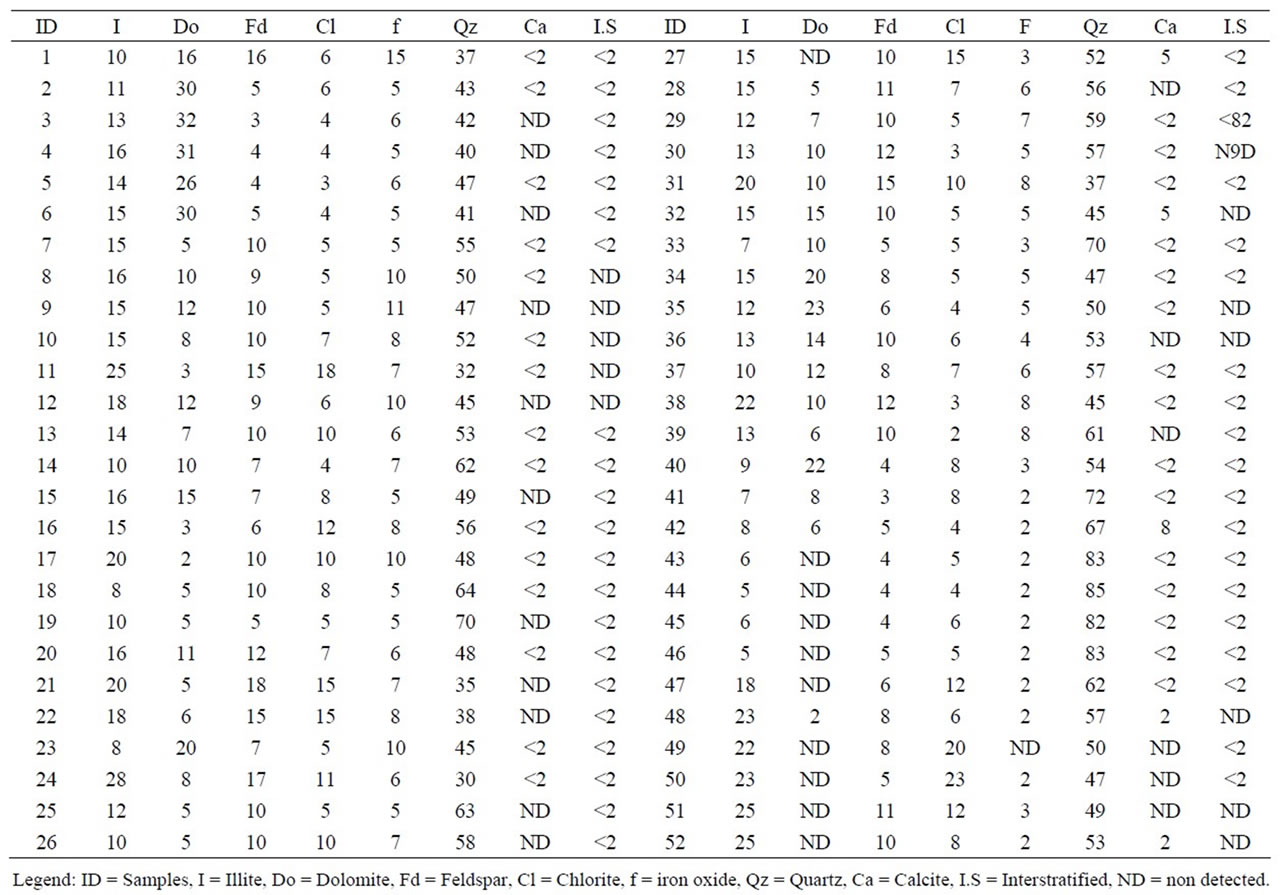
Table 6. Mineralogical composition of the 52 phyllite samples as determined by X-ray diffraction (wt %).
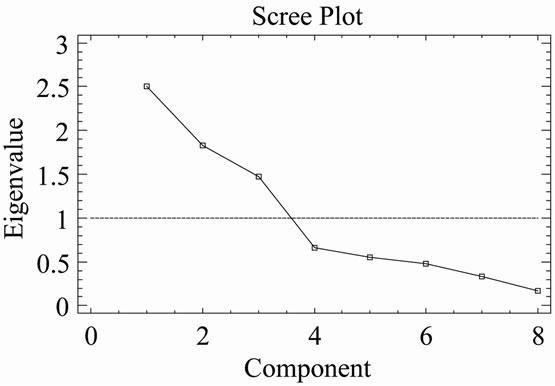
The components analysis applied to the results of X-ray diffraction showed that three components account for 72.94% of the total data variation (Figure 9). With regard to the first component, which accounted for 31.62% of the variation, variables chlorite, illite, feldspar, dolomite and iron oxides correlated positively, while the quartz variables and the interstratified illite-smectite did so negatively. In the second component, with 22.9% of the variation, the variables were calcite, feldspar, dolomite, iron oxides and the interstratified illite-smectite that correlated positively, while the variables quartz and illite correlated negatively. For the third component with 18.42% of the variation, the variable iron oxide was the only one to correlate negatively, the rest did so positively.
A Cluster analysis carried out from the minerals mentioned using the nearest-neighbor method and a Euclidean distance matrix provided a dendogram in which most of the samples cluster within a group 1 (51samples), with different similarity levels, while sample 49 appears ungrouped, as no iron oxide is present in it (Figure 10 and Table 7). Within the first group, two subgroups appear. Likewise, within subgroup 2 further groupings can be seen.
Subgroup 1 (samples): 7, 23.
Subgroup 2 (samples): 1, 2, 3, 4, 5, 6, 8, 9, 10, 11, 12, 13, 14, 15, 16, 17, 18, 19, 20, 21, 22, 24, 25, 26, 27, 28, 29, 30, 31, 32, 33, 34, 35, 36, 37, 38, 39, 40, 41, 42, 43, 44, 45, 46, 47, 48, 50, 51 y 52.
In order to estimate the statistical validity of the groups established by the cluster analysis, a discriminant canonical analysis was carried out in which the Mahalanobis distance was calculated for each sample in respect of the centroid of each group (Figure 11 and Table 8). The results of these analyses confirmed that the groups established presented a 100% likelihood of belonging to the group in question. As to the Mahalanobis distance, group 1 proved to be very heterogeneous, with scores between –1.94 (52) and 1.56 (23) with regard to the centroid. And group 2 (49) scoring –3.35 with regard to the centroid of group 1.
3.3. Correlations XRF, XRD and Weight Loss
When the MgO content is correlated with chlorite one can see that the latter does not exist, as p > 0.05. However, correlations are indeed appreciated between the alkaline concentrations (K2O+Na2O) and illite, which separated samples 41, 43, 44, 46, 50, 40, 45, 6, with
 (a)
(a)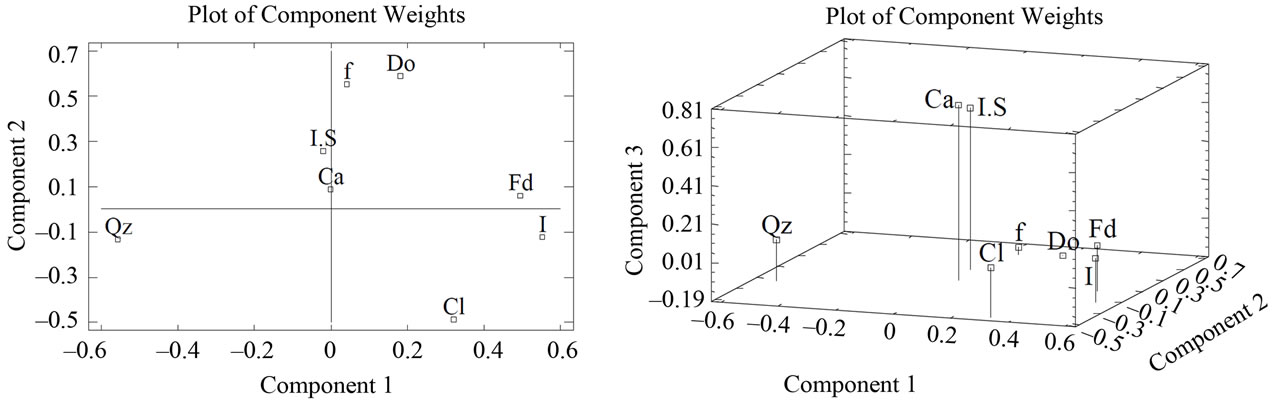 (b)
(b)
Figure 9. (a) Scree plot of phyllite samples (XRD); (b) Plot of component weights of phyllites samples (XRD). Note: symbols meaning as in Table 1.
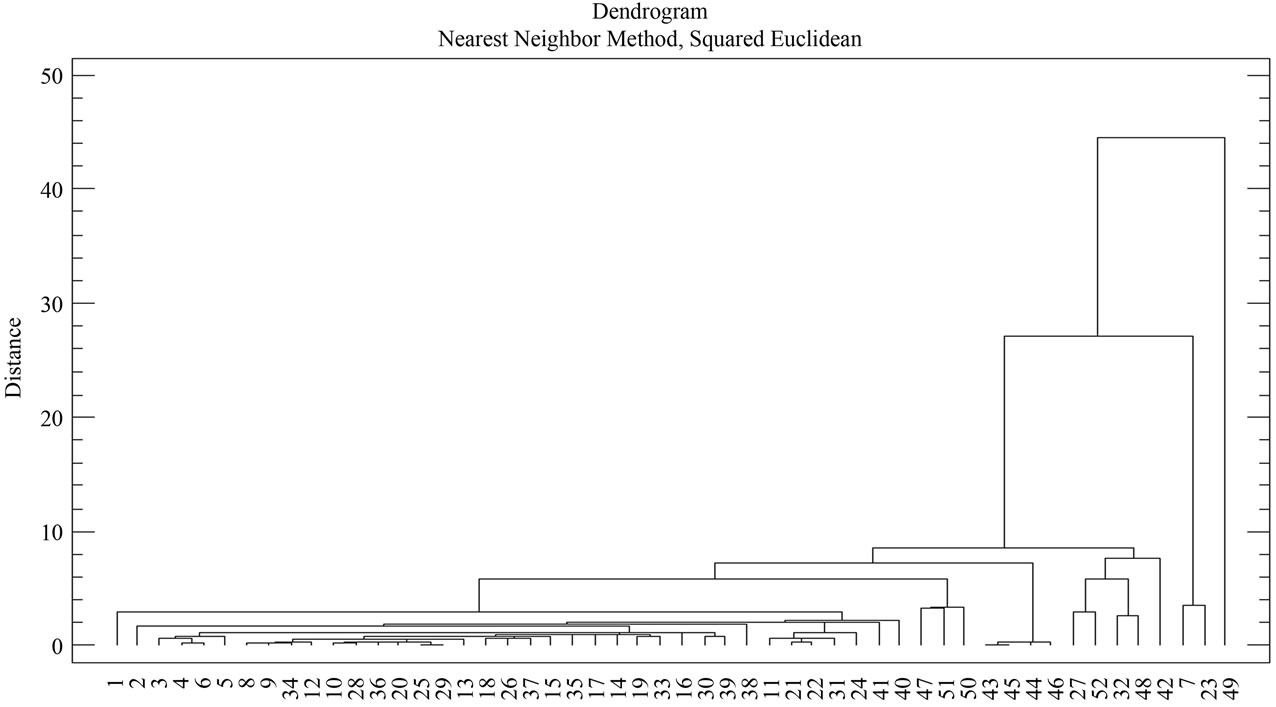
Figure 10. Dendogram of phyllite sample groups (XRD).
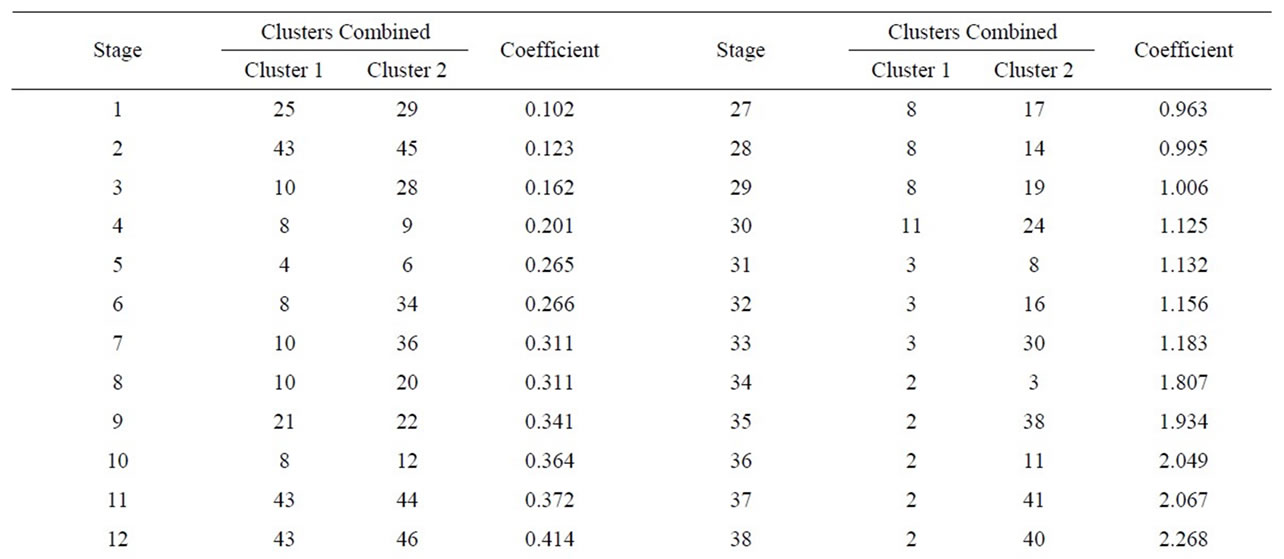
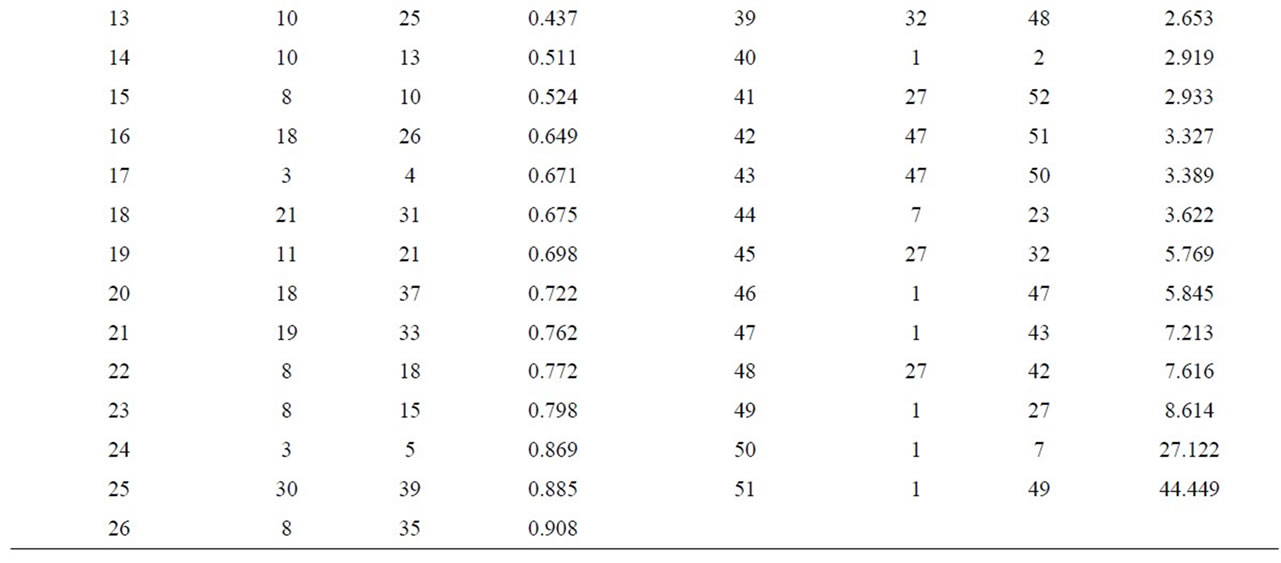
Table 7. Cluster analysis using the nearest-neighbour method and a Euclidean distance matrix (XRD).
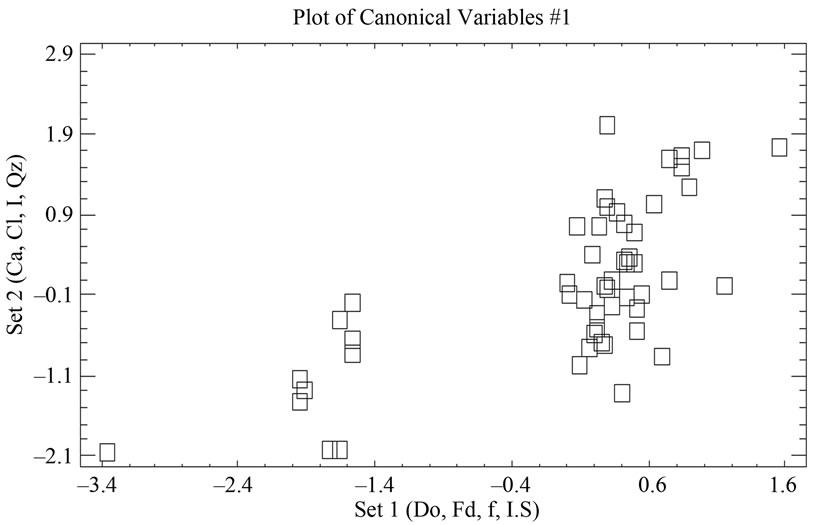
Figure 11. Representation of the samples and their groupings according to the scores of the first four components, from the logarithmic transformation of element concentration given by XRD.
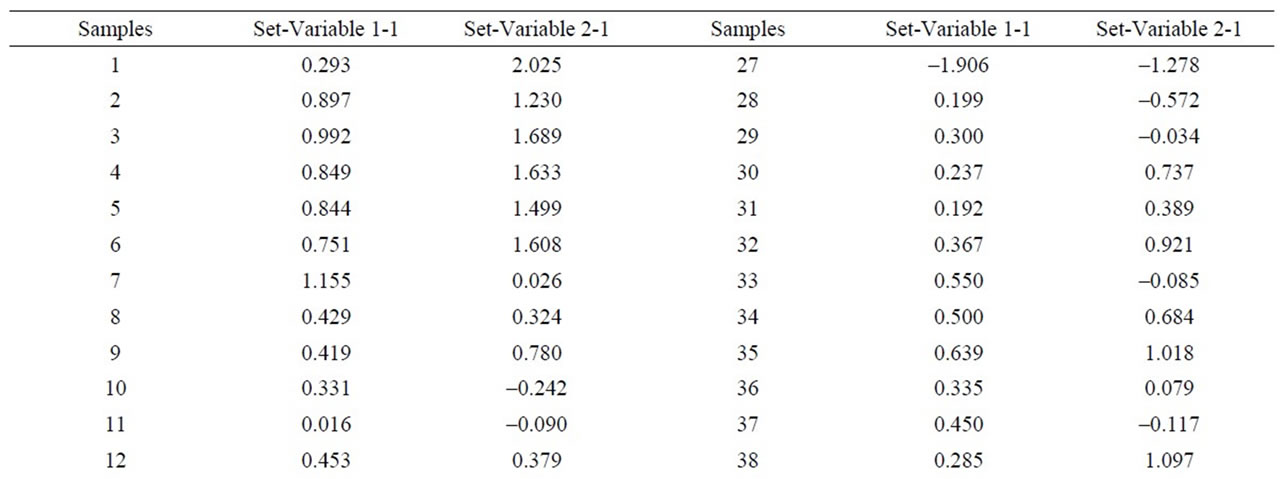
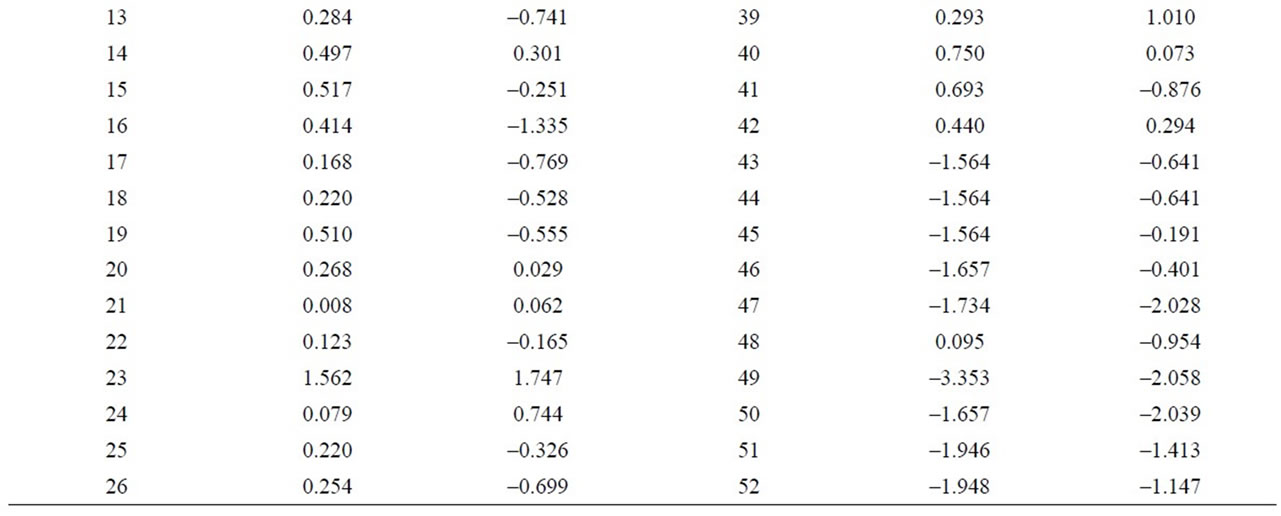
Table 8. Discriminant canonical analysis with the calculation the Mahalanobis distance (XRD).
negative values and higher than 1, on the other hand, samples 38 and 49 appear separated from the rest with a value higher than 1.5 (Figure 12 and Table 9). Equally, a correlation exists between the CaO + MgO content and dolomite, clearly separating sample 6 with a positive value (3.35), conversely, we have samples 51, 45, 47, 50, 52, 44, 49, 46, 48 and 43 with values lower than –1 (Figure 13 and Table 10). Lastly, the correlation was studied between weight loss at 110˚C y 1000˚C and minerals that lose water and carbon dioxide (illite + chlorite + dolomite), observing that a correlation existed, clearly separating sample 6 (1.97) and samples 43, 45, 47 with values higher than –2.5 (Figure 14 and Table 11).
4. Conclusions
From the present study, we can conclude that XRF of 52 phyllite samples (Almería and Granada, SE Spain) for chemical analysis of macro-elements (10), and after multivariate statistical analysis of the results, generates 2 groups: one in which the majority of samples are included, with two new subgroups, and a second group where we have only a sample (sample 26). By the same methodology, when microelements (39) are analyzed, a main group and an isolated sample appears (sample 23). Within the main group an isolated sample appears again (sample 24) and the rest of samples in another subgroup, where new blocks appear. One of them (block 2) contains an isolated sample (sample 49).
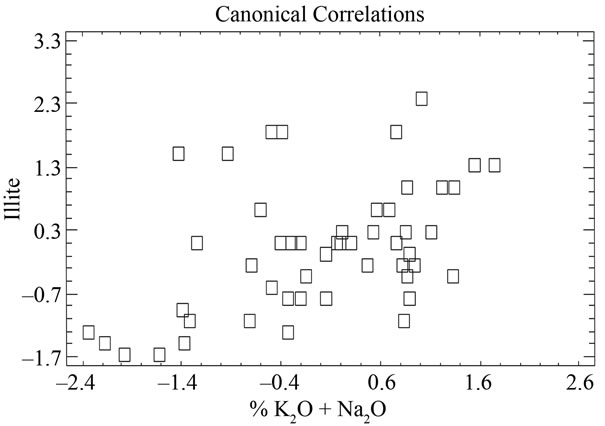
Figure 12. Canonical correlations between K2O + Na2O (XRF) content and Illite (XRD) content.
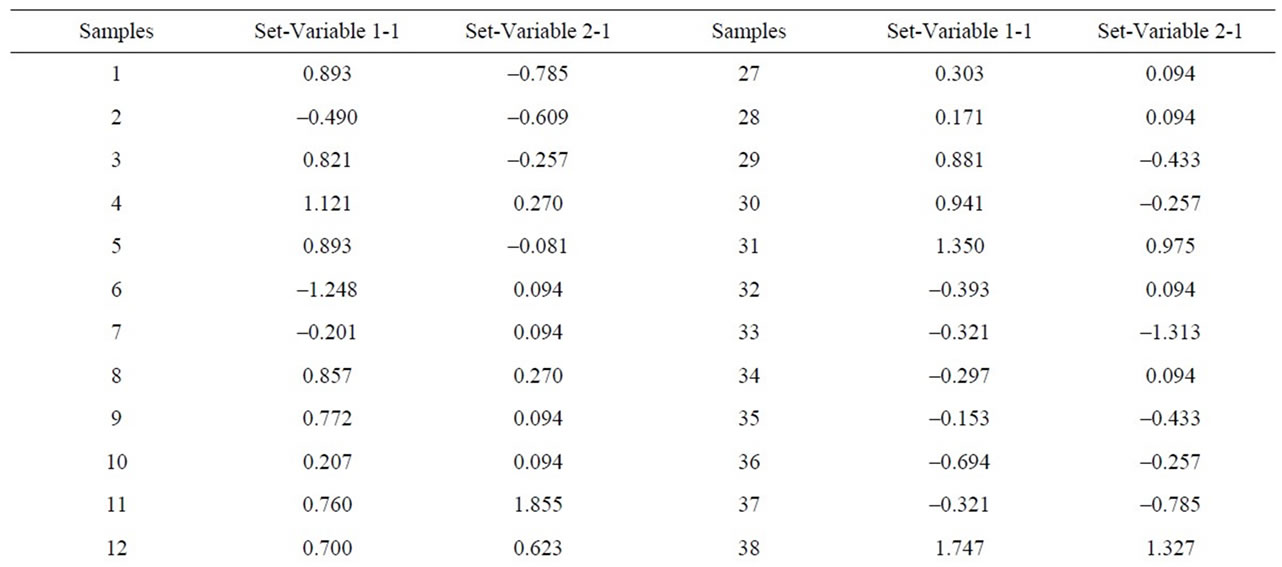
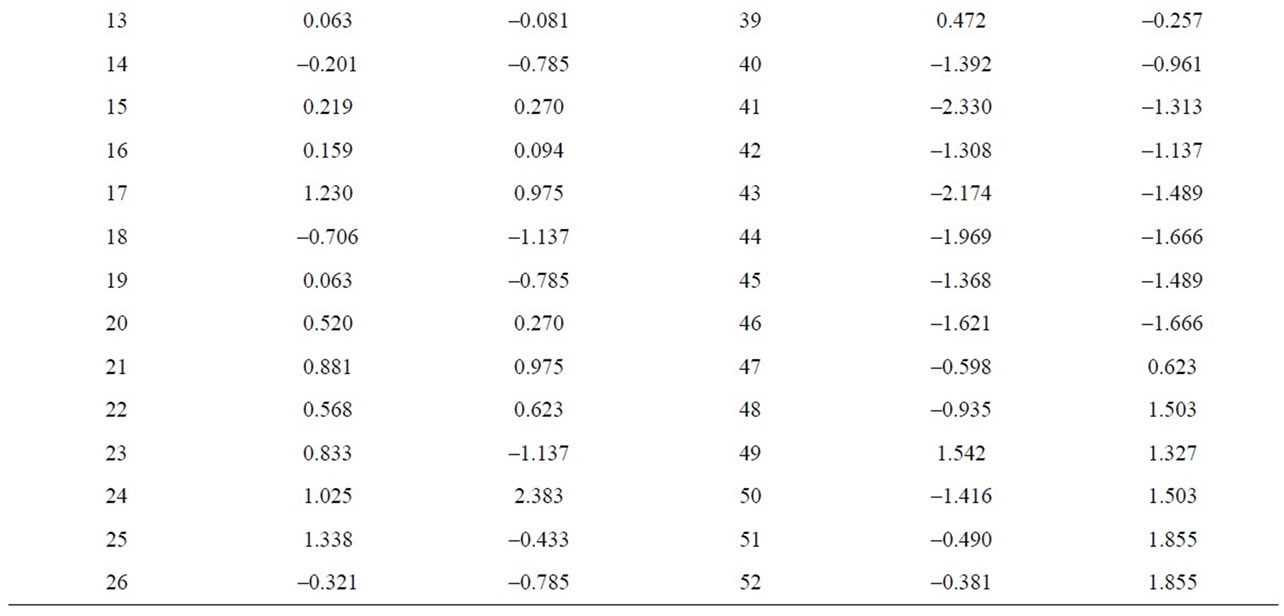
Table 9. Canonical correlations between K2O + Na2O (XRF) content and Illite (XRD) content.
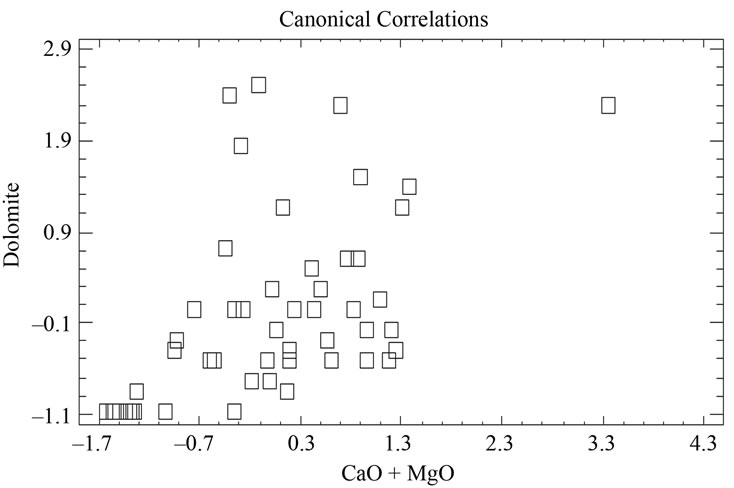
Figure 13. Canonical correlations between CaO + MgO (XRF) content and Dolomite (XRD) content.
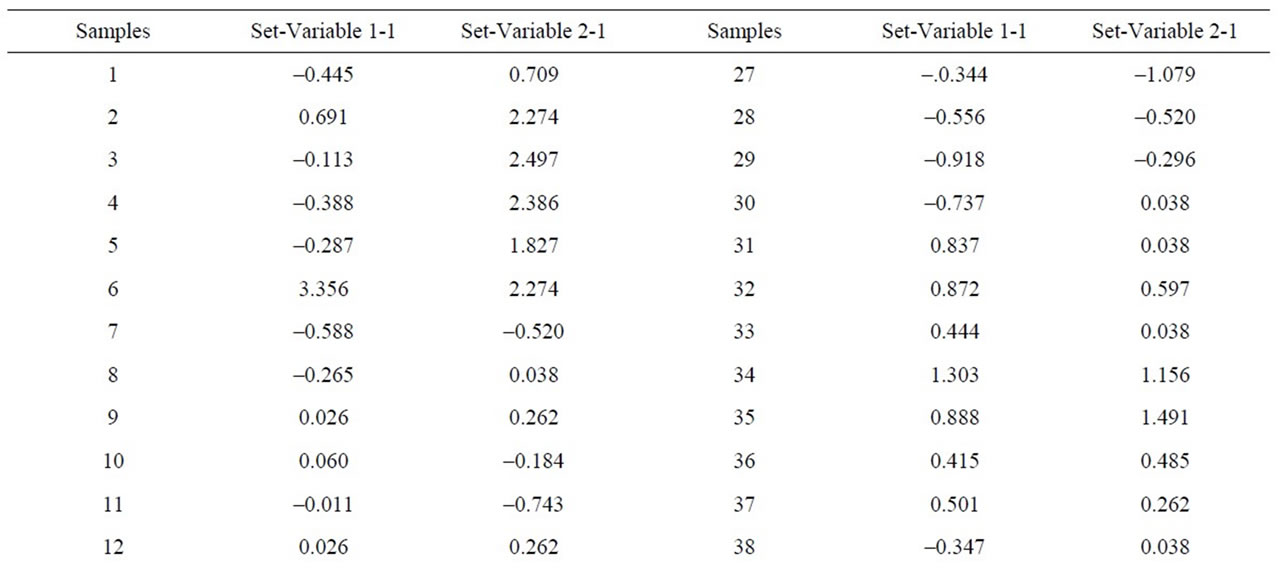
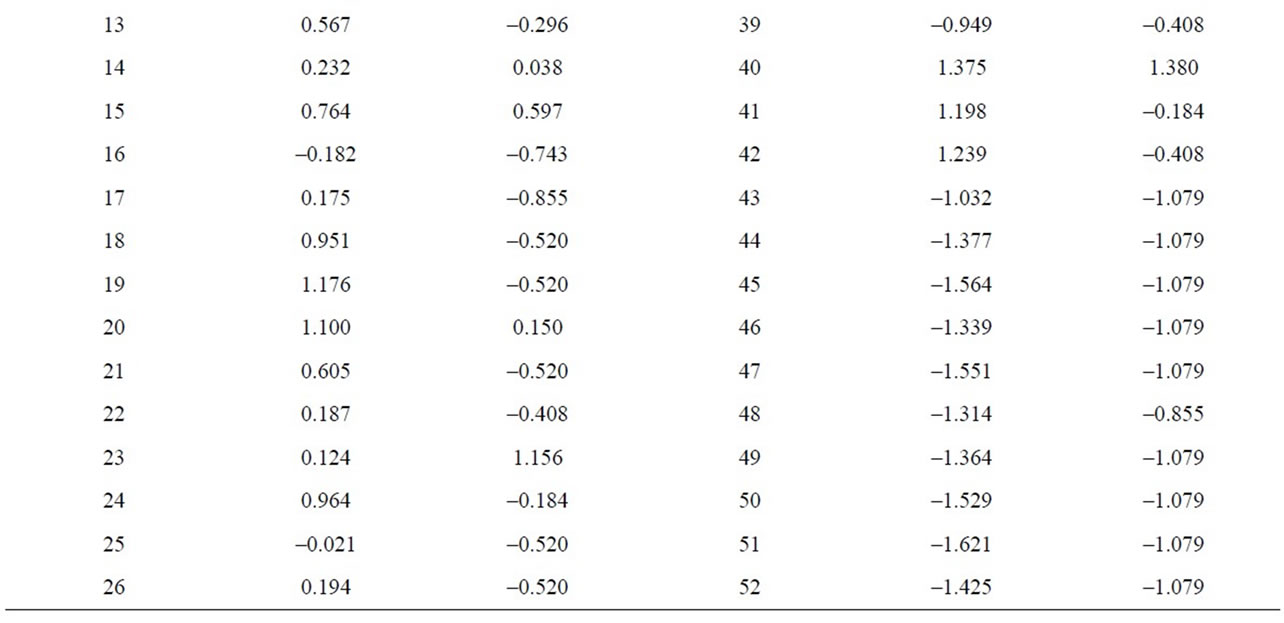
Table 10. Canonical correlations between CaO + MgO (XRF) content and Dolomite (XRD) content.
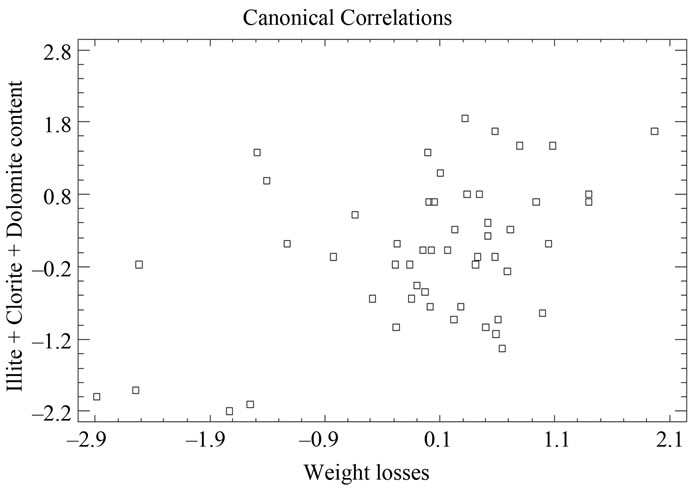
Figure 14. Canonical correlations between weight losses at 110˚C and 1000˚C, and Illite + Clorite + Dolomite (XRD) content.
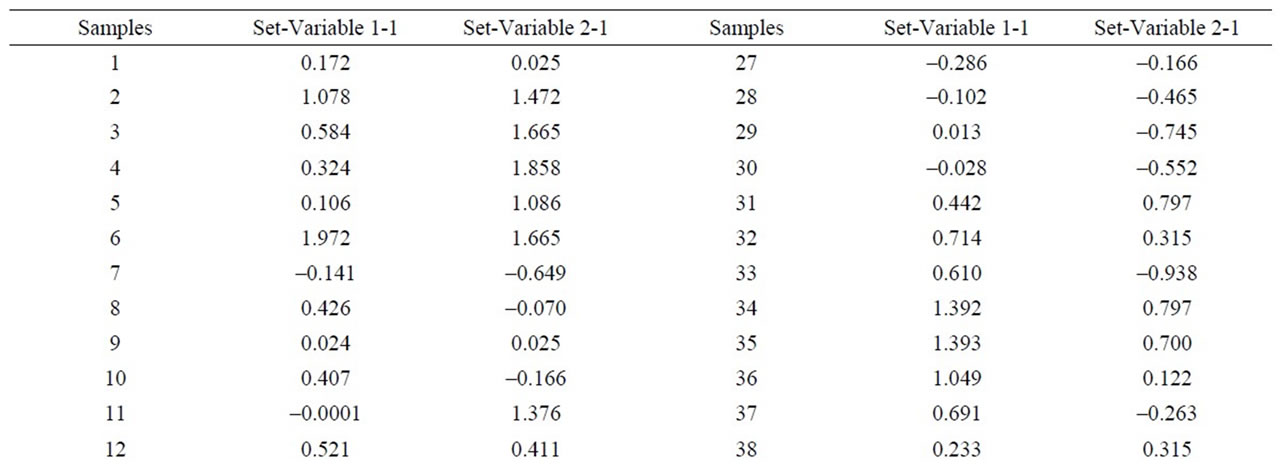
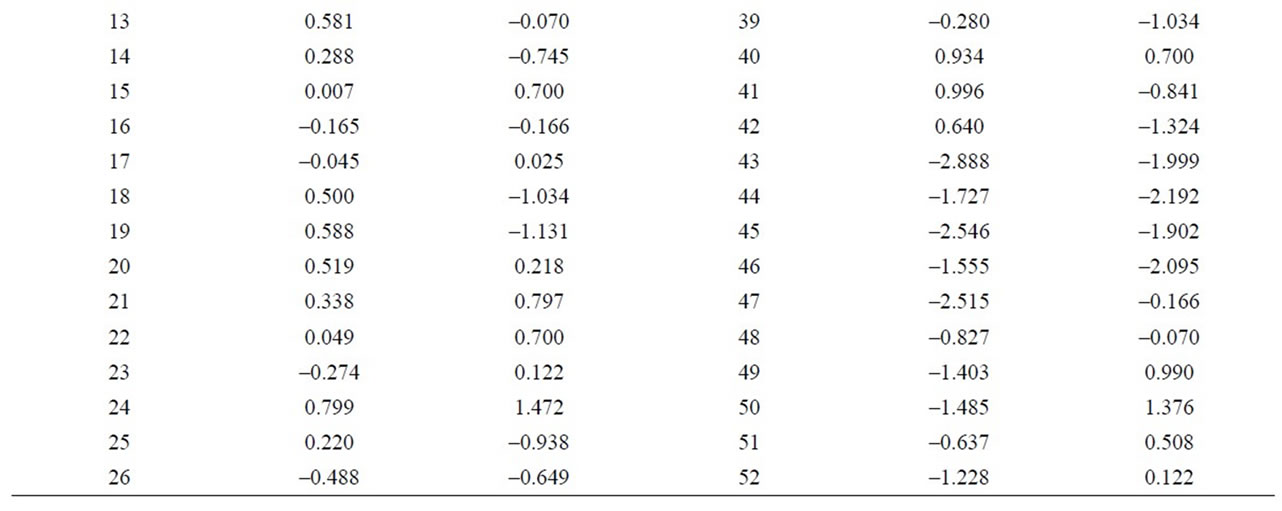
Table 11. Canonical correlations between weight losses at 110˚C and 1000˚C and Illite + Clorite + Dolomite (XRD) content.
When we apply the multivariate statistical analysis to the mineralogical results deduced by XRD, two groups appear: one with sample 49, which shows zero percentage of iron oxide, and the rest of the samples. The latter is classified in two subgroups: one with samples 7 and 23 and the other one with the rest of samples.
Hence, it is demonstrated that the methodology is adequate to compare the chemical and mineralogical composition of all these 52 samples and to find similarities and differences between them to allow a classification.
A correlation has also been observed between geographic location and XRF (macro-elements) separating subgroup 1 (as described in Section 4), showing lower proportion of MgO, which could be associated to its geological origin. In the same way, the microelements are more closely related to the mineralogical composition, while samples 49 and 23 appear separated from the rest in both analyses (XRF and XRD).
Several correlations can be deduced from XRF and XRD results, mainly between the alkaline content (Na2O + K2O) and illite, CaO and MgO with dolomite, and indirectly between the weight loss after heating at 1000˚C and the contents of phase minerals that lose structural water of silicates (illite + chlorite) or carbon dioxide (dolomite). The present investigation has interest and implications for geochemistry and analytical chemistry concerning earth rocks and silicate raw materials.
REFERENCES
- T. S. Valera, A. P. Ribeiro, F. R. Valenzuela-Díaz, A. Yoshiga, W. Ormangji and S. M. Toffoli, “The Effect of Phyllite as a Filler for PVC Plastisols,” Annual Technical Conference-Society of Plastics Engineers, Vol. 3, No. 60, 2002, pp. 3949-3953.
- P. Sousa, “Tecnología de Argilas Aplicada as Argilas Brasileiras,” Editorial E. Blutcher Ltd., Sao Paulo, 1975.
- A. Ramo, “Filita Región de Murcia Digital,” 2009. http://www.regmurcia.com
- I. Alcántara-Ayala, “The Torvizcón, Spain, Landslide of February 1996, the Role of Lithology in a Semi-Arid Climate,” Geophysical International, Vol. 38, 1999, pp. 1-3.
- L. Sarasola, “Cerro de la Peluca, Ona de Málaga,” 2002. http://global1toservers.com/pasoslargos.com/rutas/cerro-peluca.htm
- E. Garzón, I. G. García-Rodríguez, A. Ruiz-Conde and P. J. Sánchez-Soto, “Phyllites Used as Waterproofing Layer Materials for Greenhouses Crops in Spain: Multivariate Statiscal Analysis Applied to Their Classification Based on X-Ray Fluorescence Analysis,” X-Ray Spectrometry, Vol. 38, No. 5, 2009, pp. 429-438. doi:10.1002/xrs.1199
- B. Oliva-Urcia, J. M. Rahl, A. M. Schleicher and J. M. Parés, “Correlation between the Anisotropy of the Magnetic Susceptibility, Strain Ellipsoids and X-Ray Texture Goniometry in Phyllites from Créete, Greece,” Tectonophysics, Vol. 486, No. 1-4, 2010, pp. 120-131. doi:10.1016/j.tecto.2010.02.013
- X. M. Zhang, et al., “Stability Analysis of Tunnel Driven in Stratified Anisotropic Rockmass,” American Society of Civil Engineers, 2009. http://ascelibrary.org/proceedings/resource/2/ascecp/351/41044/37_1?isAuthorized=no
- T. Casia, A. Rodrigues, M. Giovanna and H. Alves, “Bioengineering Techniques Associated with Soil Nailing Applied to Slope Stabilization and Erosion Control,” American Society of Civil Engineers, Vol. 11, No. 2, 2010, pp. 43-48. doi:10.1061/(ASCE)1527-6988(2010)11:2(43)
- F. J. Suarez, F. A. Navarro and A. Ortiz, “Evolución Histórica de la Morfología Urbana y la Tipología Constructiva en el Altiplano Granadino,” Congreso Nacional de Historia de la Construcción, Vol. 2, 2005, pp. 1029- 1038.
- ANSE, “ANSE Denuncia: La Rotura de Los Taludes del Vertedero del Gorguel Provoca la Salida de Las Basuras al Exterior,” 2009. http://asociacionanse.org
- Anónimo, “Embalse de Beninar,” 2009. http:www.almediam.org/Itinerario%20Adra/Adra_008.htm
- A. Castillo, “Itinerario Hidrogeológico a Través de la Carretera Más Alta de Europa: Granada—Sierra Nevada (Veleta),” Hidrogeología y Recursos Hidráulicos, 2010, pp. 301-310.
- L. M. Carceller, “Al Sur de Sierra Nevada,” Suplemento El Caminante de El Mundo, 2006.
- A. Trobat, “Las dos Alpujarras al Sur de Granada,” Suplemento El Caminante de El Mundo, 2006.
- J. L. Mendoza, A. Fajardo and R. Carrasco, “Rocas y Minerales Industriales de Aplicación Ambiental en Agricultura e Industria,” Internacional Symposium of Environmental Geology, 2002.
- E. Garzón, I. G. García-Rodríguez, R. Bono, A. Ruizconde and P. J. Sánchez-Soto, “Composición y Propiedades Tecnológicas de Las Filitas de un Yacimiento de Berja (Almería),” Cerámica Información, Vol. 341, 2007, pp. 43-55.
- L. G. Schultz, “Quantitative Interpretation of Mineralogical Composition from X-Ray and Chemical Data for the Pierre Shale,” US Geological Survey, Professional Papers, 1964.
- P. E. Biscaye, “Mineralogy and Sedimentation of Recent Deep-Sea Clay in the Atlantic Ocean and Adjacent Sea and Oceans,” Bulletin of the Geological Society of America, Vol. 76, 1965, pp. 803-831. doi:10.1130/0016-7606(1965)76[803:MASORD]2.0.CO;2
- F. López-Aguayo, E. Galán-Huertos and J. L. MartínVivaldi, “Sobre la Mineralogía y Génesis de Dos Yacimientos de Caolín en la Provincia de Valencia,” Estudios Geológicos, Vol. 27, 1971, pp. 145-152.
- J. Parras, C. Sánchez-Jiménez, M. Rodas and F. J. Luque, “Ceramic Applications of Middle Ordovician Shales from Central Spain,” Applied Clay Science, Vol. 11, No. 1, 1996, pp. 25-41. doi:10.1016/0169-1317(96)00003-8
- M. M. Jordán, A. Boix, T. Sanfeliú and C. de la Fuente, “Firing Transformations of Cretaceous Clays Used in the Manufacturing of Ceramic Tiles,” Applied Clay Science, Vol. 14, No. 4, 1999, pp. 225-234. doi:10.1016/S0169-1317(98)00052-0
- B. Dolinar, “A Simplified Method for Determining the External Specific Surface Area of Non-Swelling Fine Grained Soils,” Applied Clay Science, in press, 2012.
- P. J. Sánchez-Soto, M. C. Jiménez de Haro, L. A. PérezMaqueda, I. Varona and J. L. Pérez-Rodríguez, “Effects of Dry Grinding on the Structural Changes of Kaolinite Powders,” Journal of the American Ceramic Society, Vol. 83, No. 7, 2000, pp. 1649-1657. doi:10.1111/j.1151-2916.2000.tb01444.x
- P. J. Sánchez-Soto, “Efecto del Tratamiento Mecánico por Molienda en las Propiedades Texturales de Pirofilita,” Boletín de la Sociedad Española de Cerámica y Vidrio, Vol. 48, 2009, pp. 59-68.
- H. Mommsen, “Provenance Determination of Pottery by Trace Element Analysis: Problems, Solutions and Applications,” Journal of Radioanalytical and Nuclear Chemistry, Vol. 247, No. 3, 2001, pp. 657-662. doi:10.1023/A:1010675720262
- E. K. Bakraji, “Application of Multivariate Statistical Methods to Classify Archaeological Pottery from Telalramad Site, Syria, Based on X-Ray Fluorescence Analysis,” X-Ray Spectrometry, Vol. 35, No. 3, 2006, pp. 190-194. doi:10.1002/xrs.893
- P. Sánchez-Soto, A. Ruiz-Conde, R. Bono, M. Raigón and E. Garzón, “Thermal Evolution of a Slate,” Journal of Thermal Analysis and Calorimetry, Vol. 90, No. 1, 2007, pp. 133-141. doi:10.1007/s10973-007-7751-2
NOTES
*Corresponding author.