American Journal of Analytical Chemistry
Vol. 3 No. 1 (2012) , Article ID: 16792 , 6 pages DOI:10.4236/ajac.2012.31002
Chemical Dosimetry during Alpha Irradiation: A Specific System for UV-Vis in Situ Measurement
Unité Mixte de Recherche 6457, École des Mines de Nantes Université de Nantes, Nantes, France
Email: johan.vandenborre@subatech.in2p3.fr
Received June 29, 2011; revised August 18, 2011; accepted September 2, 2011
Keywords: In Situ UV-Vis Measurement; Chemical Dosimetry; High Energetic α Irradiation; Ferric Ion Radiolytic Yield
ABSTRACT
This paper is devoted to the study of the potentiality of the Fricke dosimeter for the characterization of the highly energetic (62.1 MeV) α particles beams generated by a new cyclotron facility, namely ARRONAX started in 2009. Such for this high energetic α beam, in situ dosimetry is performed in order to avoid radiation safety inconvenience and to earn run time of irradiation. Therefore, an in situ Fricke dosimetry protocol is developed and its reliability is checked by comparison with other experiments carried out by using the traditional method (ex situ Fricke dosimetry) within another cyclotron facility (CEMHTI) and by comparison with literature data. To author’s knowledge, it is the first time that Fricke dosimetry is performed during the α irradiation experiment. The results of these in situ dosimetry experiments show that the value of ferric ions radiolytic yield (G(Fe3+) = (11.7 ± 1.2) 10–7 mol·J–1) extrapolated from literature data can be used for this higher energy of α particles (Eα = 62.1 MeV).
1. Introduction
The Fricke dosimeter [1] is the most suitable system to measure directly the dose set down in a solution [2]. This chemical dosimeter is frequently used whatever the radiation source providing the irradiation (a, b, g, n, H+ or heavy elements). It is considered as reliable and easily to apply in many cases. However, in the case of a irradiation, the radiolytic yield of ferric ion (G(Fe3+)) value is studied in the literature for an ion beam energy value until 40 MeV [3-9] but the G(Fe3+) values are unknown for higher energy. Since a few months, a new irradiation facility is available (Saint-Herblain, France): ARRONAX cyclotron, providing α and proton beams, with energy up to 67 MeV. In order to characterize the 67 MeV a ion beam, we propose a new method using the Fricke dosimeter during the irradiation experiment. Moreover, these in situ Fricke dosimetry experiments allow us to avoid radiation safety problem, using short irradiation time. Note that the amount of generally restricted irradiation time dedicated to the time consuming Fricke dosimetry is dramatically reduced. Finally, these in situ dosimetry results are compared to the ones from the literature data and to the ex situ experiments results performed in the CEMHTI cyclotron facility with a lower energy value range (28 - 45 MeV). According to us, it is the first time that an in situ Fricke dosimetry experiment, i.e. during the irradiation, is performed under such high energy α beam (67 MeV).
2. Experimental
2.1. α Irradiations
α irradiations are provided by the CEMHTI cyclotron (Orléans, France) and by the ARRONAX cyclotron (Saint-Herblain, France) facilities. The simultaneous use of both cyclotrons allows us to explore a wide range of energy since the CEMHTI cyclotron can generate α particles beams (4He2+) with energies of 28 or 45 MeV while with ARRONAX cyclotron this energy can reach 67 MeV.
The energy of the α particles inside the irradiation cell is systematically evaluated by using the SRIM 2008 simulation code. The whole of the obstacles upstream of the cell is taken in account in this calculation. The irradiation cell, made in PEEK polymer, is equipped with a borosilicate glass disc as entrance window (Diameter = 12 mm). Its thickness varies between 150 and 450 µm. Thus, after the calculations, we can establish that the range of energy explored varies from 6.7 to 62.1 MeV (Table 1).
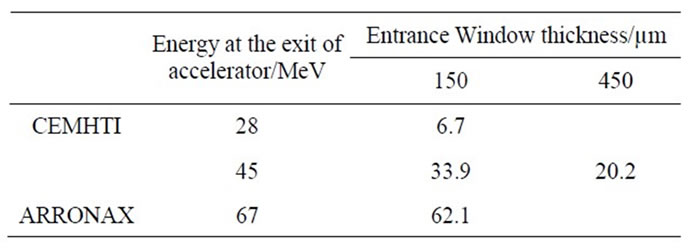
Table 1. Calculated energies of α particles inside the irradiation cell (SRIM2008).
Providing by the CEMHTI cyclotron, the flux of α particles within the irradiation cell is measured with a Faraday cup and set to 10 nA depending on the experiment. Beforehand, the stability of the α beam was checked by monitoring the beam current set down in an ionization chamber (measured at 40 nA) located upstream to the irradiation cell. The irradiation time varies between 2 s to 40 min, according to the desired irradiation dose.
Thus, the doses received by the target are calculated using Equation (1). On the measurements mentioned, we deduce the dose rate.
 (1)
(1)
With:
• DP, the physical dose (Gy),
• Q, the total charge delivered to the target (C),
• E, the energy of 4He2+ inside the cell (MeV),
• fc, the conversion factor (1 MeV = 1.602 × 10⁻¹³ J),
• q, the electron charge (1.602 × 10⁻¹⁹ C),
• V, the irradiated volume (cm3),
• ρ, the density of the target.
Other experiments are carried out within ARRONAX cyclotron at 62.1 MeV. Within ARRONAX cyclotron, experimental device allowing an accurate beam current measurement to determine the intensity inside the irradiation cell does not exist yet. Thus, the dose can not to be easily extracted from the current value. However, the intensity of the particles beam, measured on an internal Faraday cup located one meter upstream, is maintained successively at 20, 40 then 70 nA. The uncertainty of that current measurement is of 10%. In our work, these intensity values are compared to the ones in the irradiation cell evaluated by using the in situ Fricke dosimeter.
2.2. Fricke Dosimetry
Fricke dosimetry is one of the most popular chemicalmethod used in radiochemistry to evaluate the dose received by an aqueous solution [1,2]. This method is based on the oxidation of Fe2+ to Fe3+ by the species produced by the water radiolysis reactions. The concentration of ferric ions is monitored by UV-Vis measurements at 304 nm (ε = 2197 mol−1·L·cm−1) with a spectrophotometer CARY- 4000 (VARIAN) via two 20 meter long fiberoptics and a UV-Vis probe (HELLMA optical path 10 mm). These measurements are usually carried out on samplings taken few minutes after irradiation; these experiments are considered as ex situ. During the experiments carried out at the ARRONAX cyclotron, the Fe3+ content is determined by in situ measurements realized by using an UV-Visible cell connected to the spectrophotometer via fiberoptics. It is important to note that this technology can not be used during the experiments carried out within the CEMHTI cyclotron.
Fricke solution consists in a ferrous sulphate and NaCl (1 mmol·L−1) dissolved in aerated aqueous 0.4 mol·L−1 H2SO4 solution. NaCl is added to suppress the effect of any organic impurities. We can distinguish the standard Fricke solution ([Fe2+] = 1 mmol·L−1) to the super Fricke solution which is ten times more concentrated ([Fe2+] = 10 mmol·L−1). According to the literature, the use of the super Fricke solution extends the available dose range by enhancing the upper limit without affecting the radiolytic yield [2].
Using Fricke dosimetry, the dose received by the solution is determined according the Equation (2).
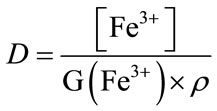 (2)
(2)
With:
• D, the dose received by Fricke solution (Gy),
• [Fe3+], the ferric ions concentration (mol·L−1),
• G(Fe3+), the radiolytic yield of oxidation of ferricions (mol·J−1),
• ρ, the density of the irradiated solution (1.024 at 295 K for an aqueous 0.4 mol·L−1 H2SO4 solution).
Fricke and super Fricke solutions are prepared by dissolving the desired quantity of ferrous sulphate ([Fe2+] = 1 and 10 mmol·L−1) and NaCl (1 mmol·L−1) in aerated aqueous 0.4 mol·L−1 H2SO4 solutions. All reagents are analytical grade or equivalent. At the CEMHTI cyclotron, 20 mL of solution are introduced into the irradiation cell then placed under a strong magnetic stirring. At the ARRONAX, cyclotron the solution volume is 70 mL. According to our present knowledge, no significant effect in this range of the volume of solution was reported in the literature. During the irradiation, the cell is closed.
3. Results and Discussion
3.1. Ex Situ Fricke Dosimetry
The use of the Fricke method for the evaluation of the dose value is only possible if the value of oxidation yield of ferrous ions is known under the experimental conditions (energy, intensity). The analysis of the literature data shows that, for an α radiation, no G(Fe3+) value is available for energies higher than 40 MeV [3-7,9,10]. The use of this chemical dosimeter under the irradiation conditions of ARRONAX will be possible that after evaluation of G(Fe3+) value.
Chemical dosimeters are often calibrated toward primary dosimeters such as calorimeters or ionization chambers [11]. However, the literature shows that the use of other dosimeters, such as Faraday cup, remains possible [12]. Today, no physical dosimeter is available on the site of ARRONAX cyclotron. Then, the G(Fe3+) value could be evaluated only by extrapolation of the literature data.
Preliminary measurements are carried out within the CEMHTI cyclotron in order to find any G(Fe3+) values for energies lower than 40 MeV. For these determinations, an external Faraday cup is used as standard dosimeter. Irradiations are carried out by applying a constant intensity (Icell = 10 nA) into the irradiation cell. The current profile is systematically recorded with an ionization chamber (located upstream to the irradiation cell) where the current is measured at 40 nA (Ibeam). This profile revealed a good stability of the α beam. Thus, the uncertainty on the determination of the dose is evaluated to 10%. The difference (Ibeam/Icell = 4) between the measured intensity at the ionization chamber and that measured within the irradiation cell reflects losses on the way of the beam.
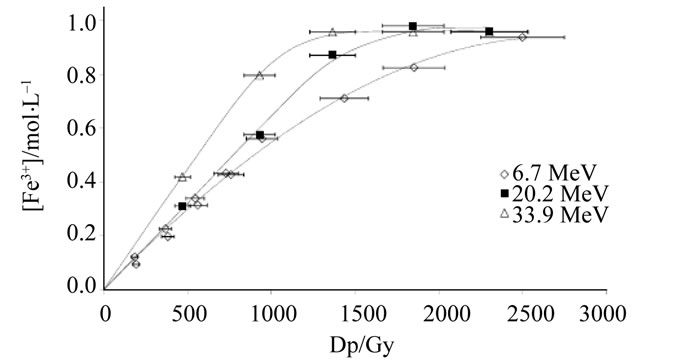
Figure 1 presents the evolution of the Fe3+ content according to the dose received by the Fricke solution and the energy. Curves show that ferric ions content increases gradually within the dose received by solution. With the standard Fricke solution (Figure 1(a)), a linear variation is observed for low doses values (lower than 1000 Gy). This field of linearity is used for the G(Fe3+) value evaluation. Beyond 1000 Gy, the curves reach a plateau corresponding to the exhaustion of ferrous ions into solution. The increase in the content of ferric ions is faster when energy increases: G(Fe3+) value seems to be linked to the energy of the α beam. The use of the super Fricke solution is well-known in order to increase the upper limit of measurable dose [2]. Figure 1(b) illustrates that the linearity is preserved on all the range of explored doses (up to 2500 Gy). So, the super Fricke solution is particularly adapted to the high dose rates such as α beam providing by the ARRONAX cyclotron.
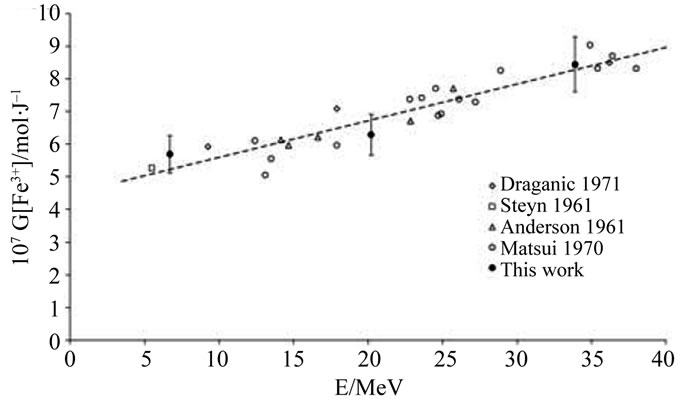
Experimental values of G(Fe3+) are presented in Table 2. Figures 2(a) and (b) show that there is a good agreement between our experimental values and the literature data. It thus assumes that, under our experimental conditions, the use of a Faraday cup is quite satisfactory. The dependence of G(Fe3+) with the energy of the α particles was already observed in the literature [6,8]. This dependence can be explained qualitatively by track theory. Indeed, when a Fricke solution is irradiated, there is a competition between two types of reaction:
 (a)
(a) (b)
(b)
Figure 1. Evolution of ferric content versus dose received by (a) Fricke ([Fe2+] = 1 mmol·L−1) and (b) super Fricke ([Fe2+] = 10 mmol·L−1) aerated solutions.
 (a)
(a)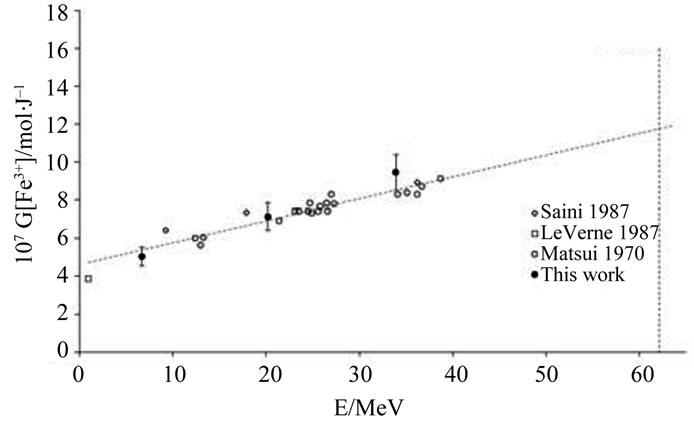 (b)
(b)
Figure 2. Dependence of G(Fe3+) on particles energies for (a) Fricke and (b) super Fricke aerated solutions.
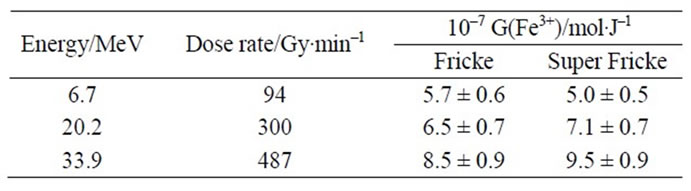
Table 2. Experimental values of radiolytic yields of ferric ions.
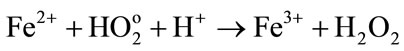
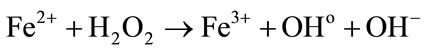
• In one hand, the oxidation of ferrous ions by the radiolytic species
 (3)
(3)
 (4)
(4)
 (5)
(5)
 (6)
(6)
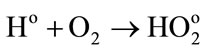
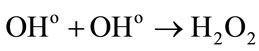
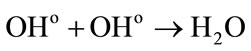
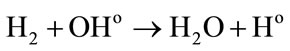
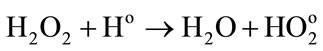
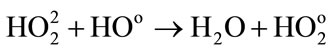
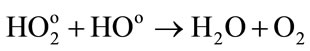
• In other hand the reactions between the water radiolytic species.
 (7)
(7)
 (8)
(8)
 (9)
(9)
 (10)
(10)
 (11)
(11)
 (12)
(12)
 (13)
(13)
 (14)
(14)
Low energies (thus high LET) support the reactions between the water radiolytic species. Consequently, the quantity of ferrous ions undergoing oxidation via reactions (3) (5) and (6) is lower. When the energy increases (thus when the LET value decreases), the water radiolytic species are scattered in the bulk of the aqueous solution. The reactions of oxidation of ferrous ions by the water radiolytic species are increasingly favored and G(Fe3+) value increases.
Results show a slight difference between the yield values determined in Fricke and super Fricke solutions. This difference was already observed in the literature and could be explained, at least in part, like resulting from a better contribution of reaction (3) in the concentrated solution [6,8]. In our case, this can also be partially explained by a lack of experimental data for the lower doses. This assumption could be easily checked by taking in situ UV-Visible measurements. The super Fricke solution seems to be the most adapted to the high dose rates and will be used within the ARRONAX cyclotron.
3.2. In Situ Fricke Dosimetry
Irradiations are carried out on aerated super Fricke solutions. The absorbance of the solution is followed continuously with an UV-Visible cell linked to the spectrophotometer using fiberoptics. This technology allows the acquisition of a great number of experimental points while reducing considerably the handling time. At our knowledge, it is the first time that an in situ Fricke dosimetry is performed during an α irradiation with this so high energy (62.1 MeV).
Results are presented on Figure 3. The ferric ions content increases progressively during the irradiation. The global shape of the curves demonstrates the stability of the particle beam. Moreover, the curve slope varies with the α beam intensity set down in the irradiation cell. These results are consistent with the literature data which take into account the intensity in the G(Fe3+) determination [6]. These authors have shown that higher is the intensity higher is the G(Fe3+) value. Our results, in Figure 3, confirm this hypothesis by showing three curves slopes which increase with the α beam intensity.
An empirical law is determined by using the experimental and the literature data. In fact, we extrapolate from litterature data done for the range 10 - 40 MeV an estimated G(Fe3+) value for the ARRONAX ion beam energy (62.1 MeV) (cf. Figure 2(b)). From this empirical law, we deduced the G(Fe3+) value at 62.1 MeV, the energy inside the irradiation cell within ARRONAX with an uncertainty of 10% corresponding to the measurements in the ex situ experiments. This value is G(Fe3+) = (11.7 ± 1.2) × 10–7 mol·J–1.
Knowing the G(Fe3+) value in this energy, it is then possible to estimate the intensity inside the irradiation cell. We compare the intensity measured by the internal faraday cup into the beam (called “Ibeam”) and the intensity of the ion beam deposited into the irradiation cell (called “Icell”). The Ibeam values are measured before each irradiation experiment by the faraday cup system. The Icell values are calculated by the Equations (1) and (2) and can be written as:
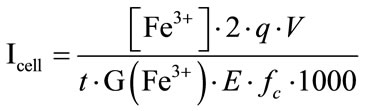 (15)
(15)
where:
• Icell, the intensity of the α particle beam deposited into the irradiation cell (A),
• [Fe3+], the ferric ions concentration (mol·L–1),
• G(Fe3+), the extrapolated radiolytic yield of oxidation of ferric ions (mol·J–1),
• E, the energy of 4He2+ inside the cell (MeV),
• fc, the conversion factor (1 MeV = 1.602 × 10⁻¹³ J),
• q, the electron charge (1.602 × 10⁻¹⁹ C),
• V, the irradiated volume (cm3),
• t, the duration of the irradiation (s).
The calculated values are indicated in Table 3 with the values of intensity and of ferric ions concentration measured after one minute of irradiation performed in the

Figure 3. Evolution of ferric ions content in a super Fricke aerated solution under an α irradiation at 62.1 MeV.

Table 3. Calculated values of intensity inside the irradiation cell (Icell) vs current values measured at the internal Faraday cup (Ibeam) with an uncertainty of 10% for the two cyclotron facilities.
CEMHTI cyclotron. Moreover, we add the ferric ion concentration values for irradiation duration of 60 seconds (cf. Figure 3) in order to get the Icell value, i.e. the intensity of the charge deposited into the irradiation cell. We have chosen this time of duration because after it the ratio signal onto noise is less better due to the too high optical density measurements (above 2); below this value the data are quite useable.
The Figure 4 presents the Ibeam vs Icell curve in order to show the linearity between the intensity values of the α particle beam and the intensity of the charge deposited into the irradiation cell for the ARRONAX cyclotron facility. Although, we could not directly measure the intensity into the irradiation cell, we have confirmed that the values determined are consistent each other. Moreover, from the literature data, we have checked that the extrapolated radiolytic yield of ferric ions for the very high energy of the ARRONAX cyclotron (62.1 MeV) is consistent with our in situ results. So, we suggest we can use this G(Fe3+) value of (11.7 ± 1.2) × 10–7 mol·J–1 until we can measure directly the intensity deposited in the irradiation cell.
During CEMHTI experiments, we have confirmed the determination of G(Fe3+) values by the current measured into the faraday cup. For ARRONAX experiments, we have successfully used a G(Fe3+) extrapolated value to determine the current set down into the irradiation cell. Moreover, we notice that the ratio value (Ibeam/Icell = 4.0) for CEMHTI experiments is close to the one deter-

Figure 4. Ibeam = f(Icell) curve for an α ion beam providing by the ARRONAX cyclotron facility.
mined onto the ARRONAX experiments (4.1 < Ibeam/Icell < 6.7) though the ions beam lines are not the same. That is the reason why it is possible to compare the irradiation experiments results performed onto the two cyclotron facilities for a high range of α particles energy (6.7 < Eα < 62.1 MeV).
4. Conclusions
In this study, we have determined the radiolytic yields of ferric ions for the Fricke dosimetry with a large range of α particles energy (6.7 - 62.1 MeV). Moreover, we have compared the results get by ex situ and in situ experiments. The methodology proposed in this work gives us any information onto the using of the Fricke dosimeter.
The radiolytic yield of ferric ions values determined in this study are consistent each other and with the literature data for the range of energy of 6.7 - 33.9 MeV whatever the initial ferrous ions concentration (Fricke or superFricke solution). However, for a high dose (above 1 kGy) the Fricke solution can not be used due to the highest consumption of ferrous ions by the water radiolytic species.
At our knowledge, it is the first time that the Fricke dosimeter is used into an in situ experiment, i.e. during the irradiation. We have made the evidence we can use this experimental methodology during the α irradiation with a high energy (62.1 MeV) providing by the new ARRONAX cyclotron facility. At the same time, we have confirmed that the radiolytic yield of ferric ions value extrapolated from the literature data (G(Fe3+) = (11.7 ± 1.2) × 10–7 mol·J–1) can be used to determine the current set down into the irradiation cell with a ratio Ibeam/Icell = 4.0 close to the one measured onto the well-tried CEMHTI cyclotron facility.
To conclude, in order to earn run time of irradiation and to avoid radiation safety constraints we will use the in situ superFricke dosimetry for each irradiation experiment performed onto the ARRONAX cyclotron facility. This work validates this methodology in our experimental conditions (α, 67 MeV, 20 - 70 nA).
5. Acknowledgements
We want to thank the CEMHTI cyclotron team and the ARRONAX cyclotron team for their helpful work.
REFERENCES
- H. Fricke and E. J. Hart, “Chemical Dosimetry, Radiation Dosimetry,” In: F. H. Attix and W. C. Roesch, Eds., Academic Press, New York, 1966.
- R. W. Matthews, “Aqueous Chemical Dosimetry,” The International Journal of Applied Radiation and Isotopes, Vol. 33, No, 11, 1982, pp. 1159-1170. doi:10.1016/0020-708X(82)90241-1
- A. R. Anderson and E. J. Hart, “Molecular Product and Free Radical Yields in the Decomposition of Water by Protons, Deuterons, and Helium Ions,” Radiation Research, Vol. 14, No. 6, 1961, pp. 689-704. doi:10.2307/3571010
- Z. D. Draganic and I. G. Draganic, “The Radiation Chemistry of Water,” Academic Press, 1971, New York, USA.
- J. A. LaVerne and R. H. Schuler, “Radiation Chemical Studies with Heavy Ions: Oxidation of Ferrous Ion in the Fricke Dosimeter,” Journal of Physical Chemistry, Vol. 91, No. 22, 1987, pp. 5770-5776. doi:10.1021/j100306a050
- M. Matsui, H. Seki, T. Karasawa and M. Imamura, “Radiation Chemical Studies with Cyclotron Beams, (I) Fricke Solution,” Journal of Nuclear Science and Technology, Vol. 7, No. 2, 1970, pp. 97-104. doi:10.3327/jnst.7.97
- R. D. Saini and P. K. Bhattacharyya, “Radiolytic Oxidation of U(IV) Sulphate in Aqueous Solution by Alpha Particles from Cyclotron,” International Journal of Radiation Applications and Instrumentation. Part C. Radiation Physics and Chemistry, Vol. 29, No. 5, 1987, pp. 375-379. doi:10.1016/1359-0197(87)90009-9
- R. H. Schuler and A. O. Allen, “Radiation Chemistry Studies with Cyclotron Beams of Variable Energy: Yields in Aerated Ferrous Sulfate Solution1,” Journal of the American Chemical Society, Vol. 79, No. 7, 1957, pp. 1565-1572. doi:10.1021/ja01564a012
- J. Steyn and D. Van As, “Radiolytic Oxidation of Ferrous Solutions with Standardized Internal Sources of Polonium-210,” Nature, Vol. 191, No. 4791, 1961, pp. 903- 904. doi:10.1038/191903a0
- A. Samouilov, V. Roubaud, P. Kuppusamy and J. L. Zweier, “Kinetic Analysis-Based Quantitation of Free Radical Generation in EPR Spin Trapping,” Analytical Biochemistry, Vol. 334, No. 1, 2004, pp. 145-154. doi:10.1016/j.ab.2004.07.026
- M. Anton, “Development of a Secondary Standard for the Absorbed Dose to Water Based on the Alanine EPR Dosimetry System,” Applied Radiation and Isotopes, Vol. 62, No. 5, 2005, pp. 779-795. doi:10.1016/j.apradiso.2004.10.009
- B. Pastina and J. A. LaVerne, “Hydrogen Peroxide Production in the Radiolysis of Water with Heavy Ions,” The Journal of Physical Chemistry A, Vol. 103, No. 11, 1999, pp. 1592-1597. doi:10.1021/jp984433o