American Journal of Industrial and Business Management
Vol.06 No.12(2016), Article ID:72953,11 pages
10.4236/ajibm.2016.612105
A Study of Tourist Loyalty Driving Factors from Employee Satisfaction Perspective
Ronglin Xu1,2, Jianqiong Wang1
1School of Economics and Management, Southwest Jiaotong University, Chengdu, China
2Jiuzhaigou Administration Bureau, Jiuzhaigou County, China

Copyright © 2016 by authors and Scientific Research Publishing Inc.
This work is licensed under the Creative Commons Attribution International License (CC BY 4.0).
http://creativecommons.org/licenses/by/4.0/


Received: November 17, 2016; Accepted: December 20, 2016; Published: December 23, 2016
ABSTRACT
With the continuous development of tourism, the driving mechanism of tourist loyalty has become one of the hot topics in the tourist behavior study. Existing researches often explore this question with little focus on the interaction of tourist and employees. This paper, however, proposes a conceptual model of tourist loyalty from employee satisfaction perspective. Our hypothesis is that service quality and tourist loyalty could directly be affected by employee satisfaction and indirectly be affected by employee emotion. To test this, we take Jiuzhaigou and Huanglong scenic spots as examples in the empirical study. The research results reveal that among the three latent variables of employee satisfaction, working environment and living conditions affect service quality of employee positively, meanwhile, working environment, living conditions and working rewards indirectly affect service quality through employee emotion. Service quality affects the tourist loyalty significantly. To cultivate tourist loyalty and achieve sustainable tourism development, scenic spots should take more measures to enhance their employee satisfaction and tourism service quality.
Keywords:
Tourist Loyalty, Employee Satisfaction, Service Quality, Employee Emotion, Scenic Spot

1. Introduction
Customer loyalty directly affects the efficiency of enterprises. In the service industry, an enterprise can increase its profits by 25% to 85% if its customer defection rate is reduced by 5% [1] . Under such increasingly competitive circumstance, tourist loyalty is regarded as an important means to maintain the tourist destination preference [2] . Loyal tourists will not only bring the loyalty of the destination that they have visited, but also will bring the tourist loyalty to the whole area [3] . Since the late 1990s, tourist loyalty has gradually become a new hot spot in the study of tourist destination behavior [3] [4] . The key to cultivate tourist loyalty is to identify the factors which influence it.
Existing researches often explore the impact of the various elements of the destination on the tourist loyalty from the perspective of tourists’ perception, but they seldom consider the factors such as employee satisfaction and service quality. For example, Wang and Mei (2006) constructed the tourism destination satisfaction model and discussed the influence of the tourist satisfaction on the tourist loyalty from the perspective of tourist satisfaction [5] ; Li (2011) constructed the ancient village tourist loyalty model from the perspective of tourists perceived value [2] ; Wu et al. (2011) studied the influence factors of Xi’an tourist loyalty from the perspectives of tourism destination image, satisfaction and loyalty and other tourist perception indexes [6] ; Tian et al., (2015) established the integration model of tourist satisfaction and loyalty, which is based on the dual perspective of cognition and emotion [7] ; Qi (2015) and Zhang et al. (2016) studied the relationship between tourism destination image and tourist loyalty [8] [9] .
Improving employee satisfaction is the main way to enhance enterprise management and service quality. In the modern tourism enterprises, employee satisfaction directly affects the relationship between enterprises and customers, and at the same time affects the future development of tourism enterprises [10] . Employees of scenic spots are the main body of tourism services. Tourists feel satisfied or unsatisfied with the tourism services provided by the employees. Previous researches show that the service quality of scenic spot has remarkable influence on the tourist loyalty [11] [12] [13] .
In this paper, two questionnaires are used―employee self-assessment questionnaire of service quality and the tourist questionnaire. The survey results are matched by using a sample pairing method from the perspective of employee satisfaction. On this basis, the paper uses structural equation model to explore the influence pathways and to what extent the employee satisfaction and service quality impact on tourist loyalty, and provides new ideas to improve the tourist loyalty.
2. Conceptual Model Design
In the process of tourism services, scenic spot employees meet tourists directly, and provide tourists with their services. Previous research shows that employee satisfaction affects the quality of their services [14] and affects tourist loyalty through their services [11] [12] [13] .
Parasuraman et al. (1985) constructed a service quality margin model and pointed out that service delivery not only has significant impact on customers’ perception of service quality, but also measure most of the five dimensions of service quality. Employee is the main body of the service delivery, so employee satisfaction level would directly affect the customer perception of service quality [15] . The “service-profit chain” is the most typical and widely adopted model for studying employee satisfaction and service quality. Heskett et al. (1994) thinks employees who are satisfied would enhance their service quality by improving work and productivity continuously [16] . Based on 206 high-level service companies including hotel industry studying results, Yee (2008) found out that employee satisfaction has a significant correlation with service quality [17] .
Abraham (1998) puts forward that there is significant correlation between employee disorder emotion state and service quality [18] . Through the longitudinal study, Stephane & Morgan (2002) found that unhappy mood would bring down the job satisfaction, which consequently bring down the service quality [19] . Thus we can assume that employee emotion have positive significant influence on service quality.
Tourism service quality affects tourist loyalty [20] . When tourists experience high- level service, their willingness to rebuy and recommend would be much more remarkable [21] . Satisfaction is widely considered as one of the main variables which directly affect tourist loyalty in the field of consumer behavior and marketing [22] [23] [24] . The consumers who are satisfied with the products or service quality would be more likely to rebuy and recommend orally, while the latter two behaviors are the core elements of tourist loyalty.
Based on the above documents and logical argumentation, a conceptual model is proposed as shown in Figure 1 and the following assumptions in the light of the American customer satisfaction index (Customer Satisfaction Index American) [25] , the conceptual model of tourist satisfaction degree in tourist destination [5] , the concept model of tourist satisfaction [26] . Within this model, employee satisfaction consists of three dimensions, which includes employee’s working environment, living conditions and working rewards. Tourist loyalty consists of attitude loyalty and behavior loyalty. Both employee emotion and service quality contain only one dimension.
3. Research Method
3.1. Questionnaire Design
In this paper, two questionnaires were designed for scenic spot employees and tourist respectively. Referring to the satisfaction measurement scale [27] [28] and considering the actual situation of Jiuzhaigou and Huanglong scenic spots, we constructed the indicators of employee satisfaction and employee emotion for the employee questionnaire. Indicators of employee service quality was designed by referring to the service

Figure 1. Conceptual model (Hypothesis 1: Employee satisfaction has a significant positive impact on service quality; Hypothesis 2: Employee satisfaction has a significant positive impact on employee emotion; Hypothesis 3: Employee emotion has a significant positive impact on the service quality; Hypothesis 4: Service quality has a positive impact on tourist loyalty).
quality measurement scale raised by Wen (2006) [29] and the United States SERVQUAL scale [21] . In brief, the employee questionnaire consists of 4 sections: social and demographic characteristics of the employee (4 questions), employee satisfaction (11 questions), employee emotion (5 questions) and employee service quality (6 questions). In the tourist questionnaire, indicators of service quality were constructed in the same way with the employee questionnaire, and indicators of tourist loyalty were designed by referring to other related literatures [30] [31] . The tourist questionnaire consists of 3 sections: social and demographic characteristics of the tourist (7 questions), employee service quality (6 questions) and tourist loyalty (9 questions).
A five score Likert Scale was employed to measure the index of the questionnaires. The higher the score is, the higher the tourist evaluation value would be. This paper designed 2 reverse questions in the questionnaires, and the related scores were counted in reverse during the statistical analysis of data. The reliability of each questionnaire was tested by SPSS17.0 software. Except the Cronbach α coefficient of the working environment is 0.73, those of the other dimensions are all greater than 0.8. These results indicate the questionnaires are reliable.
3.2. Data Collection
The research data of this paper were collected in Huanglong and Jiuzhaigou, the two famous scenic spots in Sichuan Province southwest China. Surveys were conducted on June 21st, 2013-August 19th. 1200 questionnaires were issued in total, and after screening, the actual effective questionnaires were 916 copies. Among them, the numbers of effective questionnaires of employees and tourist were 459 and 457 respectively. The effective recovery rate of the questionnaires was 76.33%.
4. Results
4.1. Sample Pairing
In the survey questionnaires, there were 6 pairs of identical measurement items according to the service quality of employee self-rating and tourist rating (Table 1). In this paper, these characteristic variables were used as the co-variant of propensity score model, and samples were paired with propensity score matching method.
The following Logit regression model was established according to the matching items:

y stands for employee and visitor variables. When the service quality is evaluated by tourist and scenic employees, y values 1 and 0 respectively; p is propensity score and ε is residual term. The following formula can be obtained after Logit regression:


Table 1. Service behavior variables used in the employee and tourist questionnaire respectively.
In this formula, p is propensity score, while X is characteristic variable which includes service technology, emergency capability, and the knowledge of the scenic spot, the active greeting, courtesies and the tour guide team. The research steps are as followed: calculating the propensity score of each sample with this formula; running the Logit model [32] by using Stata statistical software and matching the samples under the principle of the nearest distance matching. Finally, a total of 350 samples were obtained. Among them, both the sample numbers of employee and tourist were 175. Then paired samples T test was carried out by using the characteristic variables of the two matched groups of samples. The results showed that the mean difference between the service quality self-evaluated by employees and the service quality evaluated by tourist was not significant (P > 0.05), which indicated that the paired questionnaires were consistent. Thus the sample capacity was 175 after merging two databases.
4.2. Validity and Reliability Analysis
In this paper, 4 dimensions (employee satisfaction, employee emotion, service quality and tourist loyalty) were carried through the exploratory factor analysis by using statistical software SPSS. After the samples were tested by KMO and Bartlett, the principal component analysis was adopted to maximize the variance of orthogonal rotation, and the factors whose characteristic value was greater than 1 were extracted. Screening the observed variables must follow two principles: a question cannot be automatically generated into a factor and the factor loading items must be greater than 0.5. Therefore, 7 latent variables that included working environment, living conditions, working rewards, service quality, employee emotions, behavior loyalty and attitude loyalty and 26 specific measurement items were formed (Table 2). In light of using AMOS software to calculate the standardized path coefficient and testing the convergent validity of scale with Average Variance Extracted, the computational formula is . In this formula, λ is the standardized path coefficients of each path during the process of factor analysis, while n represents the number of paths. Analysis results show that the AVE
Table 2. Variables used in the tourist loyalty model.
Note: “−” means negative questions.
values of all latent variables are more than 0.5, which means that they have a good explanatory validity.
In this paper, the SPSS software is used to analyze the reliability of each latent variable. The results show that the questionnaire reliability is good because the Cronbach
4.3 Model Construction and Hypothesis Testing
The model regards working environment, employee living conditions and working rewards as exogenous variables, while it regards employee emotion, service quality, attitude loyalty and behavior of tourist loyalty as endogenous variables. The testing relies on the use of AMOS17.0 analysis software to fit and analyze the data. The result indicates that the ratio of χ2 and df is 735.572/284 = 2.590 < 3, which achieves acceptable standards; other indexes(NFI, CFI, IFI, TLI)were all above 0.8, basically met the basic requirements (Table 4).
Path coefficient analysis results show that the impact of the relationship among the rest of the variables have been confirmed, except that the working rewards have no direct significant impact on the service quality (Figure 2).
5. Discussion and Conclusion
This paper conducts a questionnaire survey on the employees of Jiuzaigou and Huanglong scenic spots and the tourist. Samples are paired with propensity score matching method. On the basis of better validity test and reliability analysis, the structural equation model of tourist loyalty is built with 26 specific measurement indexes and 7
Table 3. Cronbach α values of the variables.
Table 4. Goodness of fit test results.
Note: NFI means Normed Fit Index, CFI means Comparative Fit Index, IFI means Incremental Fit Index, TLI means Tucker-Lewis Index, RMSEA means Root-Mean-Square-Error-of-Approximation.
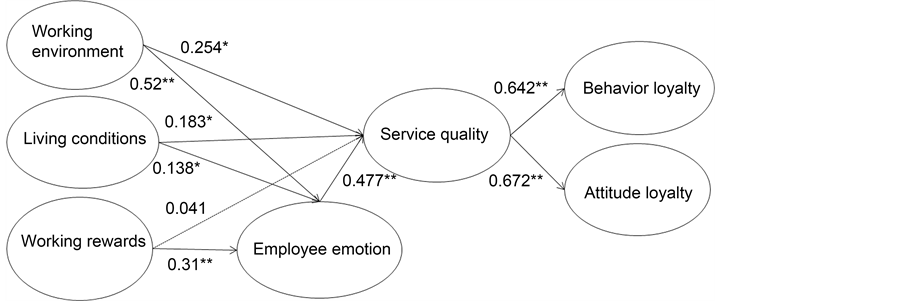
Figure 2. Testified path relationship graph (Note: * means P < 0.05, ** means P < 0.01.).
potential variables which include working environment, employee living conditions, working rewards, employee emotion, service quality, attitude loyalty and behavior loyalty. The path analysis is carried out by using AMOS software. In 3 latent variables (working environment, employee living conditions, and working rewards) that constituted employee satisfaction, only the effect of working rewards on service quality is not significant, the rest of the variables are positively affecting the service quality. It is consistent with the research conclusions of Douglas in 1992 that “with high employee satisfaction, employees would be more prone to service-oriented behavior, thus providing high quality service in the process of service delivery” [33] . And at the same time, high employee satisfaction also positively affects the service quality through employee emotion. Lee explored the relations between service quality and destination loyalty by studying the loyalty of forest tourist [34] . The result showed that the forest tourist who had high perception of service quality tended to have higher satisfaction and participation, which could bring higher destination loyalty finally. It is consistent with the study result of this paper that “service quality affects tourist loyalty positively and significantly”.
Under such increasingly competitive circumstance, more and more tourism enterprises adopt the strategy of customer orientation and require service personnel to provide quality services to customers. Existing researches indicate that the factors like employee service quality, service standardization and not high enough standardization have affected the quality of tourism service in Jiuzhaigou scenic spot [35] . This paper reveals the intrinsic link of employee satisfaction, service quality and tourist loyalty. The more advantageous working conditions always cultivate the employees with higher satisfaction. They not only have higher loyalty for the service industry, but would also offer better service to the customers; therefore, the customers would highly appraise the service quality that they received [16] [36] [37] . Enhancing the staff working environment and living conditions, improving reasonable working rewards and strengthening the management of employee emotion are the important cutting-points of upgrading Jiuzhaigou and Huanglong scenic spots’ service quality and tourist loyalty. As to all the items of the survey in this paper, 73.1% of employees are opposed to the statement that they have plenty of holiday time (choosing “somewhat disagree” and “strongly disagree”). Managers should ease the negative emotions of employees by specifically adopting some measures such as staggering holidays. Performance evaluation of employees is one of the most important human resource management measures in enterprise management. The key to enhance service quality and tourist loyalty is the scientific formulation of employee service quality standards and effective supervision.
Compared with previous studies, this paper explores the influence pathways and to what extent the employee satisfaction and service quality impact on tourist loyalty, and provides a new perspective for the study of tourist destination loyalty. But we only choose two geographically adjacent national level scenic spots with similar resource characteristics and development level in the empirical study of this paper. Meanwhile, its small sample size may have a certain impact on the conclusions of this study.
Acknowledgements
The paper was supported by Sichuan International Cooperation Program (2016HH0080).
Cite this paper
Xu, R.L. and Wang, J.Q. (2016) A Study of Tourist Loyalty Driving Factors from Employee Satisfaction Perspective. American Journal of Industrial and Business Management, 6, 1122-1132. http://dx.doi.org/10.4236/ajibm.2016.612105
References
- 1. Reichheld, F.F. and Sasser, E. (1990) Zero Defections: Quality Comes to Services. Harvard Business Review, 68, 105-111.
- 2. Li, W.B. (2011) Study on Tourist Loyalty Model of Ancient Village: Based on the Tourist Perceived Value and its Dimensions. Geographical Research, 30, 37-48. (In Chinese)
- 3. Hu, L.H. and Yang, X.X. (2007) A Review of Oversea Tourism Destination Loyalty Research. Journal of Guilin Institute of Tourism, 18, 899-903. (In Chinese)
- 4. Yoon, Y. and Uysal, M. (2005) An Examination of the Effects of Motivation and Satisfaction on Destination Loyalty: A Structural Model.Tourism Management, 26, 45-56.
https://doi.org/10.1016/j.tourman.2003.08.016 - 5. Wang, X. and Mei, H. (2006) Tourist Loyalty of Tourist Destination: Model and Empirical Study. Journal of Beijing Second Foreign Language Institute, 137, 1-6. (In Chinese)
- 6. Wu, J., Ma, Y.F., Zheng, P. and Zhang, C.H. (2011) Research on the Relationship of Tourist Perception, Destination Image, Tourist Satisfaction and Loyalty—A Case Study on Xi’an City. Tourism Forum, 4, 43-47. (In Chinese)
- 7. Tian, Y., Lu, D. and Wu, T. (2015) Impacts of Awe Emotion and Perceived Value on Tourist Satisfaction and Loyalty—The Case of Tibet. East China Economic Management, 29, 79-85. (In Chinese)
- 8. Qi, X.W. (2014) The Effects of Tourist Attractions Image on Visitor Satisfaction and Visitor Loyalty. East China Economic Management, 28, 33-36. (In Chinese)
- 9. Zhang, H.M., Fu, X.X., Cai, L.P. and Lu, L. (2016) Destination Image and Tourist Loyalty: A Meta-Analysis. Tourism Management, 40, 213-223. (In Chinese)
https://doi.org/10.1016/j.tourman.2013.06.006 - 10. Tian, Q.S. and Zhu, Z. (2011) How Should Tourism Enterprises Improve Employee Satisfaction. China Business & Trade, 12, 161-162. (In Chinese)
- 11. Huang, F.C. and Huang, Y.H. (2007) Research on the Driving Forces of Tourist Destination Loyalty: A Case Study of Mainland Visitors’ Hong Kong Tours. Tourism Science, 21, 72-78. (In Chinese)
- 12. Kim, T., Kim, W.G. and Kim, H.B. (2009) The Effects of Perceived Justice on Recovery Satisfaction, Trust, Word-of-Mouth, and Revisit Intention in Upscale Hotels. Tourism Management, 30, 51-62.
https://doi.org/10.1016/j.tourman.2008.04.003 - 13. Niu, Y.L., Ma, Y.F., Wang, Q. and Liu, Z.X. (2014) Influencing Factors and Comparison of Inbound Tourist Loyalty from the Perspective of Tourism Supply: A Case of Shanghai City. Journal of Shaanxi Normal University, 42, 96-103. (In Chinese)
- 14. Zhao, X. (2015) Study on the Relationship between Hotel Employee Satisfaction and Service Quality. Journal of Henan Institute of Science and Technology, 19-22. (In Chinese)
- 15. Parasuraman, A., Zeithaml, V.A. and Berry, L.L. (1985) A Conceptual Model of Service Quality and Its Implications for Future Research. Journal of Marketing, 49, 41-50.
https://doi.org/10.2307/1251430 - 16. Heskett, J.L., Jones, T.O. and Loveman, G.W. (1994) Putting the Service-Profit Chain to Work. Harvard Business Review, 72, 164-174.
- 17. Yee, R.W.Y., Yeung, A.C.L. and Cheng, T.C.E. (2008) The Impact of Employee Satisfaction on Quality and Profitability in High-Contact Service Industries. Journal of Operations Management, 26, 651-668.
https://doi.org/10.1016/j.jom.2008.01.001 - 18. Abraham, R. (1998) Emotional Dissonance in Organizations: Antecedents, Consequences, and Moderators. Genetic, Social, and General Psychology Monographs, 124, 229-246.
- 19. Cote, S. and Morgan, L.M. (2002) A Longitudinal Analysis of the Association between Emotion Regulation, Job Satisfaction, and Intentions to Quit. Journal of Organizational Behavior, 23, 947-962.
https://doi.org/10.1002/job.174 - 20. Bigne, J.E., Sanchez, M.I. and Sanchez, J. (2001) Tourism Image, Evaluation Variables and after purchase Behaviour: Inter-Relationship. Tourism Management, 22, 607-616.
https://doi.org/10.1016/S0261-5177(01)00035-8 - 21. Parasuraman, A., Zeithaml, V.A. and Berry, L.L. (1988) SERVQUAL: A Multiple-Item Scale for Measuring Consumer Perceptions of Service Quality. Journal of Retailing, 64, 12-40.
- 22. Anderson, E.W. and Sullivan, M.W. (1993) The Antecedents and Consequences of Customer Satisfaction for Firms. Marketing Science, 12, 125-143.
https://doi.org/10.1287/mksc.12.2.125 - 23. Taylor, S.A. and Baker, T.L. (1994) An Assessment of the Relationship between Service Quality and Customer Satisfaction in Formation of Consumers’ Purchase Intentions. Journal of Retailing, 70, 163-178.
https://doi.org/10.1016/0022-4359(94)90013-2 - 24. Cronin, J.J., Brady, M.K. and Hult, G.T. (2000) Assessing the Effects of Quality, Value and Customer Satisfaction on Consumer Behavioral Intentions in Service Environments. Journal of Retailing, 76, 193-218.
https://doi.org/10.1016/S0022-4359(00)00028-2 - 25. Fornell, C. and Johnson, M.D. (1994) The American Customer Satisfaction Index: Nature, Purpose, and Findings. Journal of Marketing, 60, 7-8.
https://doi.org/10.2307/1251898 - 26. Wang, Q., Ding, Z.R., Zhang, J.H. and Yang, X.Z. (2006) Study on the Model of Tourist Satisfaction Index about Tourism Environment: A Case Study of Huangshan Mountain. Geographical Research, 25, 171-181. (In Chinese)
- 27. Lu, J. and Shi, K. (2000) How to Investigate Employee Satisfaction. Human Resource Development of China, 32-33. (In Chinese)
- 28. Li, C.Y. (2009) Study on Restaurant Staff Service Quality Control and Guarantee. Dalian Maritime University, Dalian. (In Chinese)
- 29. Wen, B.Y. (2006) An Empirical Study on Customer Satisfaction of Tourism Services. Tourism Science, 20, 29-35. (In Chinese)
- 30. Han, X.Y. and Wang, C.X. (2003) The Relationship between Customer Satisfaction and Loyalty in Service Industry. Tsinghua University Press, Beijing. (In Chinese)
- 31. Luo, H.C. (2006) An Empirical Research on the Psychological Contract Mechanism of Customer Loyalty. Management Review, 18, 57-62. (In Chinese)
- 32. Leuven, E. and Sianesi, B. (2010) PSMATCH2: Stata Module to Perform Full Mahalanobis and Propensity Score Matching, Common Support Graphing, and Covariate Imbalance Testing. http://EconPapers.repec.org/RePEc:boc:bocode:s432001
- 33. Hoffman, K.D. and Ingram, T.N. (1992) Service Provider Job Satisfaction and Customer-Oriented Performance. The Journal of Services Marketing, 6, 68-78.
https://doi.org/10.1108/08876049210035872 - 34. Lee, J., Graefe, A. and Burns, R. (2007) Examining the Antecedents of Destination Loyalty in a Forest Setting. Leisure Sciences, 29, 463-481.
https://doi.org/10.1080/01490400701544634 - 35. Jiang, L. (2005) Evaluation of Service Quality and Quality System Element Analysis on Jiuzhaigou Core Scenic Spot. Southwest Jiaotong University, Chengdu. (In Chinese)
- 36. Snipes, R.L., Oswald, S.L., Latour, M. and Armenakis, A.A. (2005) The Effects of Specific Job Satisfaction Facets on Customer Perceptions of Service Quality: An Employee-Level Analysis. Journal of Business Research, 58, 1330-1339.
https://doi.org/10.1016/j.jbusres.2004.03.007 - 37. Chi, C.G. and Gursoy, D. (2009) Employee Satisfaction, Customer Satisfaction, and Financial Performance: An Empirical Examination. International Journal of Hospitality Management, 28, 245-253.
https://doi.org/10.1016/j.ijhm.2008.08.003