Advances in Microbiology
Vol. 3 No. 3 (2013) , Article ID: 33576 , 16 pages DOI:10.4236/aim.2013.33035
Are Small Grazers and/or Viruses a Structuring Factor of the Free-Living Bacterial Community in Lake Geneva?
INRA, UMR CARRTEL, Station d’Hydrobiologie Lacustre, Equipe Biodiversité, Fonctionnement et Evolution des Ecosystèmes Lacustres, Thonon-Les-Bains Cedex, France
Email: *stephan.jacquet@thonon.inra.fr
Copyright © 2013 Stéphan Jacquet et al. This is an open access article distributed under the Creative Commons Attribution License, which permits unrestricted use, distribution, and reproduction in any medium, provided the original work is properly cited.
Received May 3, 2013; revised June 5, 2013; accepted June 20, 2013
Keywords: Viruses; Bacteria; Flagellates; PCR-DGGE; Richness; Regulation; Lake
ABSTRACT
Two experiments were conducted to test whether viruses, small autoand heterotrophic nanoflagellates were key factors regulating at relatively short-term (4 days) and nearby periods (April vs. May) the bacterial community in surface waters of Lake Geneva. 2.5 L containing polycarbonate bottles were incubated in situ with either <2 µm or <10 µm filtered water with additions of either virus-free water or a viral concentrate. Abundances of viruses, prokaryotes and small autotrophs were obtained each day using flow cytometry, while bacterial richness was assessed using 16S rDNA PCR-DGGE and autoand heterotrophic flagellates counted with epifluorescence microscopy at t0 and t96. Transmission electron microscopy was also used to assess virus-induced bacterial mortality at the start and the end of the experiments. Cloning-sequencing was applied on PCR products obtained after excision of selected DGGE bands to highlight more specifically the identity of bacteria of interest in the context of the experiment. The autotrophs and grazer presence and/or the virus enrichment resulted in different effects on the structure of the bacterial community and the impact was also different with the period. In May, bacterial structure changes seemed to be related to the impact or influence of the eukaryotes (including nanoflagellate grazers), while viruses might have a higher impact on the bacterial community structure the month before. This study provides new persuasive evidence that the presence of viruses and small eukaryotes are likely to drive bacterial community composition and shifts on the short-term in lacustrine ecosystems. More interestingly, such effects seem to be different between viruses and grazers, the ones sustaining, the others reducing bacterial community composition.
1. Introduction
Heterotrophic bacteria represent the most abundant cellular group of planktonic organisms in peri-alpine lakes [1,2]. This community is known to be centrally involved in biogeochemical cycling, playing a primordial role in nutrient cycling, organic matter formation and decomposition, and representing a relevant link inside the pelagic food webs, typically as a prey for higher trophic levels [3-6]. In lakes, multiple interacting factors and processes drive natural microbial communities and it has been shown that biotic interactions (i.e. predator-prey or parasite-prey dynamics) as well as abiotic factors (resources and physical parameters) play a significant role in shaping bacterial communities [7-11]. Our conceptual understanding of the role of heterotrophic bacteria in pelagic ecosystems and in global biogeochemical cycles is closely linked to our understanding of how their growth rate, abundance, distribution and diversity are controlled.
Despite the considerable attention that has been paid to bacterioplankton over past decades, the dynamic of aquatic bacterial community structure is still poorly understood. Typically, how the environment governs bacterial activity and diversity patterns remains a key issue in aquatic microbial ecology. Several investigations dealing with the temporal evolution of the bacterial community structure and composition in lakes have been performed and different trends have been highlighted according to the studied lakes. While some studies described a pronounced seasonal evolution of the bacterial community composition in lakes [12-16], others demonstrated a more gradual change and did not find any apparent connection with seasonality [17-19]. Using Denaturing Gradient Gel Electrophoresis (DGGE) of PCR-amplified partial 16S rRNA gene fragments and multivariable statistical approaches, Berdjeb et al. (2011, [11]) explored recently the patterns of change in the bacterial community structure (BCS) over a complete year in the mesotrophic Lake Bourget and the oligotrophic Lake Annecy (France), two ecosystems situated in the same ecoregion as Lake Geneva. These authors revealed significant differences in the BCS between the two lakes, characterized by a higher richness in the oligotrophic ecosystem. Even if BCS presented similar vertical patterns in the two lakes, its temporal dynamics differed greatly between depths and lakes, with temporal scale patterns being much longer in the mesotrophic ecosystem. Direct gradient multivariate ordination analyses showed that a complex array of biogeochemical parameters was the driving force behind BCS shifts in both lakes, and it was revealed that 60% to 80% of the variance was explained only by bottom-up factors in both lakes, indicating the importance of nutrients and organic matter from autotrophic origin in controlling the BCS. Top-down regulation by flagellates together with ciliates or viruses were found only in the hypolimnion but not in the epilimnion for both lakes and explained less than 18% of the bacterial community changes during a complete year.
Some studies have investigated the individual effects of flagellates and/or viruses on bacterial communities in terms of abundance, activity and diversity [20-25]. The study of Berdjeb et al. (2011, [11]) cited above on French peri-alpine lakes probably missed the impact of both the viruses and the heterotrophic grazers on the bacterial community structure since it was realised using inappropriate time scale (i.e. every month), while daily to weekly scale are more adapted to investigate microbial interactions. We know indeed that both viruses and small (nanoflagellated) grazers can be variable causes of bacterial mortality and be responsible for 10% - 60% of daily bacterial loss in lacustrine ecosystems ([21] and references therein; [26,27]). Both processes can impact the size distribution of bacterial communities through “sizeselective mortality” for flagellates [28,29], and “hostspecificity” for viruses [22]. Moreover, viruses can act indirectly on bacterial structure throughout the release of virus-induced cell debris (alimenting the pool of dissolved and particulate organic matter (DOM and POM) and inorganic nutrients) which can be utilized by noninfected bacteria, enhancing in fine growth and production of some bacterial groups [30,31]. Also, viral lysis and protozoan bacterivory may act additively to reduce bacterial production and sustain diversity [24,25] but other experimental studies reported contrasting results [23,32] highlighting the variety of complex relationships between bacteria, viruses and protists [33]. Whether cells are grazed or lysed may have different ecological and biogeochemical consequences, the organic matter and nutrients reaching or not higher trophic levels, influenceing in fine bacterial diversity and the relationship between diversity and ecosystem functioning [25,30].
In the present study, we examined the impact of viruses and protistan grazing on bacterioplankton abundance and richness in Lake Geneva at a key period of the year (e.g. spring). To reach this goal, we conducted two field studies at nearby periods (April and May) and used size fractionation and virus enrichment approaches. Our main goal was to examine the separated and combined effects of viruses, grazers and small autotrophs on the bacterial abundance, growth rate and structure and to compare it in different environmental conditions. Our aim was to monitor the short-term dynamical response of the microbial and viral loops, in response to virus enrichment and/or protistan grazer manipulation, by focusing on the variation of the bacterial community assemblage that may be central in these biotic interactions.
We found that viral lysis and flagellated bacterivory impacted the bacterial community structure of Lake Geneva. More importantly, our data suggest that, at this period of the year, the impact could change rapidly (from viral lysis to protistan grazing) and resulted in different trajectories, sustaining or decreasing bacterial diversity.
2. Materials and Methods
2.1. Study Site
Lake Geneva, located at the border between France and Switzerland, is the largest natural western European lake located at an altitude of 372 m, with an area of 582 km2, a maximum width and length of 13 and 72 km respectively, and a volume of approximately 89 × 109 m3. Following restoration programs, Lake Geneva has been reported to be mesotrophic in recent years, with total phosphorus concentrations varying for the period 2004 to 2011 between 22 and 30 µgP·L−1 [34,35]. Water samples were obtained from the monitoring reference station (SHL2), located in the middle and deepest part (309 m) of the lake. Water temperature was obtained with a conductivity-temperature-depth measuring device (CTD SBE 19 Seacat profiler, SEABIRD) while chlorophyll a was obtained from the BBE Fluoroprobe [36]. Nutrient concentrations (P-PO4, N-NO3 and N-NH4) were analyzed according to the French standardized protocols (AFNOR).
2.2. Experimental Set-Up for Estimating Viral vs. Protozoan Impact on Heterotrophic Bacteria
Immediately after sampling, water samples were used in microcosm fractionation/enrichment experiments conducted following Noble et al. (1999, [37]). The first experiment was performed in April (from 05 to 10) and the second one in May (from 10 to 15) 2004, in order to cover the end of the mixing period and the early stratifycation water column period, respectively. Consequently, both experiments, also noted here after M1 and M2, were conducted at distinct but nearby periods of the year in terms of microbial plankton dynamics and diversity [e.g. 1,21,29,38].
For each experiment, an integrated >100-L sample was taken in the 0 - 10 m surface layer, using a pump and a long flexible pipe controlled from the boat via an electric cable and a 12-V battery. We took into account the dead volume of the tube that was about 15 L. Back to the laboratory, water sample was filtered through a series of 100- and 10-µm mesh filters (NYCOM, Buisine, France), and then through a 2 µm filter (Nucleopore, Whatman) under low differential pressure (<50 mm Hg). A 20-L volume dedicated to obtain a viral concentrate was filtered through 0.2 µm polycarbonate filters (MilliPore) and were subjected to tangential ultra-filtration using a 30,000-molecular-weight-cutoff spiral-wound Millipore ultrafiltration cartridge (regenerated cellulose, PLTK Prep/scale TFF, 1 ft2, Millipore) in order to obtained ultra-filtered water and a viral concentrate (also noted here after with the letter “e” for enriched). The efficiency of each filtration step, i.e. the check for the absence of metazooplankton, rotifers, ciliates, flagellates and picoplankton was performed, at the beginning and the end of the experiments, using both microscopy and flow cytometry (see below).
The general experimental design consisted in the incubation of the <2 or <10 µm filtered water with additions of the same volume (<10% of the total volume) of either ultra-filtered water or the virus concentrate in 2.5-L polycarbonate bottles (previously acid washed and rinsed 3 times with milliQ water). The different water treatments, i.e. the water without small predators (i.e. heterotrophic nanoflagellates, HNF) and autotrophic cells (<2 µm) and the water without metazooplankton and ciliates (<10 µm) but with nanoflagellates (both heterotrophic and pigmented), enriched or not with the viruses, were incubated in 2.5 L polycarbonate Nalgene (Bioblock) sample containers previously acid-washed and rinsed 3 times with milliQ water and autoclaved. Samples so prepared were divided in duplicates. Once filled, the bottles were incubated back in situ at a depth of 2.5 meter in Lake Geneva, for 4 days. For flow cytometry analysis, sub-samples were taken from each duplicate, early, each morning (i.e. t0, t24, t48, t72 and t96). Samples for epifluorescence and transmission microscopy and DGGE analyses were taken at the beginning (t0, day 0) and at 96 hours (t96) of the experiment. The absence/ presence at t0 of HNF in the <2-µm fraction and of small ciliates (e.g. prostomes and bacterivorous scuticociliates) in the <10-µm fraction was checked revealing only a small HNF contamination in the <2 µm treatment.
2.3. Flow Cytometry Analysis (FCM)
Viruses (that could be discriminated into 4 distinct groups, see 38) and (free-living in the <2 µm and total in the <10 µm treatment) heterotrophic bacteria were counted using a FACSCalibur flow cytometer (Becton Dickinson) equipped with an air-cooled laser providing 15 mW at 488 nm and its original filter set-up. Counts were obtained on fixed samples using glutaraldehyde (0.5% final concentration) for 30 minutes, then diluted in either 0.02 µm filtered fresh water (for the bacteria) or 0.02 µm filtered TE buffer (0.1 mM Tris-HCL and 1 mM EDTA, pH 8) for the viruses. Heterotrophic bacteria were then incubated with SYBR Green I (at a final 10−4 dilution of the commercial stock solution, Molecular probes) for 15 min. Viruses were incubated with SYBR Green I (5 × 10⁻⁵ final dilution), for 5 min at ambient temperature, followed by 10 min at 75˚C and again 5 min at room temperature, prior to FCM analysis [1]. For the analysis of the phytoplankton (i.e. the picocyanobacteria and the other autotrophs), samples were analysed without fixation or dye, directly on rough samples. FCM listmode files were then analyzed using CYTOWIN [39].
2.4. Epifluorescence (EFM) and Transmission Electron Microscopy (TEM) Analyses
Glutaraldehyde (1% final concentration) was used to fix the small protozoan (i.e. the flagellates). Samples were filtered (pressure < 100 mm Hg) on polycarbonate membranes (diameter: 25 mm, pore size: 0.8 µm), stained with primulin (modified from [40] and stored for only a few days at −20˚C until analysis. Slides were examined by epifluorescence microscopy (EFM) under UV light to count the heterotrophic flagellates and under blue light to count the pigmented autotrophic flagellates (magnification: 1.250×). Green light (545 nm) was used to display phycoerythrin-containing flagellates (i.e. cryptophytes).
Samples were also taken at t0 and t96 in all treatments and fixed with formalin (5% final concentration) for the analysis of infected cells by transmission electron microscopy (TEM). For such an analysis, the samples were kept at 4˚C for about two weeks. The formalinfixed bacteria contained in 8-mL subsamples were harvested by ultracentrifugation onto 400 mesh NI electron microscope grids with carbon-coated Formvar film, by using a Centrikon TST 41.14 Swing-Out-Rotor run at 70,000 × g for 20 min at 4˚C [41]. Each grid was then stained for 30 s with uranyl acetate (2% wt/wt) and examined using a JEOL 1200EX TEM operated at 80 kV at a magnification of ×40,000. A cell was considered to be infected when the phages inside could clearly be recognised on the basis of shape and size. At least 600 bacterial cells were inspected per sample for a target number range of infected cells of 20 - 25 per sample. The minimum number of phages found in an infected cell was five. To estimate the virus-induced bacterial mortality (VIBM), the frequency of visibly infected cells (FVIC, as a percentage) was first related to the frequency of infected cells (FIC) as follows: FIC = 9.524 FVIC − 3.256 [42]. The FIC was then converted to the virus-induced bacterial mortality (VIBM) according to Binder (1999, [43]): VIBM = (FIC + 0.6 FIC2)/(1 − 1.2 FIC). In a steady-state system, the bacterial mortality due to viral lysis matches the bacterial production which is removed by lysis [44]. Thus, multiplying the lysed bacterial production by the burst size (i.e. the number of viruses produced per cell) yields the viral production [45].
2.5. Growth and Grazing Rates Measurements
Bacterial net growth rates (d−1) with bacterial predators (i.e. in the <10 µm fraction) and without predators (i.e. in the <2 µm fraction) were calculated from the difference in abundances from day 0 to day 1, day 1 to day 2, etc (t = 24 h), assuming exponential growth. The bacterial loss rate due to the grazing activity was calculated as the difference between the net growth rates in treatments with and without the predators. At t0, before manipulation, the grazing rate of flagellates on heterotrophic bacteria was also measured from bead ingestion as described in Domaizon et al. (2003, [46]). Briefly, experiments were conducted in duplicate in 250-ml glass containers where tracer particles were added. A stock solution of tracer particles (0.5 µm) was prepared from a concentrated solution of Fluoresbrite Plain Microspheres (Polysciences) and was treated with bovine serum albumin (0.5 mg mL−1) to avoid clumping of particles. The final concentration of microbeads in the experimental bottles was from 5 to 10% of the bacterial concentration in the lake. The plankton was acclimatized for at least 5 min in the incubation bottles before beads were injected. Based on preliminary measurements of predation kinetics, we chose an incubation time of 15 min. Bead concentration at t0 and t15 was estimated by EFM after filtration onto polycarbonate filters (0.2 µm pore size). The incubation was stopped by adding ice-cold glutaraldehyde (2% final concentration). The microbeads ingested were enumerated after filtering 30 ml sub-samples onto a 0.8-µm polycarbonate membrane and staining with primulin.
2.6. Bacterial Community Structure and Banding Pattern Analysis
Analysis of the bacterial community structure was assessed using Denaturing Gradient Gel Electrophoresis (DGGE). We are aware that DGGE only provides limited information about the richness of natural communities but it was in the context of this study easy to use and susceptible to reveal major shifts for dominant groups. After DNA extraction (as described in [47]) and quantification according to the absorbance at 260 nm using NanoDrop ND-1000 Spectrophotometer (Thermo Scientific), DNA extracts of the sampled community were then stored at −20˚C until PCR amplification. PCR reactions were carried out according to the PCR cycle described in Dorigo et al. (2006, [47]) and using the Eubacteria-specific primer 358-GC [48] and the universal primer 907 rM [49]. PCR products were verified by agarose gel electrophoresis. DGGE analysis was performed on PCR fragments, essentially as described in Dorigo et al. (2006, [47]) but by using Ingeny PhorU-2 (Ingeny international) and a linear gradient of the denaturants urea and formamide, which increased from 40% at the top of the gel to 80% at the bottom. Digital images of the gels were obtained using Geldoc (BioRad).
The DGGE banding patterns were analyzed using the GelCompar II software package (Applied Maths, Kortrijk, Belgium). Briefly, banding patterns were first standardized with a reference pattern included in all gels. Each band was described by its position and its relative intensity in the profiles which could be described as the ratio between the surface of the peak and the sum of the surfaces for all the peaks within the profile [50]. A similarity matrix between densitometric curves of the band patterns was calculated based on the Bray-Curtis index.
To investigate the relationships between the bacterial community structure and measured biological variables, a Canonical Correlation Analysis (CCA) was performed using the software package XLSTAT-ADA. CCA generates an ordination plot that shows the main pattern of variation in community structure as accounted for by measured variables. The variables were submitted to the forward selection procedure, in which the statistical significance of the term was tested by the unrestricted Monte Carlo permutation test (999 permutations). Explanatory variables with p-values greater than 0.05 were excluded from further analyses.
2.7. Cloning-Sequencing
For an overview of the bacterial community composition (at the OTU level), some DGGE bands were excised, placed in sterile water and stored at −20˚C. Due to the great number of bands, we chose and sequenced only a selection that was interesting in the context of this study. Prior to cloning, each excised DGGE band was subjected to a freeze-thaw cycle and then centrifuged. DNA fragments contained in the supernatant were used as template for PCR amplification as described above. The new resulting PCR products were cloned using an Invitrogen cloning kit (TOPO TA cloning) according to the manufacturer’s instructions. Between 10 and 20 positive clones for each band were randomly selected, checked by PCR using the 358 F (without the GC queue) and 907 rM primers, and finally sequenced using the 358F primer (GATC Biotech). The sequences were then edited, aligned with Genedoc (http://www.nrbsc.org/gfx/genedoc/) and checked for chimeras using Bellerophon [51] and the Ribosomal Database Project (RDP) [52]. Sequences were subjected to BLAST and the RDP database to determine the level of identity with other bacterial 16S rRNA gene sequences available in GenBank.
3. Results
3.1. Initial Conditions and Filtration Effects
The experiment was repeated twice, in April (M1) and May (M2) 2004, when both physical and chemical conditions were significantly different (e.g. Table 1). Water temperature, the ratio of dissolved N/P, N-NH4, and chlorophyll a concentrations were indeed significantly higher in May while concentrations of P-PO4 and N-NO3 were higher in April. The heterotrophic bacterial mean concentrations, at the beginning of April and May, were 4.2 × 10⁶ and 2.5 × 10⁶ cells·mL−1, respectively. Virus mean concentrations at the start of M1 and M2 experiments were 3.4 × 10⁷ part·mL−1 in April and 4.9 × 10⁷ part·mL−1 in May. The addition of the viruses in the “en- richment treatment” elevated their abundance by approximately 26.5% in the <10 µm enclosure and 58.3% in the <2 µm enclosure in April, but only by 18.4% in the <2 µm enclosure in May. In April, HNF mean abundances were 3.9 × 10² and 0.95 × 10² cells·mL−1 in the treatment <10 and <2 µm, respectively. In May, concen- trations were 2.7 × 10² and 0.4 × 10² cells·mL−1 in the <10 and <2 µm treatments, respectively. Concentrations of the pigmented flagellates (PF) also varied between treatments and periods with 10 × 102 and 0.96 × 10² cells mL−1 in the <10 treatment in M1 and M2, respectively. All together, these data highlight that the initial conditions of the two periods investigated were very different. This was also clear when considering the structure of the flagellates (Figure 1) and their grazing rates. During M1
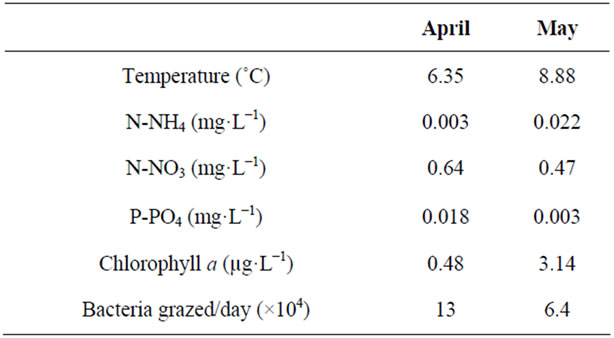
Table 1. Physical (water temperature), chemical (N-NH4, N-NO3, P-PO4) and biological (chlorophyll a and grazing rates) characteristics of Lake Geneva at the beginning of each experiment.

Figure 1. Abundances at t0 and t96, in the fractions <2 and <10 µm, of the different flagellated populations. Crytophyteae and Chrysophyteae correspond to the pigmented organisms. Note the different scales between M1 and M2.
(April), HNF were mainly represented by Chrysomonads (Spumella) and uniflagellated forms in the <2 µm fraction, and in the <10 µm treatment there were also Cryptomonads (Katablepharis) and Cafeteria-like cells. Pigmented forms were represented in the <10 µm treatment by Chrysophytes and Cryptophytes found in approximately the same proportions (i.e. 4.5 × 10² and 5.5 × 10² cells mL−1). In May (M2), in the <2 µm treatment there were Cryptomonads (Katablepharis), Chrysomonads (Spumella) and some uniflagellates with proportions of the two latter that were lower than during M1. Pigmented forms (also represented by Chrysophytes and Cryptophytes) were only present in the <10 µm fraction and their concentration was also clearly lower (e.g. 0.2 × 10² and 7.7 × 10² cells mL−1) compared to M1 (Figure 1). Before each experiment, HNF were responsible for 1.3 × 10⁵ and 6.4 × 10⁴ bacteria grazed per day in April and May, respectively. At last, we also observed at the beginning of the experiments that the bacterial richness was higher in May (M2) than in April (M1) with 33 - 36 vs. 26 - 29 bands, respectively (Figures 2 and 3).
The <2 µm filtration removed all the pigmented flagellates that were not detected at t0 nor at t96, whatever the experiment considered. In April, 75.5% of HNF were removed by the <2 µm filtration operation (Figure 1). In May, 84.6% of these HNF were removed. Contrary to both HNF and PF, the different filtration steps did not modify significantly bacterial and viral abundances. For

Figure 2. Bacterial community structure observed for the different treatments (<2, e < 2, <10) at the beginning (t0) and at the end (t96) of the two experiments (m1 and m2) conducted in April and May 2004, visualized by DGGE of PCR-amplified 16S rRNA genes. Numbers correspond to the position of the different bands excised, cloned and sequenced.
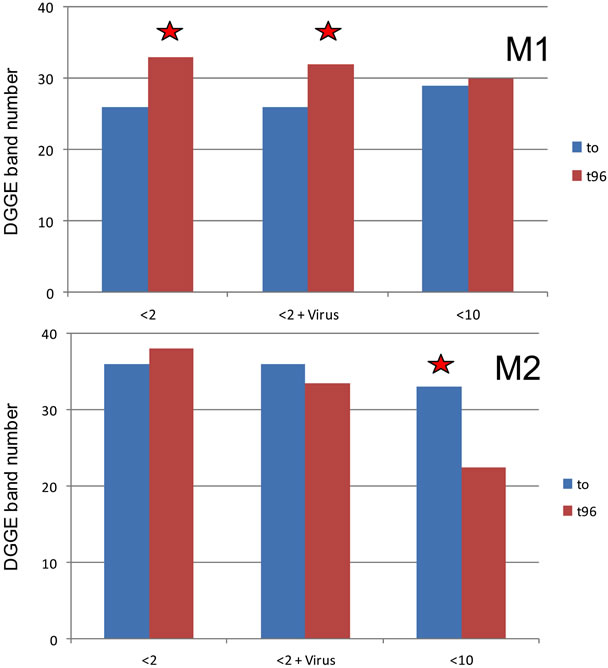
Figure 3. Number of DGGE bands in the two experiments at t0 and t96 in the different treatments. The stars symbolize significant differences (p < 0.01).
the DGGE banding patterns, no significant differences were observed in April or May when comparing the <2 µm and the <2 µm enriched treatment, in terms of band numbers and position (Figure 2). We observed however 3 bands more in April and 3 bands less in May when considering the <10 µm treatment compared to the <2 µm treatment. These differences were however not significant, at p < 0.01.
3.2. Effect of Treatments on Abundances and Bacterial Growth Rate
In the <2 µm fraction, bacterial abundances increased by a factor 2 to 3 between t0 and t96 whatever the experiment considered, and growth rate was indeed found to vary between 0 and 0.42 d−1 and 0 and 0.47 d−1 in M1 and M2, respectively, during the course of the experi- ment (Tables 2 and 3). HNF concentrations were also characterised by an important increase between t0 and t96 during M1 while viruses remained relatively constant, concomitantly to an important decrease of the VIBM. In M2, both the HNF and viruses increased only slightly and VIBM also decreased as for M1. From TEM analysis, the viral-induced bacterial mortality seemed to be relatively low throughout the experiment varying indeed between 5.6% ± 2.2% in April and 5.4% ± 2.4% in May at the beginning of the experiments and between 1.1% ± 0.9% in April and 2.1% ± 2.0% in May at the end. VIBM was always significantly lower at the end of the experiments and characterised by small values (i.e. between 0% and 4.2%).
In the <10 µm treatment, bacterial abundance also increased but in a lower extent than in the <2 µm fraction. While the bacterial concentration increased with high growth rate during the first two days (reaching at day 2 0.59 and 0.65 d−1 during M1 and M2, respectively), it was then considerably reduced, likely in response to
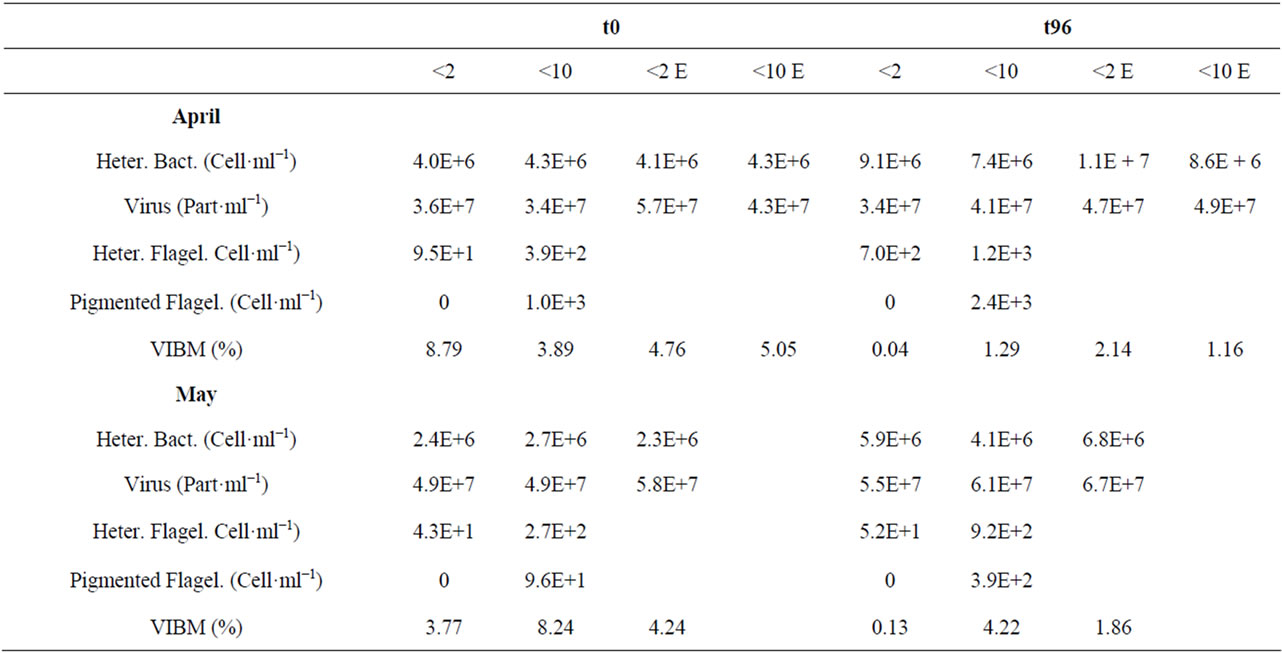
Table 2. Microbial community abundances (heterotrophic bacteria, viruses, heterotrophic and pigmented flagellates) and percentage of bacterial mortality due to viral lysis (VIBM) between t0 and t96 hours in the different experiments. Each data corresponds to the mean value of the duplicates.

Table 3. Net growth rates (d−1) calculated as µ = Ln(Cf-Ci)/(Tf-Ti) and grazing rates (d−1) calculated as m = µ < 2 − µ < 10 (provided low or absence of viral lysis).
grazing, with loss rate about 0.26 d−1.
In the viral-enriched samples, the heterotrophic bacterial concentration also increased by a factor 2 to 3 between the start and end of the experiment, whatever the treatment (<2 or <10) or the period (April or May). However, patterns considered day by day were very different in M1 and M2 with growth rates two to three fold higher in May compared to April in the <2 µm fraction during the first two days of the experiment, followed by an important mortality loss thereafter merely observed in May (Table 3). Viral concentrations were globally the same at t0 in M1 and M2 in the enriched fraction but at the end of the experiment, at t96, viruses were signifycantly reduced in M1 while they were significantly increased in M2. We only made the experiment of enriching with viruses the <10 µm fraction in April and, in this case, viruses were also increased significantly between t0 and t96 (Table 2).
3.3. Effect on Treatments on the Bacterial Community Richness and Structure
Figure 3 shows the number of the PCR-DGGE bands related to the bacterial community in the different experiments at t0 and t96 and in the different treatments. The number of bands varied throughout the experiments between 26 and 33 and between 22 and 37 in M1 and M2, respectively. The number of common bands between M1 and M2 was 41% on average. During M2, there was no significant difference in terms of band numbers between t0 and t96 for the <2 and <2 enriched treatment, however a modification of structure is observed (at t96 in the <2 µm treatment 2 additional bands and in the <2 µm enriched treatment 3 bands lost). By contrast, there was a significant difference recorded between t0 and t96 in these two treatments during M1 with a higher richness (increase by 6 or 7 bands) recorded at the end of the experiment. In another hand, there was no evolution during M1 for the <10 µm treatment while diversity decreased significantly in this treatment during M2 (richness was reduced by 11 bands).
Among the bands sequenced (Table 4, Figure 2), B10 was common to all the samples. From this band, 8 sequences out of 10 obtained were related to the genus Pseudomonadales (class Gammaproteobacteria) during M1, the two other sequences corresponding to the genus Burkholderiales (class Betaproteobacteria). The affiliation of this band was clearly not monospecific, and this was obvious from the sequencing results obtained for M2 (no clear discrimination for the taxonomic assignment of this band). We selected one band (B9) that was observed only in <10 µm treatments (in both M1 and M2, at t0 and t96), suggesting that bacteria associated to this band were probably not a free small size bacteria, but were associated to microbes in the size fraction (for instance phycosphere bacteria). This band was affiliated to Flavobacterium (Bacteroides) during M1 and rather to a Gammaproteobacterium during M2. We were also interested in identifying taxa that disappeared during incubation, for this purpose, we sequenced B1 that was present in M1 (not in M2), at t0, in both <2 and <10 µm treatment but absent at t96. This band was mainly associated to uncultured Cyanobacteria and Betaproteobacteria. Similarly, Band 8 referring to Rhodococcus was present everywhere at t0 but disappeared thereafter. However it concerned only M2. Another example of one band disappearing at t96 is Band 4 (affiliated mainly to BetaproteobacteriaBurkholderiales and Gammaproteobacteria-Pseudomonadale) which had a particular pattern since it was in the <2 µm treatment at t0 but disappeared at t96, whatever the treatment, enriched or not. Band 3 was observed as a band which increased in intensity, only in enriched treatments (<2E) during M1 (low intensity in the <2 µm treatment at t0, higher intensity at t96 only in enriched samples and absence at t96 for non-enriched samples). This band could also correspond to the band G in M2 (see Figure 1). This band seemed thus to be directly associated to a viral effect but its taxonomic affiliation was difficult, being possibly Brevundimonas or Methylobacterium (Alphaproteobacteria) or Arthrobacter or Microbacterium (Actinbacteria). Band A concerned <10 µm samples but if it was present at t0, it disappeared at t96, suggesting here a clear grazing impact or a synergistic effect of viruses and grazers. The same could be said for Band 7 (affiliated mainly to Arthrobacter or Rhodococcus, Actinobacteria) which also concerned <10 µm samples (disappearance of the band at t96). Band E also concerned <10 µm treated samples but, comparatively to the previous ones, it appeared at t96 while it seemed absent at t0 (probably within the rare taxa). These bands A and E belonged to the same bacterial groups (i.e. Betaproteobacteria-Burkholderiales and Gammaproteobacteria-Pseudomonadale) and observed changes occurred within these groups.
Cluster analysis based on the quantification of the band position and intensity showed firstly that the two experiments could be separated, suggesting a clear seasonal pattern in the response of the bacterial diversity to the different treatments. Secondly, <2 and <10 µm treatments were clearly separated, but the separation between each treatment seemed to be more important in M1 compared to M2 (Figure 4). Typically, the <10 µm treatment during M2 clustered separately from the other treatments.
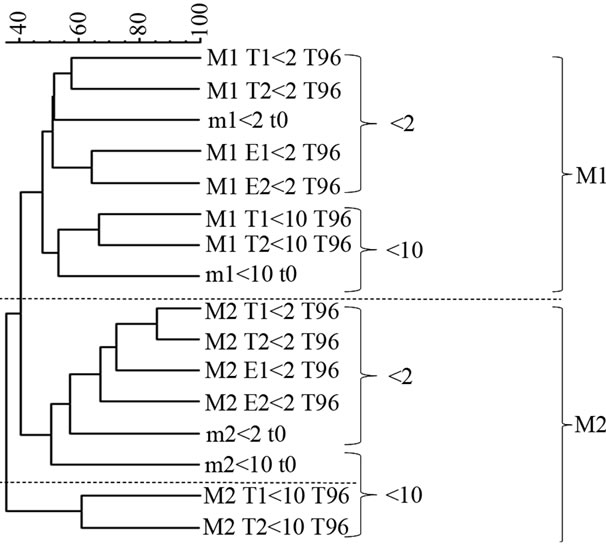
Figure 4. Cluster analysis of DGGE profiles based on band position and intensity. The scale bar represents the BrayCurtis similarity index. M1 and M2 correspond to the two experiments conducted in April and May, respectively. T1-T2 and E1-E2 correspond to the replicates of the control and the enriched treatment, respectively. t0 and t96 correspond to day 0 and day 4 for each experiment.
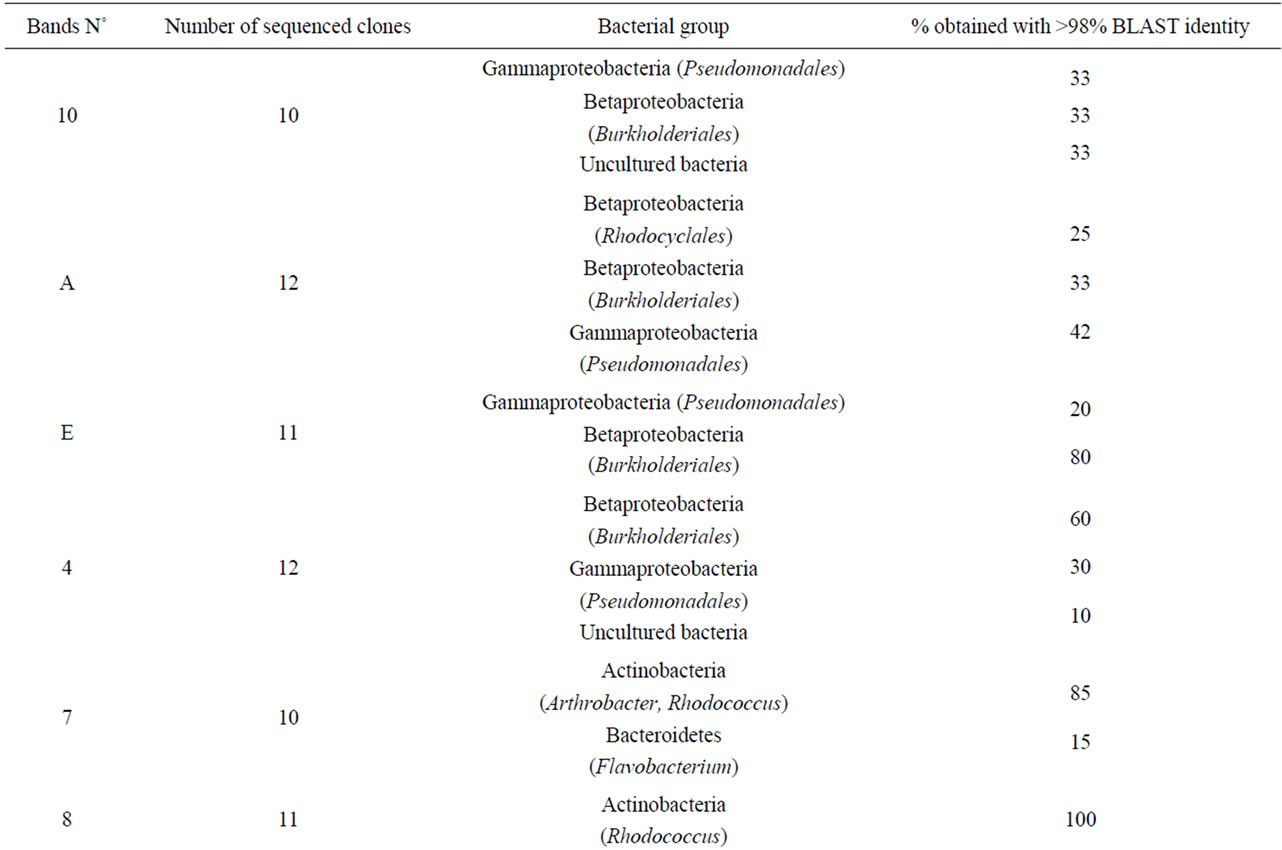

Table 4. Phylogenetic information about the bacterial groups corresponding to the excised and sequenced DGGE bands obtained during M1 and M2.
According to the CCA, the cumulative percent variance of the bacterial diversity-biological variables relationship indicated that the first and second canonical axes accounted for 26.7% and 18.1% of this variance for M1 and for 28.1% and 19.1% of this variance for M2. Thus, the first two axes accounted for less than 50% of this variance whatever the period of the experiment considered (Figure 5). As subsequent axes accounted for less than 10% of the variance each, they were not considered further. During M1, the first canonical axis was highly positively correlated to almost all the cellular forms (i.e. the picocyanobacteria and the other phytoplanktonic populations observed with FCM, the heterotrophic and pigmented flagellates) but also to VLP3 and VLP4 (likely viruses enable to infect eukaryotes, e.g. [1,26,38]) while it was negatively correlated to the heterotrophic bacteria. Associated to this axis and variables, there were all the <10 µm treated samples. The second canonical axis was associated to VLP1 and VLP2 (i.e. viruses reported to infect prokaryotes, e.g. [1,26]) and VIBM, and enriched <2 µm treatments at T96 were positively associated to this axis while <2 µm treatments not enriched at the same time were negatively related to this axis. For M2, the CCA revealed a distinct pattern with VLP3 and VLP4 not associated, as for M1, with the cellular forms and the <10 µm treatments. Also the association between the heterotrophic bacteria and <2 µm treatments were clearer.
4. Discussion
Over the last two decades, predation by protists [28,53] and lysis by viruses [30,54] have been shown to be two main causes of bacterial mortality. However, studies that interested experimentally to the effects/impacts of protistan bacterivory and/or viral lysis on bacterial richness or diversity remain rare and this is particularly true for freshwater ecosystems [20,23,31,32,55]. Moreover, these experimental studies produced contradictory results, some suggesting that both viral lysis and protistan bacterivory do sustain bacterial diversity, the others reporting opposite effects. Our results are original since our experiments were conducted at two nearby periods but characterised by significant differences in terms of physical, chemical and biological in situ initial conditions. Our study reveals that a shift of “predator” control mechanism from viruses to flagellates was likely and could explain on one hand the increase and on the other hand the decrease of the bacterial community richness. Our contribution provides new persuasive evidence that the presence of viruses and small heterotrophs can explain in part bacterial community structure and shifts on the short-term in lacustrine ecosystems, with possible contrasting impacts.
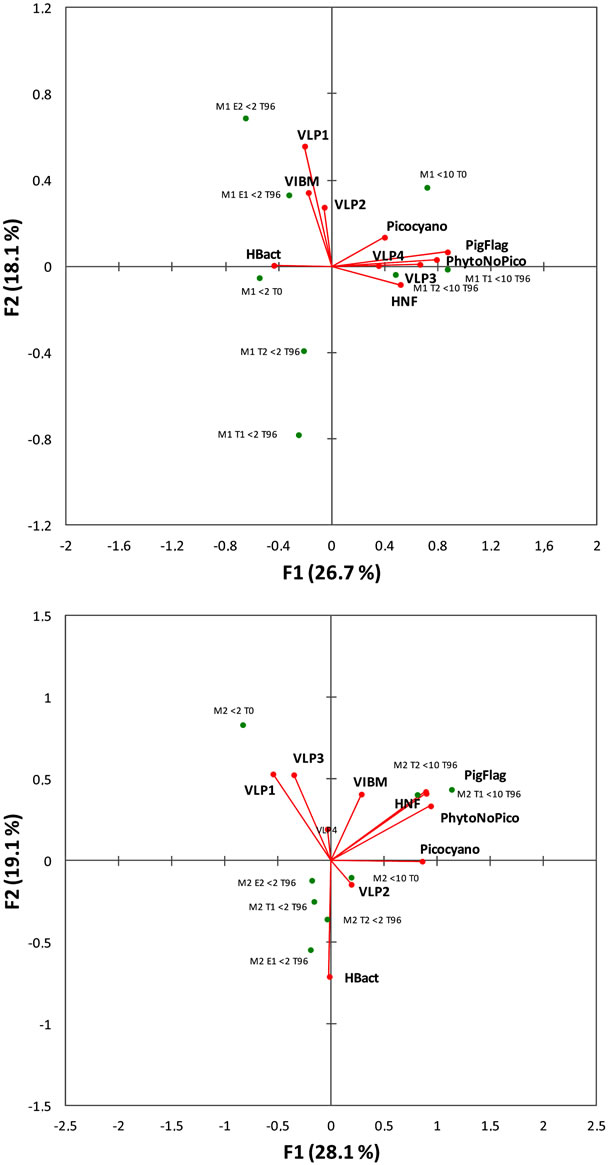
Figure 5. Canonical correspondence analysis of the bacterioplankton community structure for the two experiments (M1 in the upper part and M2 below) using available biological parameters. VLP = virus-like particles, Hbact = heterotrophic bacteria, Picocyano = picocyanobacteria, PhytoNoPico = all phytoplankters other than picocyanobacteria detected by FCM, PigFlag = pigmented nanoflagellates, HNF = heterotrophic nanoflagellates. Results of the permutation tests were highly significant (p < 0.001).
4.1. Limits of the Method
The size fractionation approach and viral particles concentration we used in this study to highlight specific biotic relationships within the microbial world is obviously a short-cut of the reality. This is particularly true when considering viral vs. protozoan effects on bacterioplankton since a complex set of interactions is likely to occur among these communities so that separating them may introduce some bias [33,56,57]. Although bottle experiments have been commonly used to examine a variety of processes within the microbial world, incubating water samples in restricted bottle volumes has also been shown to prevent what may really occur in nature, i.e. the development and interactions of some different microbial communities, because of confinement and handling effects [58]. In our experiment, we chose to work with a “large” volume (i.e. 2.5 L) and on a relatively short-term duration (96 h) to reduce bottle confinement effects, as already proposed and used successfully elsewhere [25, 31]. Such a design was thus assumed to be realistic enough to study microbial interactions between viruses, bacteria and small protists and obtain significant changes in the bacterial community structure in response to natural or modified biotic pressure. However, we are aware that, as our experimental protocol for the <2 µm treatment did not result in a complete removal of the heterotrophic nanoflagellates, this could have bias some of our conclusions. It is noteworthy however that HNF reducetion was high, between 75 and 83% compared to the <10 µm treatment.
4.2. Was There a Viral Effect on the Bacterial Community
The <2 µm treatments were analysed to highlight the possible relationships between the viruses and the freeliving bacteria, when released from the eukaryotic pressure both in terms of resource competition and grazing. The main results were that during the first experiment (April), we observed after 96 h a significant and similar increase of the bacterial richness in both the enriched and non-enriched treatments while no significant changes were observed during the second experiment (May). This increase was paralleled by bacterial abundances multiplied by 2 to 3, and a reduction of the viral abundance (the VBR being reduced by app. a factor of 3). By contrast, viral concentration increased over the course of the experiment in May while the bacterial abundance evolved similarly than in April (the VBR being also reduced, as during M1, but in a lower extent). In addition, we clearly observed a higher intensity (in the <2 µm and enriched samples) or apparition of DGGE bands only in the <2 µm fraction. All together, these results suggested that viruses could sustain bacterial diversity at a period (April) where viral lysis could be high as supported by the highest abundance of the bacteria and resource availability (see Tables 1 and 2) at t0 in M1 compared to M2, that was also corroborated by high growth rates (see Table 3) measured in April compared to May. It is possible that viruses could control abundance within some host bacterial groups according to Thingstad (2000)’s model [59]. Thus, it is suggested that viruses could control the diversity of the prokaryotes, typically by killing the most competitive (e.g. abundant) members of the prokaryotic community following the “killing the winner” hypothesis [59,60] as proposed or demonstrated elsewhere [8,10,22,45,61-63].
As the viral enrichment did not induce significant modifications of the bacterial richness compared to the control in April, this could be explained by the fact that enough lytic agents (related to the number of susceptible cells and/or cell receptors) were already present in the sample and that increasing this amount did not change the ratio of infected cells (and this was indirectly supported by the low VIBM). It is noteworthy however that, in May, while there was no significant difference between t0 and t96 in terms of bacterial diversity in the <2 µm treatment, we observed a weak reduction of the DGGE band numbers in the enriched treatment. This may suggest that, at this period (limited by the resources and characterised by a reduced bacterial growth rate) compared to the month before, increasing the lytic agents could be important to induce bacterial diversity shifts. This result is particularly interesting since we could only enrich by 18% the viral abundance in M2 while it was about 58% in April. If realistic, it also means that the effect of the viruses in May could have been completely different from April, with here a clear reduction of the bacterial community richness. Such a proposal could be sustained from a previous study we conducted in Lake Bourget where we observed indeed significant differences in viral lysis vs. grazing on bacterial mortality between April and May [27].
Among reasons why we did not observe any signifycant viral effect during M2, we can also refer to mechanisms and processes potentially involved in viral infectivity decay, in particular bacterial exoenzymatic activity [64], degradation by solar (UV) radiation [64-66] and grazing by phagotrophic flagellates [67-69] that could have been higher in May compared to April. It is likely indeed that viral susceptibility to the different factors mentioned above may vary greatly over time and space and these processes should be rigorously tested in terms of loss of infectivity, because this could help better explaining viral role on bacterial community regulation.
All together, our results reveal or suggest the seasonal variability in abundance and in the lytic action of the viruses, as already highlighted in this lake and others [26]. Our results support on one hand the idea that viral regulation of bacterial diversity may be significant during high cellular activities and periods of high bacterial growth rates. In another hand, viruses infecting cells characterized by reduced metabolism could have reduced the lytic mechanism, and consequently the impact on bacterial mortality and diversity could have been lower in May. Indeed, lysogenic infection is considered the most favourable way of bacterial infection in waters characterized by low bacterial production [70-72] and a such a strategy has been highlighted in the neighbouring lake Bourget by Thomas et al. (2011, [27]) who reported that oligotrophic conditions may drive viral life strategies towards lysogenic rather than lytic infection.
4.3. Was There a Grazing Effect on the Bacterial Community Structure
When considering the <10 µm treatment, it is noteworthy reminding here that the effect of the viruses and of the flagellates (both heteroand autotrophic) was mixed. While the <2 µm treatment revealed an increase of the bacterial richness in April, no significant differences were recorded between t0 and t96 in the <10 µm treatment at this period, suggesting at first sight that protists had no effect on the bacterial community structure. In another hand, it was not impossible that an antagonistic effect occurred with the viruses. Indeed, viral abundances increased only in the <10 µm treatment (and not in the <2 µm) in April (enriched or not) and in all treatments in May and, during this second experiment, a significant decrease of the bacterial richness was recorded in the <10 µm treatment. Such a decrease was paralleled by an increase of the HNF and PF by a factor of app. 4 while the increase was significantly lower in April. Also, PO4 and NH3 were considerably reduced in May while NH4 (generally considered as a product of intense grazing) was enhanced. In April, it is thus not possible that predators and viruses could act antagonistically since it is known that the action of the viruses can be strongly conditioned by the presence of predators [33] and that viruses can also be preys for nanoflagellates in lacustrine cosystems [69]. Also, and rather than structural changes, the maintenance of the bacterial richness that we observed in April (compared to the <2 μm treatment) could be due to the presence of picoand nanophytoplankton ensuring the recycling of favourable nutrients. Indeed, we noticed that the effect of maintaining diversity in the <10 μm treatment was higher when the pigmented flagellates abundances were high (10 fold higher in April).
Modifications of the heterotrophic bacterial diversity in response to protistan predation (typically by the heterotrophic flagellates) have been demonstrated for long (i.e. [73-76]). In our study, the presence of the bacterial consumers was associated to a dramatic change of the prokaryotic community structure in May, while bacterial abundance did not change much. Such discrepancy between bacterial abundances, diversity and even cell activity is well known [77]. Various explanations for bacterial community structure changes have been envisaged, including strategies of resistance to predation of certain bacterial strains. According to Jurgens et al. (1999, [73]), when predation of protozoa is a major selection pressure, under-represent taxa may become dominant in particular through the formation of filaments resistant to predation. Protists controlling morphological characteristics of the bacteria or triggering the development of grazing-resistant morphologies have been often observed [5,78-81]. The development of bacteria with a higher motility has also been reported [82] and this may constitute a strategy to escape predators [83]. At last, Lebaron et al. (1999, [84]) suggested that the strategy of resistance of some bacterial species could occur via the production of larger active cells and small inactive cells during each cell division. In our case, diversity was significantly reduced suggesting that previous mechanisms of defence were probably reduced at the scale of the community. In contrast to the study of Jardillier et al. (2005, [8]), performed in Lake Pavin (France), the predators did not seem to act as controlling agents of the bacterial abundance, while viruses were likely responsible for significant changes in the composition of the prokaryotic community. Berdjeb et al. (2011, [31]) also reported that the presence of both predators (nanoflagellates < 5 µm in size and viruses) did not seem to have a clear influence upon bacterial community structure in Lakes Annecy and Bourget. The results found here was more similar to those of Hornak et al. (2005, [55]) who studied the impact of available resources, predation and viral lysis on bacterial diversity, in the reservoir Rimov (Czech Republic) and showed that predators and resources were important to explain bacterial diversity changes compared to viruses. Our results could also be compared to Weinbauer et al. (2007, [23]) who also reported in a freshwater reservoir bacterial diversity reduction in response to the synergistic effect of the two top-down controls (i.e. viral lysis and protozoan grazing).
5. Conclusion
Although the fractionation by filtration was not entirely successful, our data suggested that a separate effect of viral infection from predatory loss may be possible. In another hand, this study also highlighted that grazers and viruses may act synergistically or antagonistically on bacterial community structure of Lake Geneva, depending of the periods of the year, in relation to the resource availability and the metabolic activity of the bacteria. This finding completes other studies conducted on French peri-alpine lakes, e.g. the one by Jacquet et al. (2007, [56]) who reported that virus-induced bacterial mortality was enhanced by the presence of small predators or the one by Berdjeb et al. (2011, [31]) who also demonstrated the synergy of viruses and flagellates on bacterial activity, but not on the bacterial community structure. As already pointed by Miki and Jacquet (2008, [33]), interactions between viruses, bacteria and nanoflagellates remain complex, even at the community level. Our analysis was mainly based on possible impacts of either viruses or grazers on bacterial abundance and diversity. It is noteworthy however that taking into account nutrients could change a little our interpretation. Indeed, we can also imagine that viruses did not have any effect since viral enrichment did not change significantly the DGGE band number compared to the <2 µm treatment. If so, the observed change of the bacterial community structure could be due mainly to the absence of the eukaryotes as a response of the release of the competition for the nutrients between the bacteria and the eukaryotes or the grazing pressure. From our data, we could conclude that, in April, there was no strong nutrient limitation, only a weak competition with phytoplankton but potentially a high grazing pressure. In May, however, competition for the resources and omnivory increased but grazing could be lower. To conclude unambiguously, additional experiments would be needed. A treatment free of viruses but with flagellates should be added for a better understanding of the impact of the ones and the others. Also, our experiments, performed only twice, in April and May, should be extended to other periods of the year, with a set-up separating all possible effects and interactions of viruses and nanoflagellates. Complemented with measures of the quality and quantity of the organic matter, such a study would help to understand more deeply the role of viruses and nanoflagellates on bacterial diversity in Lake Geneva and beyond.
6. Acknowledgements
We thank Jonathan Colombet (UMR CNRS 6023 Microorganismes: Génome et Environnement, Aubière, France) for providing TEM analysis. SP was funded by a grant from the French Research and Technology Ministry. This is a contribution to the French ANR project AQUAPHAGE.
REFERENCES
- S. Personnic, I. Domaizon, T. Sime-Ngando, et al., “Seasonal Variations of Microbial Abundances and VirusVersus Flagellate-Induced Mortality of Picoplankton in Three Peri-Alpine Lakes,” Journal of Plant Research, Vol. 31, No. 10, 2009, pp. 1161-1177. doi:10.1093/plankt/fbp057
- R. Bertoni, C. Callieri, G. Corno, et al., “Long-Term Trends of Epilimnetic and Hypolimnetic Bacteria and Organic Carbon in a Deep Holo-Oligomictic Lake,” Hydrobiology, Vol. 644, No. 1, 2010, pp. 279-287. doi:10.1007/s10750-010-0150-x
- D. Kirchman, H. Ducklow and R. Mitchell, “Estimates of Bacterial Growth from Changes in Uptake Rates and Biomass,” Applied and Environmental Microbiology, Vol. 44, No. 6, 1982, pp. 1296-1307.
- F. Azam, T. Fenchel, J. G. Field, et al., “The Ecological Role of Water-Column Microbes in the Sea,” Marine Ecology Progress Series, Vol. 10, 1983, pp. 257-263. doi:10.3354/meps010257
- R. W. Sanders, K. G. Porter, S. J. Bennett, et al., “Seasonal Patterns of Bacterivory by Flagellates, Ciliates, Rotifers and Cladocerans in a Freshwater Planktonic Community,” Limnology and Oceanography, Vol. 34, No. 4, 1989, pp. 673-687. doi:10.4319/lo.1989.34.4.0673
- T. Fenchel, “The Microbial Loop—25 Years Later,” Journal of Experimental Marine Biology and Ecology, Vol. 366, No. 1-2, 2008, pp. 99-103. doi:10.1016/j.jembe.2008.07.013
- E. S. Lindsrtöm, “Investigating Influential Factors on Bacterioplankton Community Composition: Results from a Field Study on Five Mesotrophic Lakes,” Microbial Ecology, Vol. 42, No. 4, 2001, pp. 598-605. doi:10.1007/s00248-001-0031-y
- L. Jardillier, Y. Bettarel, M. Richardot, et al., “Effects of Viruses and Predators on Prokaryotic Community Composition,” Microbial Ecology, Vol. 50, No. 4, 2005, pp. 557-569. doi:10.1007/s00248-005-5030-y
- I. Hewson and J. A. Fuhrman, “Viral Impacts upon Marine Bacterioplankton Assemblage Structure,” Journal of the Marine Biological Association of the United Kingdom, Vol. 86, No. 3, 2006, pp. 577-589. doi:10.1017/S002531540601349X
- I. Hewson and J. A. Fuhrman, “Co-Variation of Viral Parameters with Bacterial Assemblage Richness and Diversity in the Water Column and Sediments,” Deep-Sea Research Part I, Vol. 54, No. 5, 2007, pp. 811-830. doi:10.1016/j.dsr.2007.02.003
- L. Berdjeb, J. F. Ghiglione and S. Jacquet, “Bottom-Up vs. Top-Down Factors Regulating the Bacterial Community Structure in Two Peri-Alpine Lakes,” Applied and Environmental Microbiology, Vol. 77, No. 11, 2011, pp. 3591-3599. doi:10.1128/AEM.02739-10
- M. G. Hofle, M. W. Hahn and E. R. Moore, “Bacterial Filament Formation, a Defense Mechanism against Flagellate Grazing, Is Growth Rate Controlled in Bacteria of Different Phyla,” Applied Environmental Microbiology, Vol. 65, No. 1, 1999, pp. 25-35.
- K. van der Gucht, K. Sabbe, L. de Meester, et al., “Contrasting Bacterioplankton Community Composition and Seasonal Dynamics in Two Neighbouring Hypertrophic Freshwater Lakes,” Environmental Microbiology, Vol. 3, No. 11, 2001, pp. 680-690. doi:10.1046/j.1462-2920.2001.00242.x
- A. C. Yannarell, A. D. Kent, G. H. Lauster, et al., “Temporal Patterns in Bacterial Communities in Three Temperate Lakes of Different Trophic Status,” Microbial Ecology, Vol. 46, No. 4, 2003, pp. 391-405. doi:10.1007/s00248-003-1008-9
- A. Shade, A. D. Kent, S. E. Jones, et al., “Interannual Dynamics and Phenology of Bacterial Communities in a Eutrophic Lake,” Limnology and Oceanography, Vol. 52, No. 2, 2007, pp. 487-494. doi:10.4319/lo.2007.52.2.0487
- M. Tijdens, H. L. Hoogveld, M. P. Kamst-van Agterveld, et al., “Population Dynamics and Diversity of Viruses, Bacteria and Phytoplankton in Shallow Eutrophic Lake,” Microbial Ecology, Vol. 56, No. 1, 2008, pp. 29-42. doi:10.1007/s00248-007-9321-3
- E. S. Lindström, “Bacterioplankton Community Composition in a Boreal Forest Lake,” FEMS Microbiology Ecology, Vol. 27, No. 2, 1998, pp. 163-174. doi:10.1111/j.1574-6941.1998.tb00534.x
- E. S. Lindsrtöm, “Bacterioplankton Community Composition in Five Lakes Differing in Trophic Status and Humic Content,” Microbiology Ecology, Vol. 40, 2000, pp. 104-113.
- D. Boucher, L. Jardillier and D. Debroas, “Succession of Bacterial Community Composition over Two Consecutive Years in Two Aquatic Systems: A Natural Lake and a Lake-Reservoir,” FEMS Microbiology Ecology, Vol. 55, No. 1, 2005, pp. 79-97. doi:10.1111/j.1574-6941.2005.00011.x
- K. Šimek, J. Pernthaller, M. G. Weinbauer, et al., “Changes in Bacterial Community Composition and Dynamics and Viral Mortality Rates Associated with Enhanced Flagellate Grazing in a Mesoeutrophic Reservoir,” Applied and Environmental Microbiology, Vol. 67, No. 6, 2001, pp. 2723-2733. doi:10.1128/AEM.67.6.2723-2733.2001
- S. Jacquet, I. Domaizon, S. Personnic, et al., “Estimates of Protozoan and Virus-Mediated Mortality of Bacterioplankton in Lake Bourget (France),” Freshwater Biology, Vol. 50, No. 4, 2005, pp. 627-645. doi:10.1111/j.1365-2427.2005.01349.x
- T. Bouvier and P. A. del Giorgio, “Key Role of Selective Viral-Induced Mortality in Determining Marine Bacterial Community Composition,” Environmental Microbiology, Vol. 9, No. 2, 2007, pp. 287-297. doi:10.1111/j.1462-2920.2006.01137.x
- M. G. Weinbauer, J. Hornak, J. Nedoma, et al., “Synergistic and Antagonistic Effects of Viral Lysis and Protistan Grazing on Bacterial Biomass, Production and Diversity,” Environmental Microbiology, Vol. 9, No. 3, 2007, pp. 777-788. doi:10.1111/j.1462-2920.2006.01200.x
- R. Zhang, M. G. Weinbauer and P. Y. Qian, “Viruses and Flagellates Sustain Apparent Richness and Reduce Biomass Accumulation of Bacterioplankton in Coastal Marine Waters,” Environmental Microbiology, Vol. 9, No. 12, 2007, pp. 2008-2018. doi:10.1111/j.1462-2920.2007.01410.x
- O. Bonilla-Finji, G. J. Herndl, J. P. Gattuso, et al., “Viral and Flagellate Control of Prokaryotic Production and Community Structure in Offshore Mediterranean Waters,” Applied and Environmental Microbiology, Vol. 75, No. 14, 2009, pp. 4801-4812. doi:10.1128/AEM.01376-08
- S. Personnic, I. Domaizon, U. Dorigo, et al., “Seasonal and Spatial Variability of Virio, Bacterio-, and Picophytoplanktonic Abundances in Three Peri-Alpine Lakes,” Hydrobiology, Vol. 627, No. 1, 2009, pp. 99-116. doi:10.1007/s10750-009-9718-8
- R. Thomas, L. Berdjeb, T. Sime-Ngando and S. Jacquet, “Viral Abundance, Production, Decay Rates and Life Strategies (Lytic vs. Lysogeny) in Lake Bourget,” Environmental Microbiology, Vol. 13, 2011, pp. 616-630.
- M. W. Hahn and M. G. Höfle, “Grazing of Protozoa and Its Effect on Populations of Aquatic Bacteria,” FEMS Microbiology Ecology, Vol. 35, No. 2, 2001, pp. 113-121. doi:10.1111/j.1574-6941.2001.tb00794.x
- J. Comte, S. Jacquet, S. Viboud, et al., “Microbial Community Structure and Dynamics in the Largest Natural French Lake (Lake Bourget, February to July 2002),” Microbiology Ecology, Vol. 52 , No. 1, 2006, pp. 72-89. doi:10.1007/s00248-004-0230-4
- M. G. Weinbauer, “Ecology of Prokaryotic Viruses,” FEMS Microbiology Reviews, Vol. 28, No. 2, 2004, pp. 127-181. doi:10.1016/j.femsre.2003.08.001
- L. Berdjeb, T. Pollet, I. Domaizon, et al., “Effects of Grazers and Viruses on Bacterial Community Structure and Production in Two Contrasting Trophic Lakes,” BMC Microbiology, Vol. 11, 2011, p. 88. doi:10.1186/1471-2180-11-88
- T. Sime-Ngando and A. S. Pradeep Ram, “Grazer Effects on Prokaryotes and Viruses in a Freshwater Microcosm Experiment,” Aquatic Microbial Ecology, Vol. 41, No. 2, 2005, pp. 115-124. doi:10.3354/ame041115
- T. Miki and S. Jacquet, “Complex Interactions in the Aquatic Microbial World: Under-Explored Relationships between Viruses, Bacteria and Heterotrophic Flagellates,” Aquatic Microbial Ecology, Vol. 51, No. 2, 2008, pp. 195-208. doi:10.3354/ame01190
- R. Tadonléké, J. Lazzarotto, O. Anneville, et al., “Phytoplankton Productivity Increased in Lake Geneva despite Phosphorus Loading Reduction,” Journal of Plankton Research, Vol. 31, No. 10, 2009, pp. 1179-1194. doi:10.1093/plankt/fbp063
- S. Jacquet, O. Anneville and O. Domaizon, “Long-Term Trend of Physico-Chemical and Biological Indicators of Water-Quality and Functioning of Large Peri-Alpine Lakes (Lakes Geneva, Annecy and Bourget): A Comparative Study of Ecosystem Trajectories during Re-Oligotrophication,” Archives des Science, Vol. 65, 2012, pp. 191-208.
- C. Leboulanger, U. Dorigo, S. Jacquet, et al., “Application of a Submersible Spectrofluorometer for Rapid Monitoring of Freshwater Cyanobacterial Blooms: A Case Study,” Aquatic Microbial Ecology, Vol. 30, No. 1, 2002, pp. 83-89. doi:10.3354/ame030083
- R. T. Noble, M. Middelboe and J. A. Fuhrman, “Effects of Viral Enrichment on the Mortality and Growth of Heterotrophic Bacterioplankton,” Aquatic Microbial Ecology, Vol. 18, No. 1, 1999, pp. 1-13. doi:10.3354/ame018001
- S. Duhamel, I. Domaizon, S. Personnic, et al., “Assessing the Microbial Community Dynamics and the Role of Bacteriophages in Bacterial Mortality in Lake Geneva,” Journal of Water Science, Vol. 19, No. 2, 2006, pp. 115-126.
- D, Vaulot, “CYTOPC: Processing Software for Flow Cytometric Data,” Signal Noise, Vol. 2, 1989, p. 8.
- D. A. Caron, “Technique for Enumeration of Heterotrophic and Phototrophic Nanoplankton, Using Epifluorescence Microscopy, and Comparison with Other Procedure,” Applied and Environmental Microbiology, Vol. 46, No. 2, 1983, pp. 249-268.
- M. G. Weinbauer and P. Peduzzi, “Frequency, Size and Distribution of Bacteriophages in Different Marine Bacterial Morphotypes,” Marine Ecology Progress Series, Vol. 108, 1994, pp. 11-20.
- M. G. Weinbauer, C. Winter and M. G. Höfle, “Reconsidering Transmission Electron Microscopy Based Estimates of Viral Infection of Bacterioplankton Using Conversion Factors Derived from Natural Communities. Aquatic Microbial Ecology, Vol. 27, No. 2, 2002, pp. 103-110. doi:10.3354/ame027103
- B. J. Binder, “Reconsidering the Relationship between Virally-Induced Bacterial Mortality and Frequency of Infected Cells,” Aquatic Microbial Ecology, Vol. 18, No. 3, 1999, pp. 207-215. doi:10.3354/ame018207
- C. A. Suttle, “The Significance of Viruses to Mortality in Aquatic Microbial Communities,” Microbial Ecology, Vol. 28, No. 2, 1994, pp. 237-243. doi:10.1007/BF00166813
- M. G. Weinbauer and M. G. Höfle, “Significance of Viral Lysis and Flagellate Grazing as Factors Controlling Bacterioplankton Production in a Eutrophic Lake,” Applied and Environmental Microbiology, Vol. 64, No. 2, 1998, pp. 431-438.
- I, Domaizon, S. Viboud and D. Fontvieille, “Taxon-Specific and Seasonal Variations in Flagellates Grazing on Heterotrophic Bacteria in the Oligotrohic Lake Annecy—Importance of Mixotrophy,” FEMS Microbiology Ecology, Vol. 46, No. 3, 2003, pp. 317-329. doi:10.1016/S0168-6496(03)00248-4
- U. Dorigo, D. Fontvieille and J. F. Humbert, “Spatial Variability in the Abundance and Composition of the Free-Living Bacterioplankton Community in the Pelagic Zone of Lake Bourget (France),” FEMS Microbiology Ecology, Vol. 58, No. 1, 2006, pp. 109-119. doi:10.1111/j.1574-6941.2006.00139.x
- G. Muyzer, E. C. de Waad and A. G. Uitterlinden, “Profiling of Complex Microbial Populations by Denaturing Gel Electrophoresis Analysis of Polymerase Chain Reaction-Amplified Genes Coding for 16S rRNA,” Applied and Environmental Microbiology, Vol. 59, No. 3, 1993, pp. 695-700.
- M. Schauer, V. Balagué, C. Pedrós-Alió, et al., “Seasonal Changes in the Taxonomic Composition of Bacterioplankton in Coastal Oligotrophic System,” Aquatic Microbial Ecology, Vol. 31, No. 2, 2003, pp. 163-174. doi:10.3354/ame031163
- N. Fromin, J. Hamelin, S. Tarnawski, et al., “Statistical Analysis of Denaturing Gel Electrophoresis (DGE) Fingerprinting Patterns,” Environmental Microbiology, Vol. 4, No. 11, 2002, pp. 634-643. doi:10.1046/j.1462-2920.2002.00358.x
- T. Huber, G. Faulkner and P. Hugenholtz, “Bellerophon: A Program to Detect Chimeric Sequences in Multiple Sequence Alignments,” Bioinformatics, Vol. 20, No. 14, 2004, pp. 2317-2319.
- J. R. Cole, B. Chai, R. J. Farris, et al., “The Ribosomal Database Project (RDP-II): Sequences and Tools for High-Throughput rRNA Analysis,” Nucleic Acids Research, Vol. 33, Suppl. 1, 2005, pp. D294-D296. doi:10.1093/nar/gki038
- R. Massana and K. Jürgens, “Composition and Population Dynamics of Planktonic Bacteria and Bacterivorous Flagellates in Seawater Chemostat Cultures,” Aquatic Microbial Ecology, Vol. 32, No. 1, 2003, pp. 11-22. doi:10.3354/ame032011
- S. Jacquet, T. Miki, R. Noble, et al., “Viruses in Aquatic Ecosystems: Important Advancements of the Last 20 Years and Prospects for the Future in Microbial Oceanography and Limnology,” Advances in Oceanography and Limnology, Vol. 1, No. 1, 2010, pp. 71-101.
- K. Hornak, M. Masin, J. Jezbera, et al., “Effects of Decreased Resource Availability, Protozoan Grazing and Viral Impact on a Structure of Bacterioplankton Assemblage in a Canyon-Shaped Reservoir,” FEMS Microbiology Ecology, Vol. 52, No. 3, 2005, pp. 315-327. doi:10.1016/j.femsec.2004.11.013
- S. Jacquet, I. Domaizon, S. Personnic, et al., “Do Small Grazers Influence Viral-Induced Bacterial Mortality in Lake Bourget?” Fundamental and Applied Limnology, Vol. 170, No. 2, 2007, pp. 125-132. doi:10.1127/1863-9135/2007/0170-0125
- A. S. Pradeep Ram and T. Sime-Ngando, “Functional Responses of Prokaryotes and Viruses to Grazer Effects and Nutrient Additions in Freshwater Microcosms,” The ISME Journal, Vol. 2, 2008, pp. 498-509. doi:10.1038/ismej.2008.15
- F. Hammes, M. Vital and T. Egli, “Critical Evaluation of the Volumetric ‘Bottle Effect’ on Microbial Batch Growth,”. Applied and Environmental Microbiology, Vol. 76, No. 4, 2010, pp. 1278-1281. doi:10.1128/AEM.01914-09
- T. F. Thingstad, “Elements of a Theory for the Mechanisms Controlling Abundance, Diversity, and Biogeochemical Role of Lytic Bacterial Viruses in Aquatic Systems,” Limnology and Oceanography, Vol. 45, No. 6, 2000, pp. 1320-1328. doi:10.4319/lo.2000.45.6.1320
- T. F. Thingstad and R. Lignell, “Theoretical Models for the Control of Bacterial Growth Rate, Abundance, Diversity and Carbon Demand,” Aquatic Microbial Ecology, Vol. 13, No. 1, 1997, pp. 19-27. doi:10.3354/ame013019
- N. H. Mann, A. Cook, A. Millard, et al., “Bacterial Photosynthesis Genes in a Virus,” Nature, Vol. 424, 2003, p. 741.
- J. A. Fuhrman and M. S. Schwalbach, “Viral Influence on Aquatic Bacterial Communities,” Biological Bulletin, Vol. 204, No. 2, 2003, pp. 192-195. doi:10.2307/1543557
- M. G. Weinbauer and F. Rassoulzadegan, “Are Viruses Driving Microbial Diversification and Diversity,” Environmental Microbiology, Vol. 6, No. 1, 2004, pp. 1-11. doi:10.1046/j.1462-2920.2003.00539.x
- R. T. Noble and J. A. Fuhrman, “Virus Decay and Its Causes in Coastal Waters,” Applied and Environmental Microbiology, Vol. 63, No. 1, 1997, pp. 77-83.
- S. W. Wilhelm, M. G. Weinbauer, C. A. Suttle, et al., “Measurements of DNA Damage and Photoreactivation Imply that Most Viruses in Marine Surface Waters Are Infective,” Aquatic Microbial Ecology, Vol. 14, No. 3, 1998, pp. 215-222. doi:10.3354/ame014215
- W. H. Jeffrey, J. P. Kase and S. W. Wilhelm, “Ultraviolet Radiation Effects on Bacterioplankton and Viruses in Marine Ecosystems,” In: S. J. de Mora, et al., Eds., Effects of UV Radiation on Marine Ecosystems, Cambridge University Press, Cambridge, 2000, pp. 206-236. doi:10.1017/CBO9780511535444.009
- C. A. Suttle and F. Chen, “Mechanisms and Rates of Decay of Marine Viruses in Seawater,” Applied and Environmental Microbiology, Vol. 58, No. 11, 1992, pp. 3721-3729.
- J. M. Gonzales and C. A. Suttle, “Grazing by Marine Nanoflagellates on Viruses and Virus-Size Particles: Ingestion and Digestion,” Marine Ecology Progress Series, Vol. 94, 1993, pp. 1-10.
- Y. Bettarel, T. Sime-Ngando, M. Bouvy, et al., “Low Consumption of Virus-Sized Particles by Heterotrophic Nanoflagellates in Two Lakes of the French Massif Central,” Aquatic Microbial Ecology, Vol. 39, No. 2, 2005, pp. 205-209. doi:10.3354/ame039205
- S. C. Jiang and J. H. Paul, “Significance of Lysogeny in the Marine Environments: Studies with Isolates and a Model of Lysogenic Phage Production,” Microbial Ecology, Vol. 35, No. 3-4, 1998, pp. 235-243. doi:10.1007/s002489900079
- M. G. Weinbauer and C. A. Suttle, “Lysogeny and Prophage Induction in Coastal and Offshore Bacterial Communities,” Aquatic Microbial Ecology, Vol. 18, No. 3, 1999, pp. 217-225. doi:10.3354/ame018217
- S. J. Williamson, L. A. Houchin, L. McDaniel, et al., “Seasonal Variation in Lysogeny as Depicted by Prophage Induction in Tampa Bay, Florida,” Applied and Environmental Microbiology, Vol. 68, No. 9, 2002, pp. 4307-4314. doi:10.1128/AEM.68.9.4307-4314.2002
- K. Jurgens, J. Pernthaler, S. Schalla, et al., “Morphological and Compositional Changes in a Planktonic Bacterial Community in Response to Enhanced Protozoan Grazing,” Applied and Environmental Microbiology, Vol. 65, No. 3, 1999, pp. 1241-1250.
- S. Langenheder and K. Jurgens, “Regulation of Bacterial Biomass and Community Structure by Metazoan and Protozoan Predaton,” Limnology and Oceanography, Vol. 46, No. 1, 2001, pp. 121-134. doi:10.4319/lo.2001.46.1.0121
- K. Šimek, P. Kojecka, J. Nedoma, et al., “Shifts in Bacterial Community Composition Associated with Different Microzooplankton Size Fractions in a Eutrophic Reservoir,” Limnology and Oceanography, Vol. 20, 1999, pp. 1634-1644.
- J. Gasol, M. Comerma, J. Carlos-Garcia, et al., “A Transplant Experiment to Identify the Factors Controlling Bacterial Abundance, Activity, Production and Community Composition in a Eutrophic Canyon-Shaped Reservoir,” Limnology and Oceanography, Vol. 47, No. 1, 2002, pp. 62-77. doi:10.4319/lo.2002.47.1.0062
- J. Pernthaler, “Predation on Procaryotes in the Water Column and Its Ecological Implications,” Nature Reviews, Vol. 3, No. 7, 2005, pp. 537-546.
- B. C. Monger and M. R. Landry, “Prey-Size Dependancy of Grazing by Free-Living Marine Flagellates,” Marine Ecology Progress Series, Vol. 74, 1991, pp. 239-248. doi:10.3354/meps074239
- K. Šimek and T. H. Chrzanowski, “Direct and Indirect Evidence of Size-Selective Grazing on Pelagic Bacteria by Freshwater Nanoflagellates,” Applied and Environmental Microbiology, Vol. 58, No. 11, 1992, pp. 3715-3720.
- U. Christaki, J. Dolan, S. Pelegri, et al., “Consumption of Picoplankton-Size Particles by Marine Ciliates: Effects of Physiological State of the Ciliate and Particle Quality,” Limnology and Oceanography, Vol. 43, No. 3, 1998, pp. 458-464. doi:10.4319/lo.1998.43.3.0458
- T. Posch, J. Jezbera, J. Vrba, et al., “Size Selective Feeding in Cyclidium glaucoma (Ciliophora, Scuticociliatida) and Its Effects on Bacterial Community Structure: A Study from a Continuous Cultivation System,” Microbial Ecology, Vol. 42, No. 3, 2001, pp. 217-227. doi:10.1007/s002480000114
- C. Matz and K. Jurgens, “Interaction of Nutrient Limitation and Protozoan Grazing Determines the Phenotypic Structure of a Bacterial Community,” Microbial Ecology, Vol. 45, No. 4, 2003, pp. 384-398. doi:10.1007/s00248-003-2000-0
- C. Matz, J. Boenigk, H. Arndt, et al., “Role of Bacterial Phenotypic Traits in Selective Feeding of the Heterotrophic Nanoflagellate Spunella sp,” Aquatic Microbial Ecology, Vol. 27, No. 2, 2002, pp. 137-148. doi:10.3354/ame027137
- P. Lebaron, P. Servais, M. Troussellier, et al., “Changes in Bacterial Community Structure in Seawater Mesocosms Differing in Their Nutrient Status,” Aquatic Microbial Ecology, Vol. 19, No. 3, 1999, pp. 255-267. doi:10.3354/ame019255
NOTES
*Corresponding author.