Open Journal of Medical Imaging Vol.05 No.01(2015), Article ID:54309,9
pages
10.4236/ojmi.2015.51002
Fusion Platform for Renal Cyst Characterization
Hatem Besbes1, Wathek Belhajamor2
1Medical School of Tunis, La Rabta, Tunisia
2National School of Computer Sciences, Mannouba, Tunisia
Email: besbesh@gmail.com, wathek.bha@gmail.com
Copyright © 2015 by authors and Scientific Research Publishing Inc.
This work is licensed under the Creative Commons Attribution International License (CC BY).
http://creativecommons.org/licenses/by/4.0/


Received 9 February 2015; accepted 25 February 2015; published 28 February 2015
ABSTRACT
This work concerns the field of diagnostic aids that facilitate diagnostic decisions for practitioners, especially in medical imaging. The pathology in question, in this study, is the renal cyst. The diagnostic process starts from simultaneous acquisitions of double isotope (Teechnetium-99 m and Iodine-131) scintigraphic images. Then, the platform allows the fusion of these images and the calculation of a pathological parameter that permits the characterization of the state of the dysplasic kidney by comparing it with the normal one. The final result is fusion images annotated by the pathological parameter value.
Keywords:
Double Isotope, Renal Cyst, Dual-Isotope, Fusion Platform, Pathological Parameter

1. Introduction
Diagnostic aid systems have started to play an important role in the diagnostic process, especially in the field of medical imaging with the implementation of processing procedures that reveal new image analysis aspects beyond the visual process. In the field of functional imaging, scintigraphy is one of the mostly used techniques thanks to the huge number of the used radiopharmaceuticals and of the acquisition modes. Renal dynamic scintigraphy is an ideal method to judge the functional state of the kidney in case of some renal pathology. For the case of renal cyst, double isotope acquisitions have provided two sets of images, one of which, carried out with iodine-131, indicates the presence of renal cyst [1] , while the other, realized with technetium-99 m (DTPA), reveals kidney functionality [2] [3] . The realization of a fusion platform can constitute a solution for the simultaneous management of the two sets of images. The realized platform is supposed to meet with functional requirements (needed for the platform functioning) based on the application of certain modalities of image processing (filtering, segmentation) for the pretreatment, the fusion of dual isotope scintigraphic images, and the extraction of numerical parameters for the classification of cysts malignity. All these operations depend on the functional as well as the morphological parameters of the kidney. The platform is also supposed to meet with non-functional requirements (not needed for the platform functioning but needed by the users) related both, to the patient, since it reduces costs and saves time for diagnostic establishment (reduction of pain), and to the practitioner as the application must consider his/her technical capabilities and the time he/she spends for image processing and pathological parameter calculation.
2. Method and Materials
2.1. Renal Cyst
The renal cyst appears as one or more pockets on the kidney containing liquid (Figure 1(a)) [4] -[13] . Its appearance is fairly common in old subjects. Cysts are benign and require no treatment and no particular monitoring. The genetic component of this pathology is pronounced in recessive polycystic kidney and dominant polycystic kidney. Because of the abundance and size of cysts, polycystic kidneys can take a considerable size that can be distinguished by palpation. The classical diagnosis begins with an echographic image that reveals the presence of cysts (Figure 1(b)). Malignant tumours may have a cystic appearance [9] -[13] . Their metastatic evolution is rare. CT will confirm the diagnosis of kidney cancer (Figure 1(c)).
The presence of a renal cyst causes a magnification of the contralateral kidney in order to compensate the paralysis of dysplastic kidney. Whereas for the dysplasic kidney, statistics show that in 55% to 95% of cases it decreases in size or even disappears, in 15% to 30% of cases it remains stable and in 0% to 2% of cases it grows.
2.2. Contribution of Scintigraphy
Scintigraphy is a functional imaging, in addition to the revelation of the existence of renal cyst, it can tell us about the functioning status of the dysplasic kidney [1] -[3] [14] [15] . As observed in scintigraphic images, there are two very different formations: cyst (Figure 2(a)) and kidneys (Figure 2(b)). The strategy is to reveal everyone by a different acquisition protocol and to avoid motion artefacts and the use of image recalling better fusion results. Thus, image acquisitions must be performed simultaneously. The solution is the dual-isotope acquisition. Then, we obtain for each time t a couple of images (Figure 3), one showing the kidney and the other revealing the renal cyst.
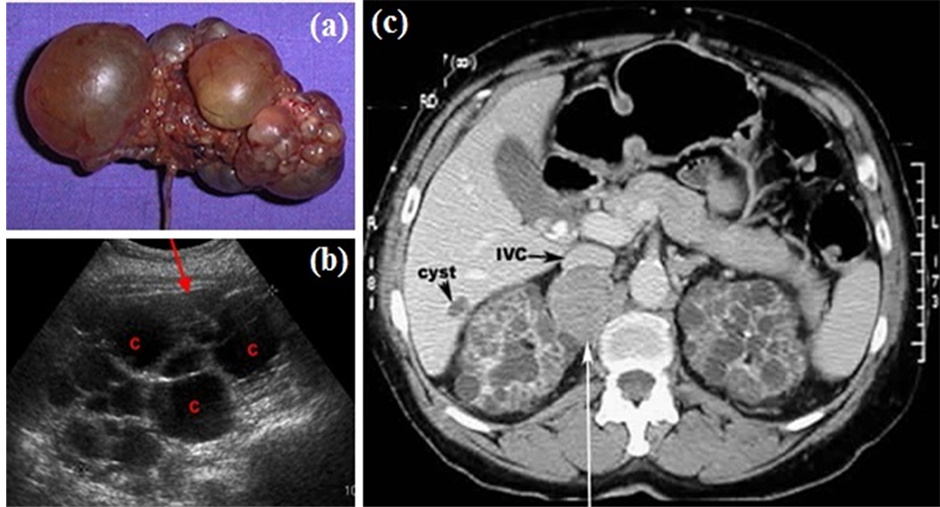
Figure 1. Renal cyst. a) polycystic kidney; b) echography of a polycystic kidney; c) CT of polycystic kidney.
 (a)
(a)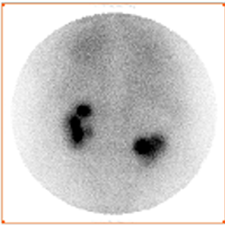 (b)
(b)
Figure 2. Simultaneous dual-isotope acquisitions: a) acquisition with iodine-131 revealing the cyst; b) acquisition with Technetium-99 m revealing the kidneys.
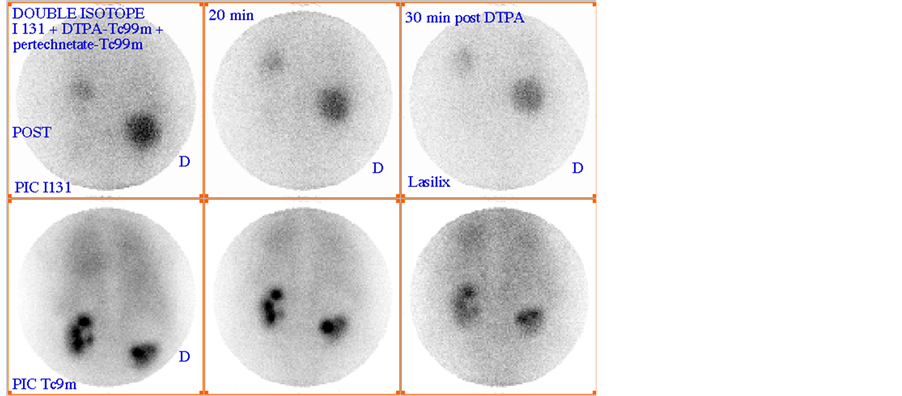
Figure 3. Couples of images acquired at different instants (0, 20 and 30 mn).
Remember that the dual-isotope acquisition involves injecting two radiopharmaceuticals to the patient and opening two energy windows for the acquisition of couples of images. In our case it comes to I-131 and Tc-99 m radiotracers such as energy windows are respectively centred on 340 keV and 140 keV.
The case studied is a patient with hyperthyroidism and following a systemic metabolic radiotherapy with iodine-131 and in whom is suspected a renal pathology that was analyzed by scintigraphy with technetium-99 m. Then, two solutions were administrated to the patient; a solution of Sodium iodine-131 (NaI-131) [16] and a solution of diethylenetriaminepentaacetic acid Technetium-99 m (DTPA-Tc-99m) [16] [17] . In this case, while the kidney function would be tested by the kinetic of accumulation and excretion of the DTPA-Tc-99 m [2] [3] , the cyst would fix the NaI-131[1] . The dual isotope acquisition showed the presence of renal cyst and kidney functions. An adequate fusion of the two images can approach its location relatively to the dysplasic kidney and its influence on its functioning.
2.3. Computational Operations
The computational part was developed with Matlab, and the C++ is used for the interface. This choice was made following the strength of the open source Trolltech QT library [18] . In addition to its portability, it offers a pleasant and good graphic result.
To develop the platform software, we chose Kdevelop, which is similar to Microsoft Visual C++ and offers the features of a good integrated development environment (IDE):
・ Management of all the tools required for programming: compiler, linker, and debugger;
・ Generator of class, skeletons and integration in the project;
・ Managing files included in the project and associated documentation to libraries;
・ API Documentation of the project;
・ Inclusion of a creation program interface.
Moreover Kdevelop directly integrates graphics libraries KDE/QT in its interface. QT Designer permits the creation of visual interfaces (what you see, what you get). The interfaces are directly integrated as xml file to the current project under Kdevelop. Figure 4 explains the principle of deploying a developed GUI using QT Designer to communicate with the application developed in C++ [18] .
The application is developed under the “Kdevelop” environment. The “QT Designer” (QT 04) is used as a creation assistant interface, using Trolltech QT library. For image processing, “Mathworks Matlab R2008a” Linux is used.
3. Results and Discussion
3.1. Fusion Platform
According to the UML formalism, the first phase of modelling consists in identifying the various actors interacting with the platform [19] -[21] . In our application it is the nuclear physician and the prescribing doctor. To better understand the succession of actions over time and the temporal constraints of the interactions between the actor and the platform, we have established a sequences diagram (Figure 5). This diagram is based on the usual scenario followed in such cases. Indeed the treating doctor suspecting the anomaly in the patient directs him to the nuclear physician. The latter makes scintigraphic images and introduces the acquired images in the file as they will be later explained. Then he chooses a fusion method from the selection that appears. The calculation of the pathological parameter is then activated and the fusion is carried out by the platform. These results enable him to write a report and to return it to the treating doctor.
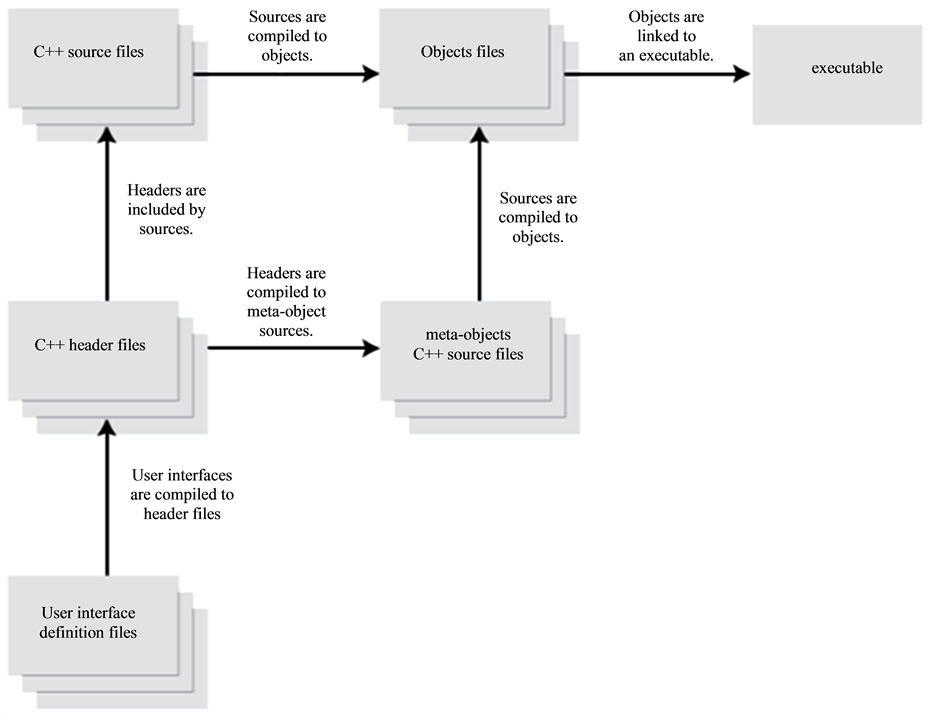
Figure 4. Creation of an interface with QT Designer and Kdevelop.
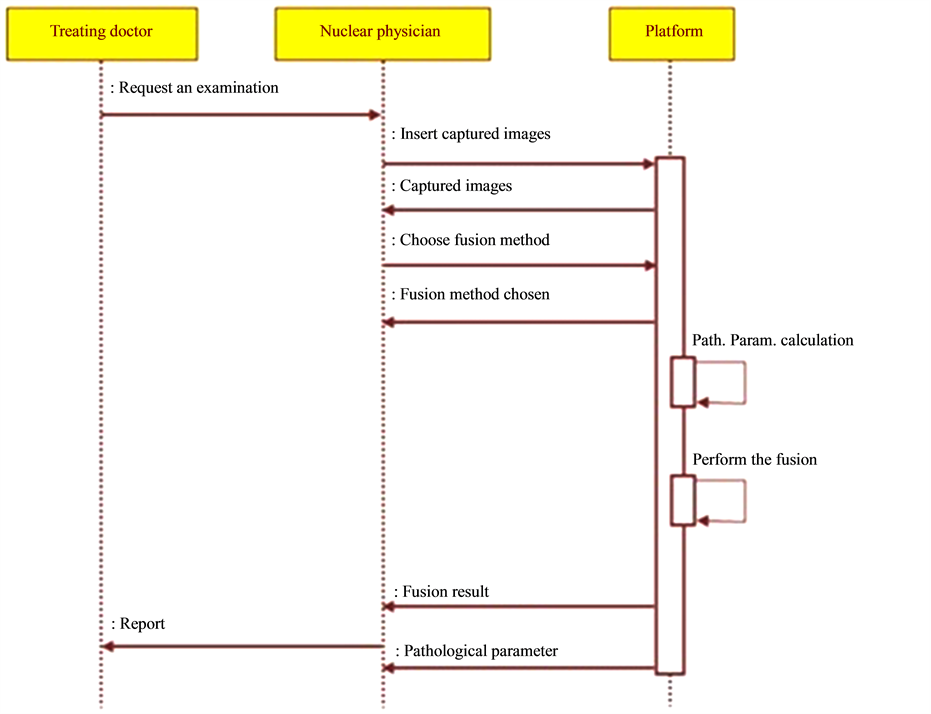
Figure 5. Diagram of sequences.
The different use cases of the platform are:
・ Enter list of images: It is the task of the nuclear physician and it consists of entering the list of images taken in a file that serves as input to the fusion program.
・ Choose fusion method: The nuclear doctor inserts the fusion method he has chosen. This use case uses the input list by the use case “Enter list of images”. That’s why a relationship “include” links it to the latter.
・ Choose couple of images: The user must choose a couple of images in order to visualize the fusion result.
・ Calculate pathological parameter: The system examines the temporary evolution of images acquired with Tc-99 m.
・ Display results of fusion.
・ Establish report: The user, in this case may refer to the results of the two use cases above, i.e. “calculate the pathological parameter” and “display results of fusion”. Hence, it follows the relationship “include”.
The developed application will allow us to validate the concept and the method designed for the identification of renal cysts. In fact, this application provides an interface for setting the input data software, namely: image files (images to fuse) and the fusion method. The software should be composed of a core comprising the computational part and a module dedicated to the man-machine interface. The computational part presents the purpose of the project. It therefore retains all our interest. Indeed, the long term objective of the present project is to initiate fusion methods which take a basic temporal evolution aspect.
The computational part supports image processing methods for fusion and calculation of pathological parameter. In the studied case, there is a large size, which is easy to distinguish from the dysplasic kidney. However, it will be interesting to investigate cases where the cyst is small for an early diagnostic of the pathology. In this case, it will be difficult to differentiate the cyst from the dysplasic kidney. Therefore, it is necessary, considering the variety of cysts (benign or malignant), to develop different fusion procedures in several domains (spatial, frequency, multi-resolution). This will provide more flexibility to the platform. So, we have established a library of fusion methods to offer to the users of the platform the opportunity to choose the appropriate fusion procedure [22] -[30] . The four proposed methods of image fusion are: fusions in the spatial domain, fusion in the frequency domain, standard fusion in the multi-resolution domain and global energy fusion in the multi-resolution domain (Figure 6).
As mentioned earlier, the renal cyst affects renal function which necessarily implies a remarkable gap between the functionality of the dysplasic kidney and that of the normal kidney. The study of the variation of the activity in each kidney is used to evaluate this gap. Pathological parameter describes this gap by assessing variation in average activity per pixel as a function of time. First, the pathological parameter calculation requires, above all, proceeding by a segmentation operation, facilitated by a step of enhancement and followed by a filtering operation (Figure 7) [31] . Second, it comes to calculate the average values of pixels in the kidney area for both left and right kidneys for different dates of acquisition, then normalize the values of the first acquisition for each kidney, and finally interpolate the average values for both kidneys to visualize the evolution over time of the respective kidney activities and finally calculate the area between the two time evolution curves (that’s why we propose, in this case, to do a dynamic double-isotope scintigraphy). The value of the area between the two curves is used to describe the operating discordance rate between the dysplasic and the normal kidney (Figure 8). This amount explaining the effect of the renal cyst on the dysplasic kidney will be called “pathological parameter”.
3.2. General Conception
The application design is based on several images, at the entry, which will undergo different processing operations and calculations. It starts by designing a class “Param” that calculates the time parameter, then another class “Fusion” taking charge to make the image fusion operation, and then a class “Display” that displays the final result (Figure 9). This application is designed while minimizing the dependencies between modules (Figure 9).
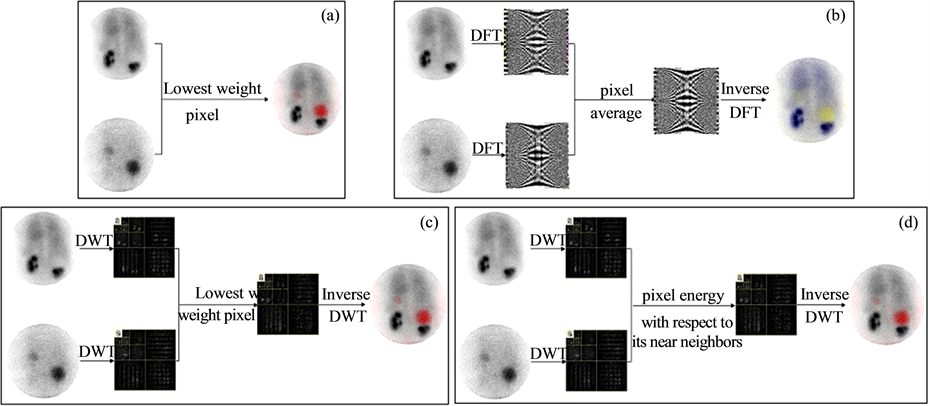
Figure 6. Fusion processes. a) spatial domain; b) frequency domain; c) multirésolution domain (standard); d) multiresolution domain Global Energy Method (GEM).
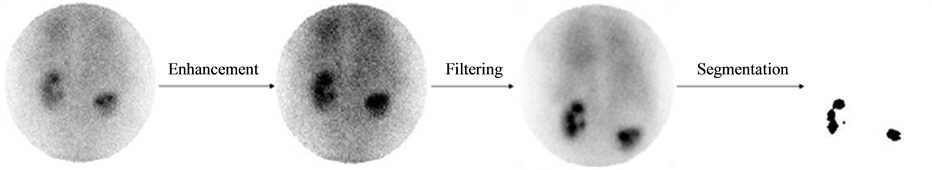
Figure 7. Image pretreatment.
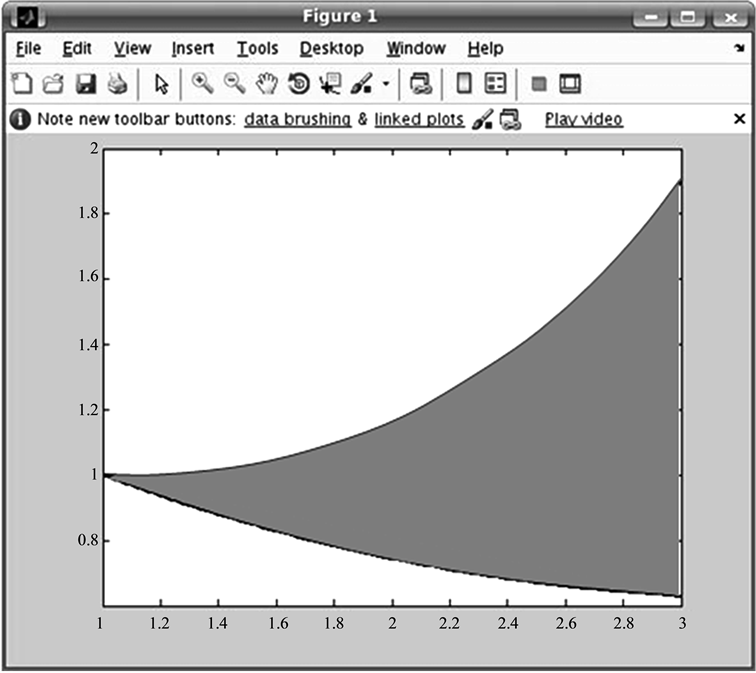
Figure 8. Pathological parameter calculation.
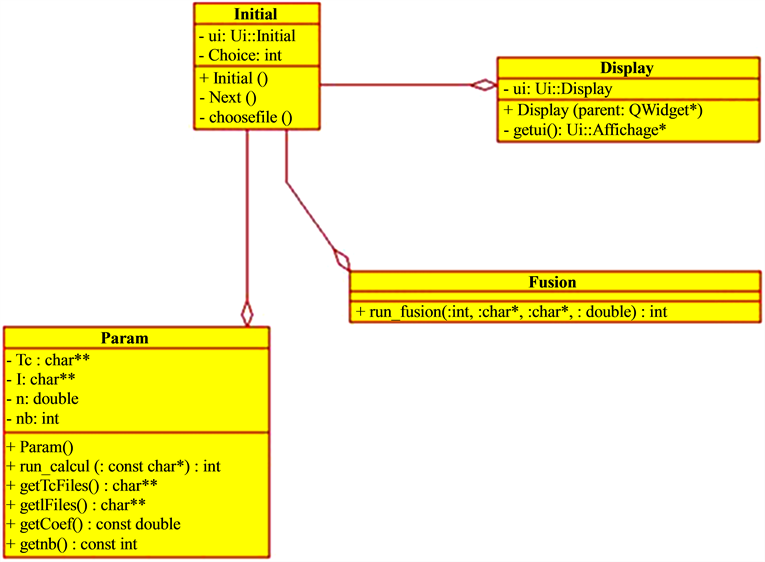
Figure 9. General structure of the application.
This allows a maximum gain during integration, testing and maintenance phases. A class called “Initial” is responsible for synchronizing calls to other classes in the application.
The application can be described as follows:
・ “Initial” class: It is the centrepiece class, it will launch the application and govern the various calls to other classes such as the call to the parameter calculation and the call for a fusion operation (Figure 9).
・ Param Class: It receives a file name, uses the “CalculTc” function from the library generated by MATLAB, and gives back the list of Technetium and Iodine files extracted from the source file and the calculated pathological parameter (Figure 9).
・ Fusion class: This class plays a very important role in this application. It takes as parameter files to fuse and fusion method to be applied and uses appropriate fusion method. This is written on MATLAB and exported in a library with “deploytool” (Figure 9).
・ Display class: This class contains methods for display (Figure 9).
3.3. Implementation of the Platform
The platform gives the user a list of different methods of fusion (Figure 10). It also gives him the possibility to select the file containing the names of scintigraphic images that will undergo fusion. This file must follow the format as shown in Figure 10. Once these two choices are made, it is for the user to press after allowing it to access the subsequent screen. The latter is described in detail below in Figure 10.
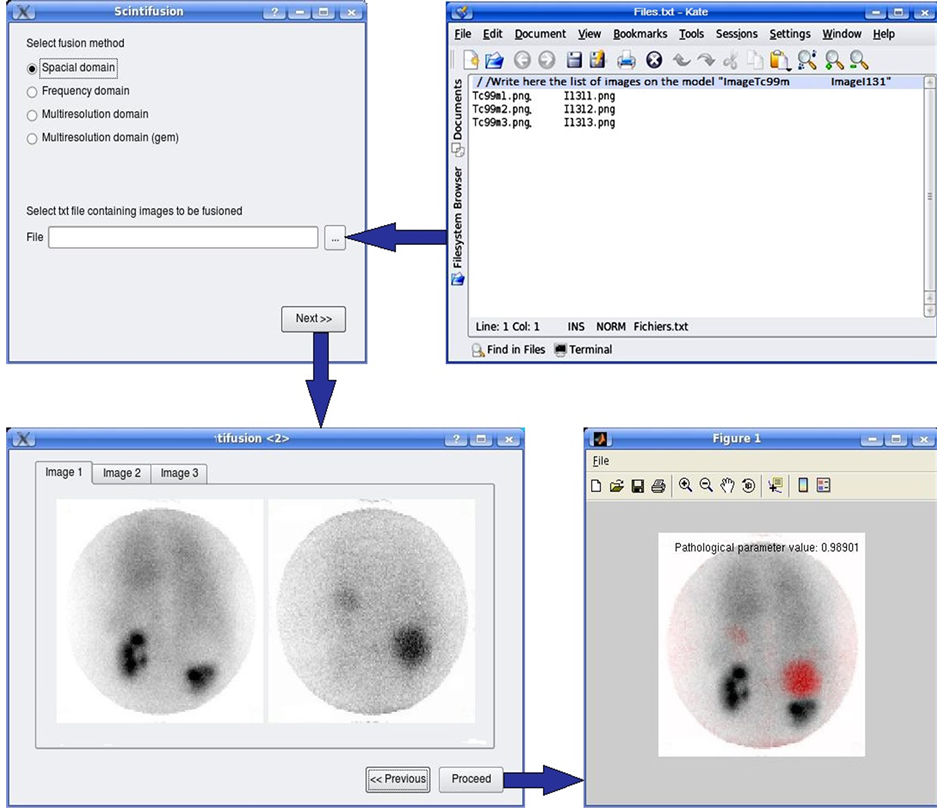
Figure 10. Implementation of the fusion platform.
By the increase in cases of renal cyst studied by dynamic double isotope scintigraphy, it will be possible to achieve a severity scale of this disease, and then to propose a classification of the state of severity depending on the value of the pathological parameter.
The achieved platform can be further used for the characterization of other pathologies using its fusion library. This library is likely to expand by introducing other fusion approaches.
4. Conclusion
The realized platform constitutes a diagnostic aid that provides the nuclear physicians with the opportunity to choose a modality fusion of four. Yet, it can be extended to a wide library of fusion modality, to visualize both the kidney and the lateralized cyst and control the functionality of dysplastic kidney by calculating the pathological parameter. The latter should be taken up by the nuclear physicians to associate a severity scale and exploit it for possible early detection of malignant tumor formations.
References
- Kraft, O., Sirucek, P., Mrhac, L. and Havel, M. (2011) I-131 False Positive Uptake in a Huge Parapelvic Renal Cyst. Nuclear Medicine Review, 14, 36-37. http://dx.doi.org/10.5603/NMR.2011.0008
- Zhao, X., Shao, Y., Wang, Y., Tian, J., Sun, B., Ru, Y., Zhang, A. and Hao, J. (2012) New Normal Values Not Related to Age and Sex, of Glomerular Filtration Rate by (99m)Tc-DTPA Renal Dynamic Imaging, for the Evaluation of Living Kidney Graft Donors. Hellenic Journal of Nuclear Medicine, 15, 210-214.
- Li, Q., Zhang, C.L., Fu, Z.L., Wang, R.F., Ma, Y.C. and Zuo, L. (2007) Development of Formulae for Accurate Measurement of the Glomerular Filtration Rate by Renal Dynamic Imaging. Nuclear Medicine Communications, 28, 407- 413.http://dx.doi.org/10.1097/MNM.0b013e3280a02f8b
- Schrier, R.W. (2007) Diseases of the Kidney & Urinary Tract. 8th Edition, Lippincott Williams & Wilkins, Philadelphia.
- Greenberg, A., Cheung, A.K., Coffman, T.M., Falk, R.J. and Jennette, J.C. (2009) Primer on Kidney Diseases. 5th Edition, Elsivier Health Sciences, Amsterdan.
- Goldsmith, D., Jayawardene, S. and Ackland, P. (2007) ABC of Kidney Disease. Blackwell Publishing Ltd., Oxford.
- Ishikawa, I. (2007) Acquired Cystic Disease of the Kidney and Renal Cell Carcinoma. Springer, Tokyo Berlin Heidelberg, New York.
- Schrier, R.W. (1999) Atlas of Deseases of the Kidney. Current Medicine Inc., Philadelphia.
- Reznek, R.H. and Husband, J.E. (2008) Carcinoma of the Kidney. Cambridge University Press, Cambridge.
- Hino, O., Ed. (1999) Kidney Cancer, Recent Results of Basic and Clinical Research. Karger Publisher, Basel. http://dx.doi.org/10.1159/isbn.978-3-318-00465-6
- Belldegrun, A., Ritchie, A.W.S., Figlin, R.A., Oliver, R.T.D. and Vaughan, E.D. (2003) Renal and Adrenal Tumors Biology and Management. Oxford University Press, Oxford.
- Taal, M.W., Chertow, G.M., Marsden, P.A., Skorecki, K., Yu, A.S.L. and Brenner, B.M. (2012) Brenner & Rector’s the Kidney. Elsevier, Amsterdam.
- Kavoussi, L.R., Novick, A.C., Partin, A.W. and Peters, C.A. (2012) Campbell-Walsh Urology. 10th Edition, Elsevier, Amsterdam.
- Fogelman, I., Maisey, M.N. and Clark, S.E.M. (1994) Atlas of Clinical Nuclear Medicine. Martin Dunitz Ltd., London.
- Cook, G.J.R., Maisey, M.N., Britton, K.E. and Chengazi, V. (2006) Clinical Nuclear Medicine. Fourth Edition, Hodder Arnold, London.
- Saha, G.B. (2010) Fundamentals of Nuclear Pharmacy. Sixth Edition, Springer, New York, Heidelberg, Dordrecht and London. http://dx.doi.org/10.1007/978-1-4419-5860-0
- Welch, M.J. and Redvanly, C.S. (2003) Handbook of Radiopharmaceuticals: Radiochemistry and Applications. John Wiley & Sons, Hoboken.
- Thelin, J. (2007) Foundations of Qt Development. Springer-Verlag, New York. http://dx.doi.org/10.1007/978-1-4302-0251-6
- Dennis, A., Wixom, B.H. and Tegarden, D. (2009) System Analysis Design UML Version 2.0: An Object-Oriented Approach. John Wiley & Sons, Hoboken.
- Larman, G. (2004) Applying UML and Patterns: An Introduction to Object-Oriented Analysis and Design and the Unified Process. Prentice-Hall, Englewood Cliff.
- Oestereich, B. (2001) Developing Software with UML: Object-Oriented Analysis and Design in Practice. 2nd Edition, Addison-Wesley, Boston.
- Ukimura, O. (2011) Image Fusion. InTech. http://dx.doi.org/10.5772/602
- Zheng, Y.F. (2011) Image Fusion and Its Applications. InTech. http://dx.doi.org/10.5772/691
- Mitchell, H.B. (2010) Image Fusion: Theories, Techniques and Applications. Springer, Berlin. http://dx.doi.org/10.1007/978-3-642-11216-4
- Stathaki, T. (2008) Image Fusion: Algorithms and Applications. Academic Press, Elsevier, London Amsterdam Burlington San Diego.
- Hill, P.R., Bull, D.R. and Canagarajah, C.N. (2005) Image Fusion Using a New Framework for Complex Wavelet Transforms. Image Processing, II1338-41.
- Mei, A.L.X., Jin, B.L. and Hui, C.W.S. (2006) New Medical Image Fusion Algorithm Based on Second Generation Wavelet Transform. Proceedings of the International Conference on Computational Engineering in Systems Applications, Beijing, 4-6 October 2006, 1460-1464.
- Shen, Y., Ma, J. and Ma, L. (2006) An Adaptive Pixel-Weighted Image Fusion Algorithm Based on Local Priority for CT and MRI Images. Proceedings of the IEEE Instrumentation and Measurement Technology Conference Sorrento, Sorrento, 24-27 April 2006, 420-422.
- Patnaik, D. (2006) Biomedical Image Fusion Using Wavelet Transforms and SOFM Neural Network. Proceedings of the IEEE International Conference on Industrial Technology, Mumbai, 15-17 December 2006, 1189-1194.
- Zhang, H., Liu, L. and Lin, N. (2007) A Novel Wavelet Medical Image Fusion Method. Proceedings of the International Conference on Multimedia and Ubiquitous Engineering, Seoul, 26-28 April 2007, 548-553.
- Boudraa, A.O. and Zaidi, H. (2006) Image Segmentation Techniques in Nuclear Medicine Imaging. In: Zaidi, H., Ed., Quantitative Analysis in Nuclear Medicine Imaging, Springer, Berlin, 308-357.