Open Journal of Medical Imaging
Vol.4 No.1(2014), Article ID:43540,10 pages DOI:10.4236/ojmi.2014.41002
Registration of Two Dental Panoramic Radiographs
Koichi Ogawa1, Jyunpei Yamamoto1, Masatoshi Yanase1, Akitoshi Katsumata2
1Department of Applied Informatics, Faculty of Science and Engineering, Hosei University, Tokyo, Japan
2Department of Oral Radiology, Asahi University School of Dentistry, Gifu, Japan
Email: ogawa@hosei.ac.jp
Copyright © 2014 by authors and Scientific Research Publishing Inc.
This work is licensed under the Creative Commons Attribution International License (CC BY).
http://creativecommons.org/licenses/by/4.0/


Received 12 December 2013; revised 12 January 2014; accepted 19 January 2014
ABSTRACT
In dental panoramic images, the information on physical changes of alveolar bone or jaw bone is very important to diagnose several diseases. To detect such change, it is useful to compare two panoramic x-ray images acquired at different times. These two images are usually acquired with different conditions in terms of the positioning of the dental arch, and thus these images can be impaired from some geometrical changes related to the scale of the panoramic images and deformation of the teeth and jaw bones. As a result of this, it is very hard to make an accurate registration. To cope with this issue, we developed a dedicated image registration method to match these two images by a newly introduced non-rigid transformation method and registration method using the cross-correlation of localized regions. We evaluated our proposed method with several sets of two images acquired with different geometrical conditions. The material evaluated in this study was a skull phantom. The results of these experiments showed the validity and intrinsic ability of our proposed method in clinical examinations.
Keywords:Dental Panoramic Radiography; Registration; Quantitative Analysis; Temporal Image Processing

1. Introduction
Recently, periodontitis has been studied also as related to cardiac diseases and diabetes mellitus. Thus the treatment of periodontitis is very important in the prophylaxis of several diseases. In the diagnosis of periodontitis, dental panoramic apparatus [1] with a tomosynthesis method [2] [3] is used gradually, because the tomosynthesis method can focus on a specified imaging layer in the dental arch and semi-quantitative analysis of the imaged layer is expected to be realized [4] [5] . This panoramic imaging apparatus would be useful, if we could detect the temporal changes around a tooth in the progression of periodontitis. In the dental diagnosis, the difference between an image photographed several weeks or months earlier and that photographed now yields important information about disease progression. Commonly, if we want to detect some changes between two radiographic images, we make a registration of these two images, and subtract one image from the other one. This is a simple approach that can be applied to most cases in digital subtraction angiography, because the photographic geometries of these images are almost the same between these two images. However, in the case of dental panoramic imaging, the deformation of images is markedly affected by the geometrical conditions between the patient’s head and imaging devices [1] . The reasons for the deformation are as follows: 1) a small tilting and/or rotation of the patient’s head makes a large deformation on panoramic images due to the relatively small distance between the x-ray tube and dental arch, and 2) the rotational speed of the detector and x-ray tube along with the movement of the rotational center makes a deformation of panoramic images in the horizontal axis. As a result, the registration of two images is very hard to accomplish. However, if we can succeed in this task, it can be expected to yield useful information for the dental diagnosis and treatment in terms of progression and prognosis.
For the registration methods in dental radiology, a review paper [6] described several transformations to yield an accurate registration. In these approaches on the registration of dental images, a few isolated teeth are targeted [7] -[12] , while there are very few papers that focused on panoramic images [13] . In the case of panoramic images, we also have to take care of the properties of a panoramic apparatus, such as the rotation speed of the detector and x-ray tube, and the geometrical positioning of the dental arch. So a dedicated algorithm is required for making an accurate registration of two temporal images acquired at different times. The purpose of this study is to develop an accurate registration method of two dental panoramic images acquired at different times and with a different geometry. In the proposed method, we normalized the two images using a non-rigid transformation, and conducted an accurate registration with a cross-correlation method using sub-images. Our method is very simple but reasonably effective without requiring annoying manipulations. This paper described the details of our proposed method and the validity of our proposed method.
2. Materials and Method
2.1. Proposed Method
2.1.1. Global Registration
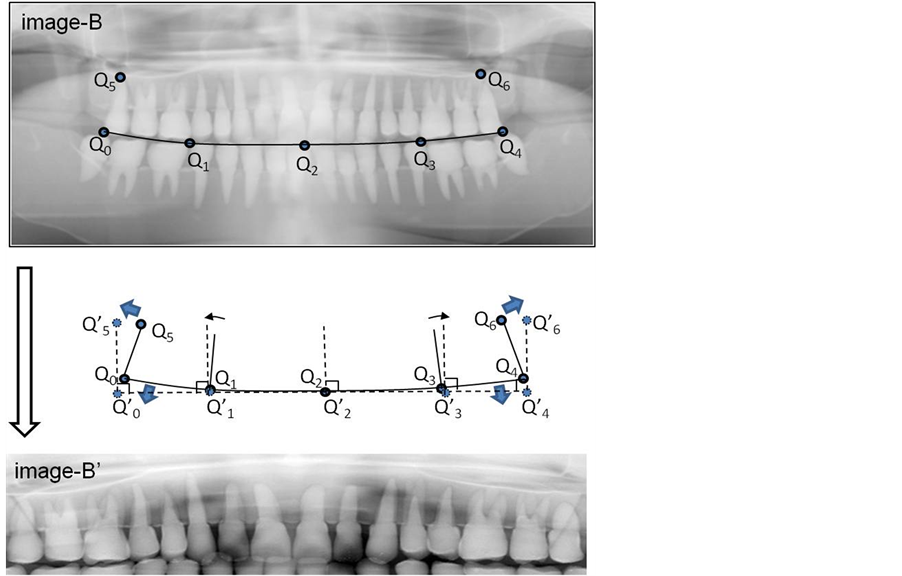
To match two original images (image-A and image-B) acquired at different times, we first select five anchor points along the teeth row on a dental panoramic image (Figures 1 and 2). Because the shape of a teeth row on two images may differ considerably, e.g. in some cases, a patient loses a tooth, and so we manually select these five anchor points. Let us denote selected five points  as shown in Figure 1. In addition, we selected two additional points to improve the accuracy of image registration: P5(x5, y5) and P6(x6, y6). These two points are located at near the root of the mandibular second molars. Then a curve is made by interpolating these five points (P0 ~ P4) with a Lagrange polynomial for two images (image-A and image-B). The Lagrange polynomial is denoted as follows:
 (1)
(1)
And pixel values on this curve through P0(x0, y0) to P4(x4, y4) are mapped on to the straight line through  to
to  on a transformed image (image-A'). Then, pixel values perpendicular to the curve are mapped on to the pixel position perpendicular to the straight line (
 ) on the transformed image-A' using a bilinear interpolation between the neighboring pixels. In the last step, we adjust the processed area (region consisting of the ends of the straight line (
 and
and ) and these two additional points (
 and
and )) so as to form a rectangular shape (


 ) by relocating the pixel value horizontally. The same process is also done on image-B'.
Then, the length of any two points  in image-B' is scaled so as to match the length of the two corresponding points P'iP'i+1 in image-A'. In this scaling, we calculate the scaling ratio of each segmented line
  to
to . The scaling ratios at five points are also interpolated with the Lagrange polynomial as shown in Figure 3. And pixel positions in image-B' are scaled using a ratio of the corresponding position in the Lagrange interpolated curve. The pixel values in image-B' are interpolated using this ratio and re-mapped on to image-B'.
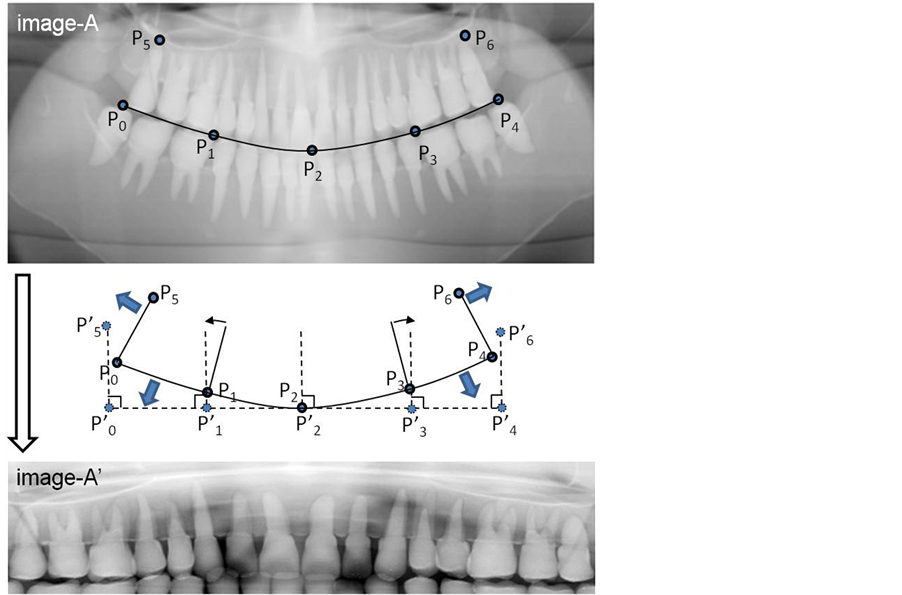
Figure 1. Location of five anchor points and two additional points for image-A. Five anchor points make a curve, and the curve is calculated with the Lagrange polynomial. The curve is mapped on to a straight line and the pixels that are perpendicular to the curve are mapped on to the pixels in a rectangular region consisting of . This transformation makes image-A'.
2.1.2. Local Registration
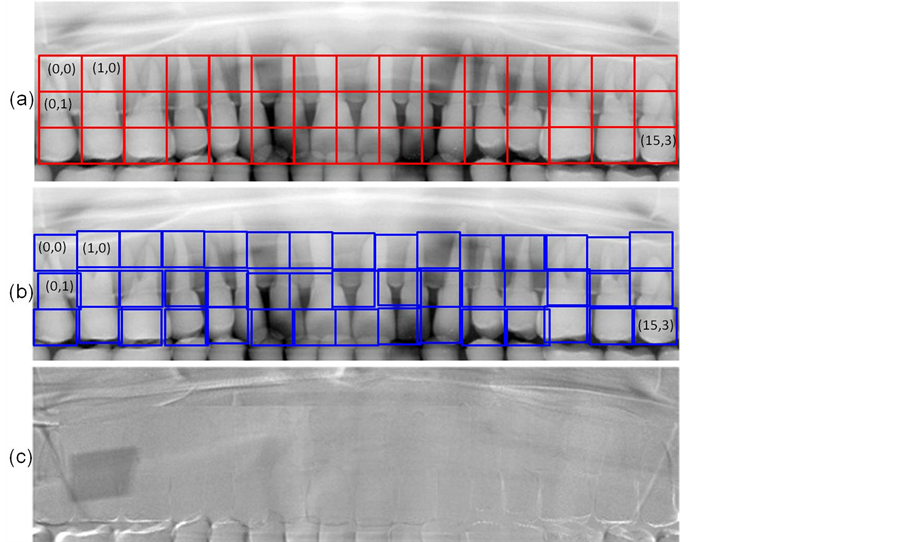
To make an accurate registration between the images (image-A' and image-B'), we divide image-A' into small rectangular regions. The size of a region (N × M) is 100 × 110 pixels (Figure 4(a)). This size of the region corresponds to a size of a tooth. And we calculate the cross-correlation R between a sub-image in image-A' and sub-image in image-B' selected at an arbitrary position with the same size as that in image-A' (denoted as  and
and ) as follows:
 (2)
(2)
where
 (3)
(3)
and
 (4)
(4)
By selecting the position of a sub-image in image-B' where R assumes the largest value, we can roughly match two sub-images. Figure 4(b) shows image-B' and the locations of the corresponding sub-images in image-A' denoted by rectangular regions. After finding the matched position (the center position of the sub-image),
 . This transformation makes image-B'.
 we divide this sub-image in image-A' into smaller rectangular regions such as 50 × 55 pixels. And then we calculate the cross-correlation between a sub-image in image-A' and an arbitrary sub-image with the same size in image-B', and select the position of the largest cross-correlation value again. We repeat this registration process three times with different sizes of a sub-image (the smallest region size is 25 × 28 pixels). After finding the accurate position of the smallest sub-image, we relocated the pixel value of image-B' with the bilinear interpolation method so as to match the sub-images in image-A'.
2.1.3. Difference between Two Images
To detect the difference between two registered images, we calculate the following measure D(i, j) defined at each pixel (i, j):
 (5)
(5)
where Ar(i, j) and Br(i, j) mean the resultant registered images.
The intensity of the image means the integral of -(attenuation coefficient of x-rays) × (path length in an object); thus D(i, j) means the total amount of changes in x-ray attenuation coefficients, because if the registration is perfectly accomplished, the path-length of x-rays should be the same in both images (image-A' and image-B'). The details are shown in the Appendix. Figure 4(c) shows an example of D(i, j) between two panoramic images shown in this example. In the original image, there was a thin copper plate at the right upper jaw in image-B. So a shadow appeared in this place.
2.2. Experimantal Setting
To confirm the validity of our registration method, we acquired several panoramic images with different geome-
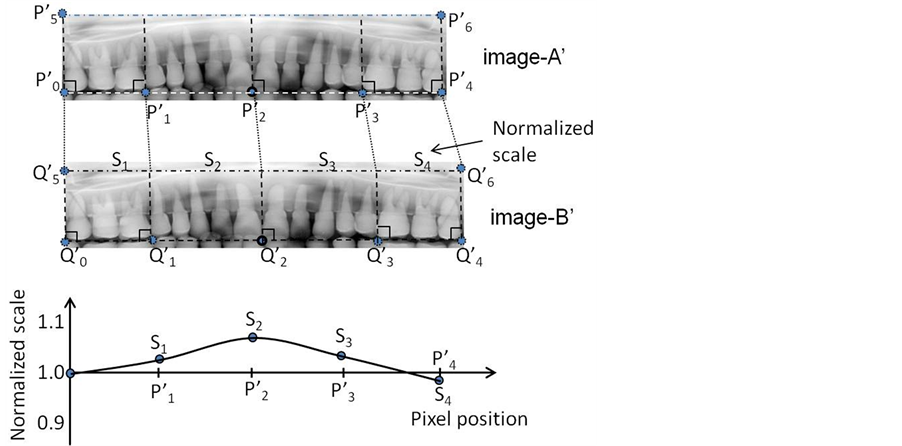
Figure 3. Scaling of transformed images. The scaling is conducted with reference to the five anchor points. First, the scaling ratio is calculated with the length of a line segment for the corresponding position in image-A' and image-B'. Then the position dependent scaling table is calculated with the Lagrange polynomial shown in the bottom. The pixel position in image-B' is rescaled with the position dependent scaling ratio, and pixel values are remapped on to image-B' with a bilinear interpolation.
trical conditions. The dental panoramic apparatus used was QRmaster-P (Telesystems, Osaka, Japan) equipped with a photon counting detector. The tube voltage was 80 kV, and the tube current was 4 mA. The filter used was aluminum with a thickness of 2.5 mm. The distance between the source and the detector was 560 mm. We acquired about 3600 strip images with a size of 50 × 1500 pixels, and made a panoramic image with a size of about 1500 × 3200 pixels using a tomosynthesis method [3] . Data acquisition time was 12 sec.
In this experiment we used a human skull phantom (Kyotokagaku, Kyoto, Japan) shown in Figure 5(a), and photographed it while changing its positioning. The performance of the registration between two images was evaluated with four ROIs set on a resultant image. First we acquired an image at the normal position (image-A) and then the second image (image-B) at a slightly different position in terms of the rotation of the head or tilting of the face. As for the rotation of the head, we rotated the head by 2 or 4 degrees in a left direction, and for the tilting angle we tilted the face 2 or 4 degrees from the initial position of image-A.
To evaluate the accuracy of measurement in terms of the linear attenuation coefficient of a material, we placed a thin aluminum plate with a thickness of 1 ~ 5 mm inside the upper front teeth as shown in Figure 5(b). And we changed the thickness of the aluminum plate and measured the density of the resultant image. In this measurement, we removed the phantom each time from the table on which the phantom had been placed. And we conducted the image registration mentioned above. To calculate the pixel value, we set a region of interest (ROI) with a size of 60 × 60 pixels in the position of the aluminum plates.
3. Results
Figure 6 shows the results of the experiments in terms of the head rotation. Image-A was an image photographed at the initial position and three images (image-B) were photographed at the second time. The three images were acquired without any rotation of the head and with a rotation of 2 or 4 degrees. The difference images are shown in this figure. We set four ROIs (shown in dotted rectangles) in the resultant image and calculated the mean squared error (MSE) and standard deviation (SD). Figure 7 shows the results of the experiments in terms of the face tilting. Image-A was the same as that used in the previous experiment. And three images (image-B) were photographed at the second time. The three images were acquired without any tilting of the face and with an upward tilting of 2 or 4 degrees. The difference images are shown in this figure. Figure 8 shows the shadow of the aluminum plates and the position of the ROI for quantitative analysis. The lower graph shows the relationship between the averaged intensity in the difference image and the thickness of the aluminum plate. In this graph, we added a theoretical curve.
4. Discussion
The image registration of dental panoramic images is very important in the diagnosis of dental diseases, and this technique is also applicable to postmortem investigations. However, the registration of two images is very difficult in usual cases compared to the digital subtraction angiography commonly used in clinical practice, because the shapes of the photographed teeth and jaw bones significantly differ from each other. This is mainly caused by the geometrical photographic conditions in the process of data acquisition. The distance between the targeted regions such as teeth/jaw bones and the x-ray tube is short, and so a small difference in the positioning of a patient’s head makes a large deformation in a panoramic x-ray image. And so a dedicated approach is required for

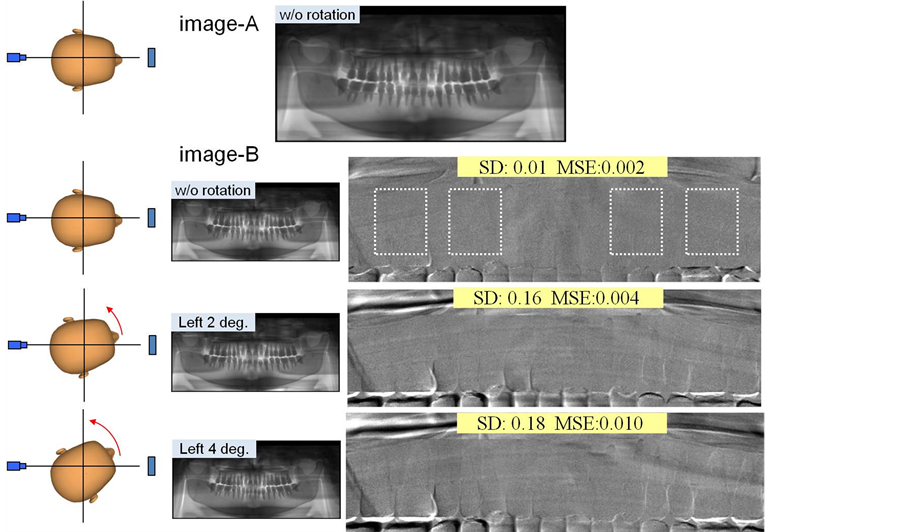
Figure 6. Experimental results in terms of the rotation of the head. We set the head phantom at the initial position (image-A). Then we take off the head phantom and place it on the table, and set-up the phantom again. In this process, we set the phantom without any rotation of the head, and with the rotation by small angles (2 or 4 degrees) in the left direction. Three difference images are shown in the right side of the figure. The accuracy of registration was measured by the mean squared error and standard deviation of four ROIs indicated by dotted rectangles.
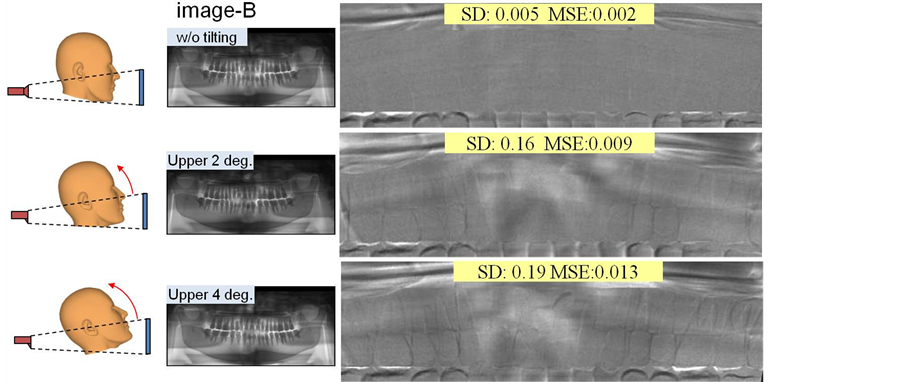
Figure 7. Experimental results in terms of titling of the face. We set the head phantom at the initial position (image-A) shown in Figure 6. Then we take off the head phantom and place it on the table and set-up the phantom again. In this process, we set the phantom without any tilting of the face, and with the tilting by small angles (2 or 4 degrees) in the upper direction. Three difference images are shown in the right side of the figure. The accuracy of registration was measured by the mean squared error and standard deviation of four ROIs shown in Figure 6.
the registration of panoramic x-ray images. Our proposed method consisted of two steps: one is a global registration and the other is local registration. In the process of the former, we used a manual operation to identify the targeted area. The number of teeth may change sometimes, if the interval between the two panoramic x-ray im-
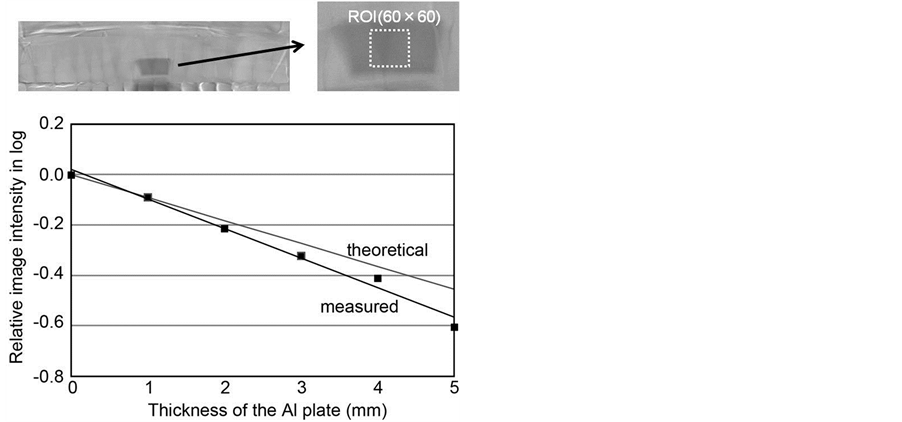
Figure 8. Quantitative evaluation of the registration method. We inserted the aluminum plates with different thicknesses and measured the value of the resultant image. The size of an ROI was 60 × 60 pixels. The measured and theoretical data were compared.
ages is long, and so a full automatic selection of a targeted area may introduce a large registration error. However, the interactive operation in our method requires only the decision of seven positions around the upper or lower teeth, and so this operation is not burdensome to the dentist. In the selection of five anchor points along a teeth row, we need not worry about the accuracy of positioning between two acquisitions, because the curve of a teeth row is used for forming the targeted area approximately, and an accurate registration process is performed in the local registration. To make a well smoothed curve, we used the Lagrange polynomial. In our method, we pay attention to the length of a segmented curve such as . This length may change if the center of the head shifts slightly from the desired position for panoramic imaging. In addition, if the rotation speed of the x-ray tube and detector changes slightly, the length changes. However, the length changes gradually and it depends on the angular position, and so we used the Lagrange polynomial to calculate the position depending on the scaling ratio determined at each angular position. The above transformation improves the accuracy of the registration as a preprocessing step of panoramic x-ray images. In the local registration, we calculated the cross-correlation of sub-images. To increase the registration accuracy, we conducted this processing in three steps with sub-images with different sizes. The results of the experiments showed that if the two images were acquired under ideal conditions, the registration accuracy would be very high as shown in Figure 6. If the head rotated slightly, there were very small differences over all teeth. And the error increased when the rotation angle increased. In this experiment, we evaluated the rotation of the head by 4 degrees, which is an acceptable mis-positioning in a clinical study. For the tilting of the face, our proposed method yielded good results in registration between two images. In this experiment, we evaluated the tilting of the face by 4 degrees. The registration process was successful in this case, although a shadow of the cervical vertebrae appeared in the center of the processed image (Figure 7). We surmised that the path of the x-rays was more sensitive to the cervical vertebrae as compared to the case of rotation of the head. The experiment to quantify the change in different images showed that there was linearity between the intensity change and the thickness of the aluminum plate. However, the error between the measured value and the theoretical one increased as the thickness increased. This is caused by the beam hardening effect of x-rays.
In conclusion, we developed a new method to detect differences between two dental panoramic images acquired at different times. The method consisted of a non-rigid transformation of panoramic images and registration of transformed images in a hierarchical structure. The validity of our method was clarified with the results of experiments using a skull phantom. The results of registration showed that small changes can be detected with the help of difference image.
References
- Langland, O.E., Langlais, R.P., McDavid, M.D. and DelBalso, A.M. (1989) Panoramic Radiology. 2nd Edition, Lea & Febiger, Philadelphia.
- Grant, D.G. (1972) Tomosynthesis: A Three-Dimensional Radiographic Imaging Technique. IEEE Transaction on Biomedical Engineering, 19, 20-28. http://dx.doi.org/10.1109/TBME.1972.324154
- Ogawa, K., Langlais, R.P., McDavid, M.D., Noujeim, M., Seki, K., Okano, T., et al. (2010) Development of a New Dental Panoramic Radiographic System Based on a Tomosynthesis Method. Dentomaxillofacial Radiology, 39, 47-53. http://dx.doi.org/10.1259/dmfr/12999660
- Noujeim, M., Prihoda, T., McDavid, W.D., Ogawa, K., Seki, K., Okano, T., et al. (2011) Pre-Clinical Evaluation of a New Dental Panoramic Radiographic System Based on Tomosynthesis Method. Dentomaxillofacial Radiology, 40, 42-46. http://dx.doi.org/10.1259/dmfr/73312141
- Katsumata, A., Ogawa, K., Inukai, K., Matsuoka, M., Nagano, T., Nagaoka, H., et al. (2011) Initial Evaluation of Linear and Spatially Oriented Planar Images from a New Dental Panoramic System Based on Tomosynthesis. Oral Surgery Oral Medicine Oral Pathology, 112, 375-382. http://dx.doi.org/10.1016/j.tripleo.2011.04.024
- Lehmann, T.M., Groendahl, H.-G. and Benn, D.K. (2000) Computer-Based Registration for Digital Subtraction in Dental Radiology. Dentomaxillofacial Radiology, 29, 323-346. http://dx.doi.org/10.1038/sj.dmfr.4600558
- Yoon, D.C. (2000) A New Method for the Automated Alignment of Dental Radiographs for Digital Subtraction Radiography. Dentomaxillofacial Radiology, 29, 11-19. http://dx.doi.org/10.1038/sj.dmfr.4600487
- Holmes, J.P., Gulabivala, K. and van der Stelt, P.F. (2001) Detection of Simulated Internal Tooth Resorption Using Conventional Radiography and Subtraction Imaging. Dentomaxillofacial Radiology, 30, 249-254. http://dx.doi.org/10.1038/sj.dmfr.4600626
- Dornier, C., Dorsaz-Brossa, L., Thévenaz, P., Casagni, F., Brochut, P., Mombelli, A. and Vallée, J.P. (2004) Geometric Alignment and Chromatic Calibration of Serial Radiographic Images. Dentomaxillofacial Radiology, 33, 220-225. http://dx.doi.org/10.1259/dmfr/71716997
- Zacharaki, E.I., Matsopoulos, G.K., Asvestas, P.A., Nikita, K.S., Groendahl, K. and Groendahl, H.-G. (2004) A Digital Subtraction Radiography Scheme Based on Automatic Multiresolution Registration. Dentomaxillofacial Radiology, 33, 379-390. http://dx.doi.org/10.1259/dmfr/21571843
- Gueneri, P., Gogues, S., Tugsel, Z., Ozturk, A., Gungor, C. and Boyacıoglu, H. (2006) Clinical Efficacy of a New Software Developed for Dental Digital Subtraction Radiography. Dentomaxillofacial Radiology, 35, 417-421. http://dx.doi.org/10.1259/dmfr/21142030
- Carneiro, L.S., Nunes, C.A., Silva, M.A., Leles, C.R. and Mendonca, E.F. (2009) In Vivo Study of Pixel Grey-Measurement in Digital Subtraction Radiography for Monitoring Caries Remineralization. Dentomaxillofacial Radiology, 38, 73-78. http://dx.doi.org/10.1259/dmfr/15857365
- Mekky, N.E., Abou-Chadi, F.E.-Z. and Kishk, S. (2011) A New Hybrid Registration Technique for Dental Panoramic X-Ray Images. Proceedings of IEEE Medical Imaging Conference, 140-145.
Appendix
Let us assume the lengths of a bone and tooth to be lb and lt, and the linear attenuation coefficients of these materials mb and mt, respectively. The intensity of x-rays emitted as I0 changes after passing through these materials is denoted as follows:
 (A-1)
(A-1)
If there was some change in density of the alveolar bone or jaw bone due to periodontitis, the product of mb and lb would change as  and
and . The measured intensity in the panoramic x-ray image at the different time can be denoted as follows:
 (A-2)
(A-2)
If we divide these two equations and take a logarithm, the result becomes as follows:
 (A-2)
(A-2)
This value corresponds to D(i, j) in Equation (5). If the intensity of x-rays changes between two images, this component remains as a bias component in the resultant image. So we can remove this component by subtracting the average value of image D(i, j), and we can detect the difference of two images with this image. The difference image may be expected to be useful as an index in diagnosing periodontitis or osteoporosis.