Open Journal of Medical Imaging
Vol.3 No.4(2013), Article ID:40538,6 pages DOI:10.4236/ojmi.2013.34018
Reduction of the Radiation Dose by Decreasing the Tube Current without Degradation of Low-Contrast Detectability on Abdominal Multi-Detector Row CT: A Phantom-Based Study
Department of Diagnostic Radiology, Cancer Hospital, Chinese Academy of Medical Science, Peking Union Medical College, Beijing, China
Email: huminxia61@hotmail.com, *xinmingzh@sina.com, song8557@sina.com, cjr.zhouchunwu@vip.163.com
Copyright © 2013 Minxia Hu et al. This is an open access article distributed under the Creative Commons Attribution License, which permits unrestricted use, distribution, and reproduction in any medium, provided the original work is properly cited.
Received August 30, 2013; revised September 30, 2013; accepted October 7, 2013
Keywords: Tube Current; Radiation Dose; Computed Tomography; X-Ray; Abdominal Imaging
ABSTRACT
As use of the lowest acceptable radiation dose during routine diagnostic imaging is important, we determined the optimal tube current without degradation of low-contrast detectability on abdominal multi-detector row CT (MDCT). CT scanning was performed with a CatphanÒ 500 phantom. The optimal tube current was 300 mA on 64-MDCT and 160 mA on 8-MDCT, with a fixed voltage of 120 kV. Reduction of the radiation dose in abdominal CT scanning by lowering the tube current proved to be feasible.
1. Introduction
The rapid technological evolution of multi-detector row CT (MDCT) equipment offers significant advantages in diagnostic imaging [1]. Currently, CT scanning contributes over 44% of the global collective dose of ionizing radiation due to medical examinations [2]. In the US, the National Council on Radiation Protection and Measurements (NCRP) reported that the number of CT examinations increased by around 10% per year from 1993 to 2006 [3]. This increase in radiation exposure has become a major topic of concern for patients, especially those with chronic diseases (e.g., liver cirrhosis), who are required to undergo multiple MDCT examinations during follow-up.
Reduction of radiation dose on abdominal CT is determined by the adjustment of multiple parameters, which includes tube current, tube voltage, helical pitch, and exposure time, etc. Lowering the tube current or tube voltage is considered to be the most direct way of achieving a reduction of the radiation dose. Various objective measurable criteria were used to assess the image quality of CT scans in previous dose-reduction researches. Quantum noise is the most frequently used criterion, although image noise alone is a poor representative of image quality [4]. The contrast-to-noise ratio (CNR) is considered to be more closely related to image quality than noise alone. Siegel et al. showed that a dose reduction could be achieved for enhanced pediatric CT by lowering the tube voltage with no loss of CNR, as the iodine contrast increased at lower energy [5]. It proved useful for vascular studies. However, the increased image noise caused by lowering tube voltage led to detectability degradation in small lesions on routine CT in abdominal organs such as the liver, spleen, pancreas and kidneys. Low-contrast detectability (LCD) is an advantageous subjective measurable criterion in dose-reduction research. Previous studies have proven that image quality in abdominal CT scans is closely related to the evaluation of LCD [6]. Whether an enhanced series or not, LCD can be useful in assessment of soft tissue contrast because of the slight contrast between normal and abnormal tissue in routine abdominal CT [7].
LCD in abdominal CT imaging can, however, be degraded by efforts to reduce the radiation dose [8]. The purpose of this study was to reduce the radiation dose on abdominal CT without degradation of LCD by optimizing tube current-time product settings.
2. Materials and Methods
2.1. Phantom for Evaluation of LCD
LCD was assessed with a CatphanÒ 500 phantom (Phantom Laboratory Inc., Cambridge, NY). The diameter and the length along the z-axis of the phantom were both 20.0 cm. Several cylindrical low-contrast objects were arranged in a circle in the low-contrast CTP515 module of the phantom. The cylinders varied in diameter, i.e., 2, 3, 4, 5, 6, 7, 8, 9 and 15 mm. The cylinders are made of 3 different contrast materials that provide uniform background and contrast levels of 0.3%, 1.5%, and 1%, respectively. The phantom is surrounded by a 30 cm diameter annulus which consists of acrylic to mimic attenuation during abdominal imaging. The diameter and the length along the z-axis of the acrylic body annulus were 30.0 cm and 20.0 cm, respectively [9].
Objects of 6, 7, 8, 9 and 15 mm in diameter with a contrast-difference level of 1.0% were used for visual evaluation of LCD. The length of the low-contrast objects was 40 mm. The phantom was mounted on its case and placed in the isocenter of the gantry end of the table with the box hinges away from the gantry for scanning.
2.2. CT Scanning
64- and 8-MDCT scanners (GE LightSpeed VCT and GE LightSpeed Ultra; GE Medical Systems) were used in the study. The parameters for the examination protocol used in phantom scanning on 64-MDCT were: detector configuration of 0.625 (detector collimation) ´ 64 (detectors); reconstruction section thickness of 5.0 mm; reconstruction section interval of 5.0 mm; rotation time of 0.6 second; pitch of 0.984; scan field view of 50.0 cm; display field view of 36.0 cm; and pixel matrix size of 512 × 512. The tube currents were 380 (which was recommended by the manufacturer for standard abdominal CT on 64- MDCT), 340, 300, and 260 mA, with a fixed tube voltage of 120 kV. The parameters for the examination protocol used in phantom scanning on 8-MDCT were: detector configuration of 1.25 (detector collimation) ´ 8 (detectors); reconstruction section thickness of 5.0 mm; reconstruction section interval of 5.0 mm; rotation time of 0.6 second; pitch of 0.875; scan field view of 50.0 cm; display field view of 36.0 cm; and pixel matrix size of 512 × 512. The tube currents were 240 (which was recommended by the manufacturer for standard abdominal CT on 8-MDCT), 200, 160 and 120 mA, with a fixed tube voltage of 120 kV.
2.3. CT Dose Measurements
The radiation dose (mGy) was precisely defined by the dedicated quantities volume CT dose index (CTDIVOL). This metric estimates the average dose within the scan volume. CTDIVOL was provided by the equipment user interface and was recorded for every exposure condition.
2.4. Image Quality
Visual evaluation of low-contrast detectability: Low-contrast objects of 8, 9 and 15 mm in diameter with a contrast level of 1.0% were used to evaluate LCD. The visual tests were performed in 3 adjacent images to check longitudinal uniformity and the tests were repeated 3 times on each image. Each object was scored on a scale of 1 - 5 by the observers: a score of 5.0 was assigned when the object was visible and appeared as a perfect circle; a score of 4.0 was assigned when 1/2 to 3/4 of the object’s margin was visible and the diameter of the object was measurable; a score of 3.0 was assigned when over 1/2 of the object’s margin was not clear and the diameter of the object was not measurable; a score of 2.0 was assigned when the object was not obviously visible; and a score of 1.0 was assigned when the object could not be depicted. The images were presented in a random order and evaluated by a panel of 3 different radiologists (2 senior with 15 years of experience, and 1 junior with 5 years of experience in our department) who had undertaken training with 5 representative cases that were not part of the visual test. Our institutional review board approved the participation of these radiologists in the study, and informed consent was obtained from all observers.
All images were displayed with the same zoom and level/window settings (55/70 HU), and were reviewed independently in a blinded manner (i.e., without any acquisition parameters visible on the images). The scores obtained from the radiologists were averaged to limit the visual sensitivity and subjectivity of the individual observers. A 3-level scale was used to grade the visibility of each object. Each assessment of the visibility for each object was considered to be excellent when its mean score was 4.0 or higher (i.e., grade 1); acceptable when its mean score was 3.0 or higher but less than 4.0 (i.e., grade 2); and unacceptable when its score was less than 3.0 (i.e., grade 3).
Contrast-to-noise ratio (CNR) and standard deviation (SD) measurements: We measured the CT numbers of the low-contrast objects in a 15 mm diameter area and the background of phantom by using same size circular region-of-interest (ROI) cursor. CNRs were obtained as follows: CNR = (ROIm − ROIb)/SDb, where ROIm and ROIb are the CT numbers of the 15 mm diameter objects and the background nearby, respectively, and SDb is the standard deviation of the pixel values of the background. For measurements of the objects, the ROIs were placed in the center of the 15 mm diameter objects and the diameters were approximately 75% (i.e., 12 mm) of the diameter of the objects. For the background measurements, the ROIs were placed near the objects. The measurements were performed in 3 adjacent images to check longitudinal uniformity and were repeated 3 times on each image, giving 9 measurements for each set of acquisition conditions. The mean value of CNRs (CNRm) was calculated for each set of acquisition conditions. All ROI positionings and CNR calculations were performed by the same investigator.
2.5. Statistical Analysis
Data were analyzed statistically with SPSS 13.0 software. Interobserver agreement was measured by Kappa statistic analysis. The Kruskal-Wallis test was used to examine differences in the overall grades recorded by the observers. If there was a significant difference among all sets of acquisition conditions, a Mann-Whitney test was used for pair-wise comparisons. Person correlation analysis was used to test the relation between CNRm value and the radiation dose for each set of acquisition conditions. For all studies, the difference was considered significant when the P value was <0.05.
3. Results
3.1. Interobserver Agreement
The k values obtained in the Kappa test for 64-MDCT were 0.786, 0.758, and 0.773 with an average of 0.772, and for 8-MDCT were 0.746, 0.789, and 0.723 with an average of 0.752, indicating substantial agreement between the observers. This allowed averaging the radiologists’ visual scores to limit the visual sensitivity and subjectivity of individual observers.
3.2. Visual Evaluation of LCD
The low-contrast objects of 6, 7, 8, 9 and 15 mm in diameter with a contrast level of 1.0% in the CatphanÒ 500 phantom were used to evaluate LCD (Figure 1). Scores (mean ± SD) for each set of acquisition conditions on 64-MDCT and 8-MDCT are shown in Tables 1 and 2, respectively. Overall differences in grades recorded by the 3 observers were significant on both 64-MDCT (c2 = 20.754; P = 0.002) and 8-MDCT (c2 = 30.215; P < 0.001). A Mann-Whitney test was then used to compare grades in the groups with different tube current-time product conditions. For 64-MDCT, there were no significant differences in the grades between the 380 mA group and 340 or 300 mA group (Z = −1.957 and −1.357; P = 0.089 and 0.169), while a statistically difference between the 380 mA group and the 260 mA group (Z = −2.334; P = 0.01) was found. The optimal tube-current time product on 64-MDCT was determined to 300 mA. For 8-MDCT, there were no significant differences in the grades between the 240 mA group and 200 or 160 mA group (Z =
−2.042 and −1.654; P = 0.064 and 0.098), whereas there was a significant difference between the 240 mA group and the 120 mA group (Z = 2.386; P = 0.017). The optimal tube-current time product on 8-MDCT was determined to 160 mA.
3.3. CNR Results
There was a direct correlation between the CNRm value
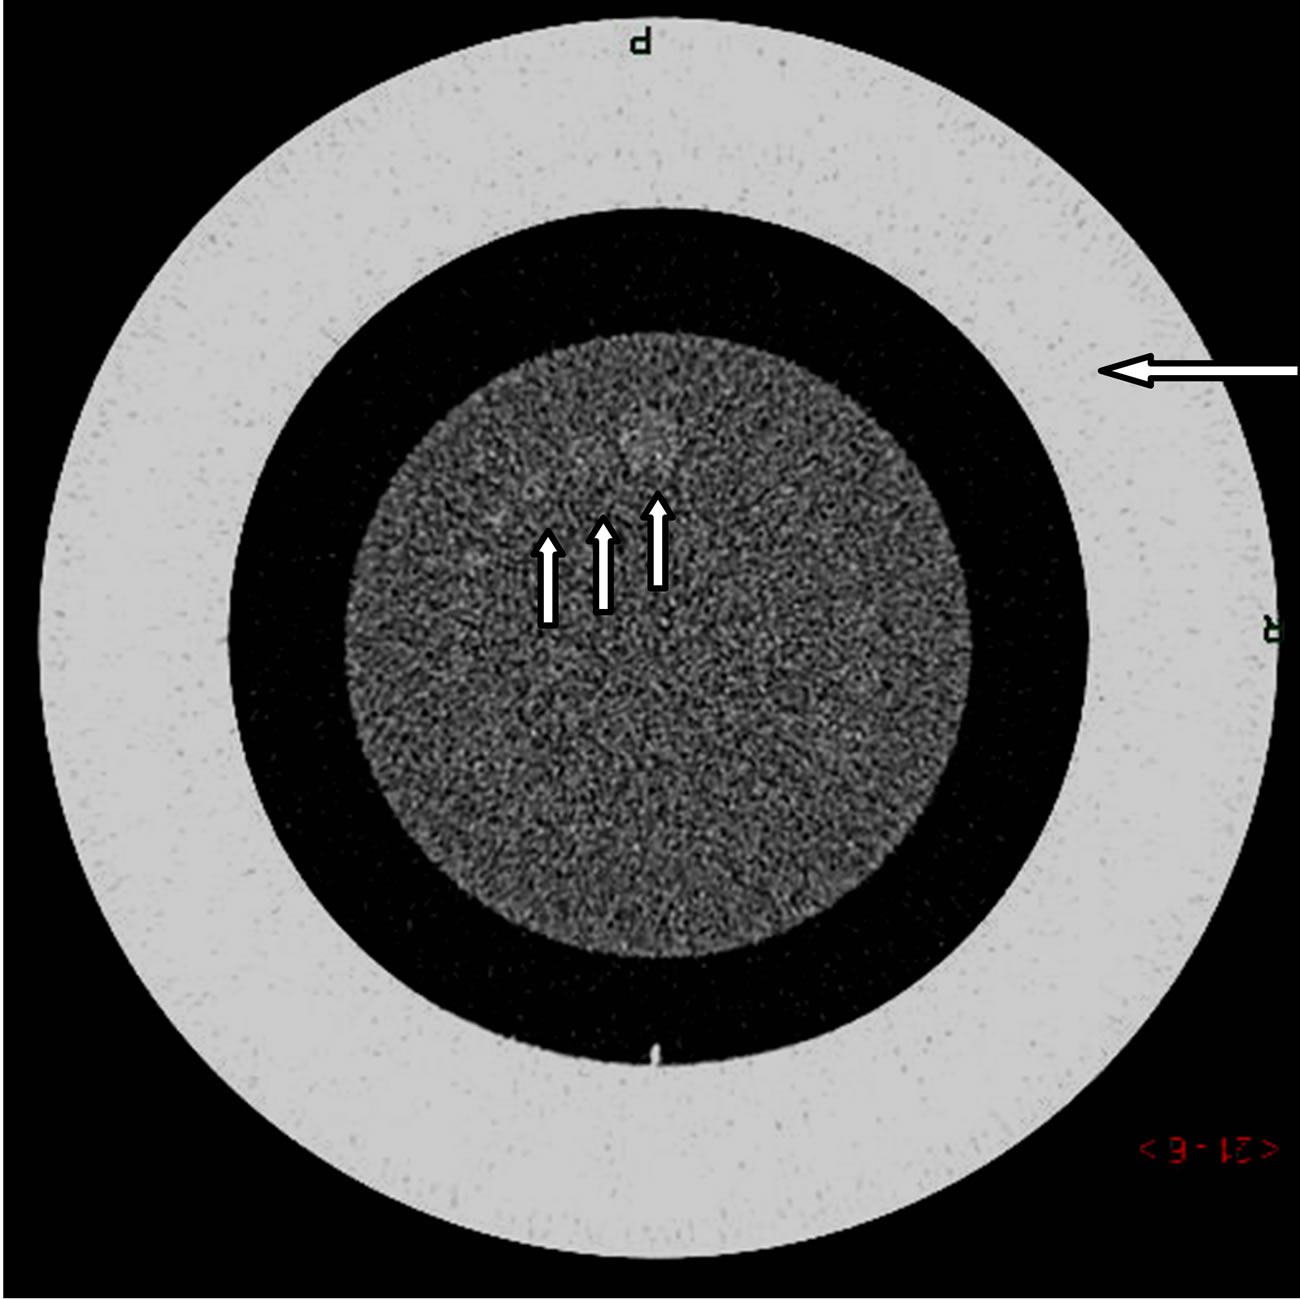
Figure 1. CT image of the phantom surrounded by a 30 cm diameter body annulus (long arrow). Low-contrast objects of 8, 9 and 15.0 mm in diameter with a contrast difference of 1.0% were used to evaluate low-contrast detectability (short arrow).
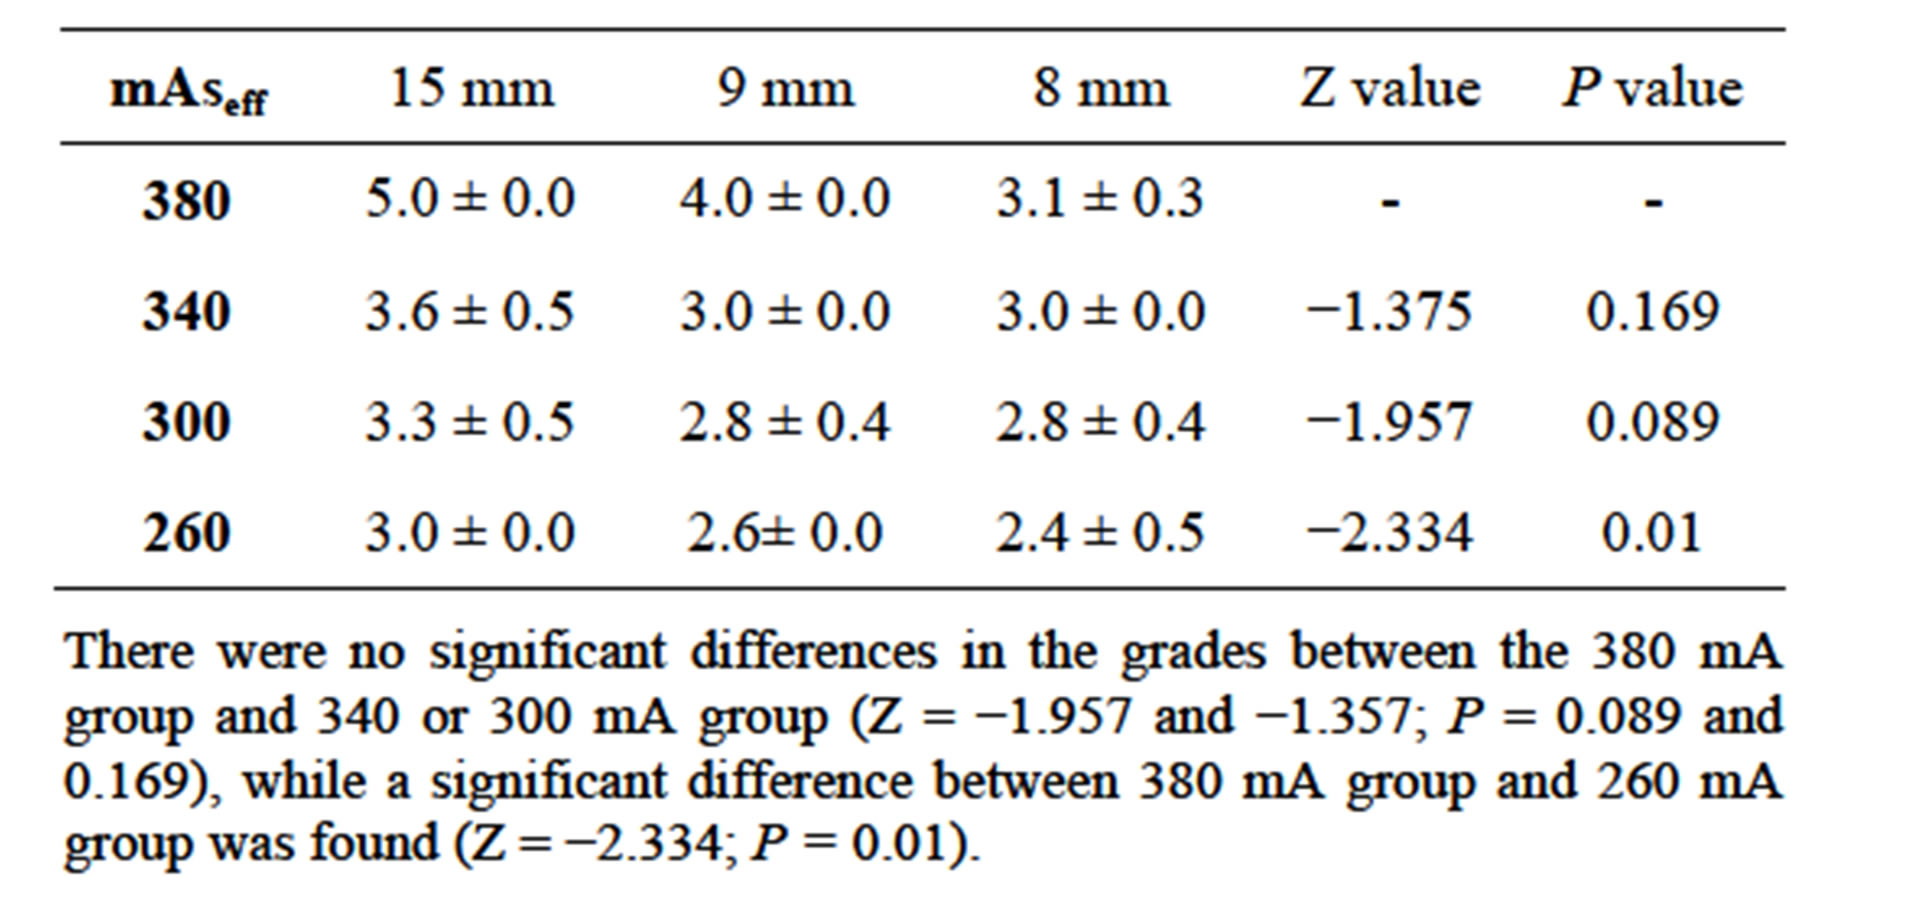
Table 1. Scores for low-contrast objects of 8, 9, and 15 mm in diameter at different tube current-time product conditions on 64-MDCT.
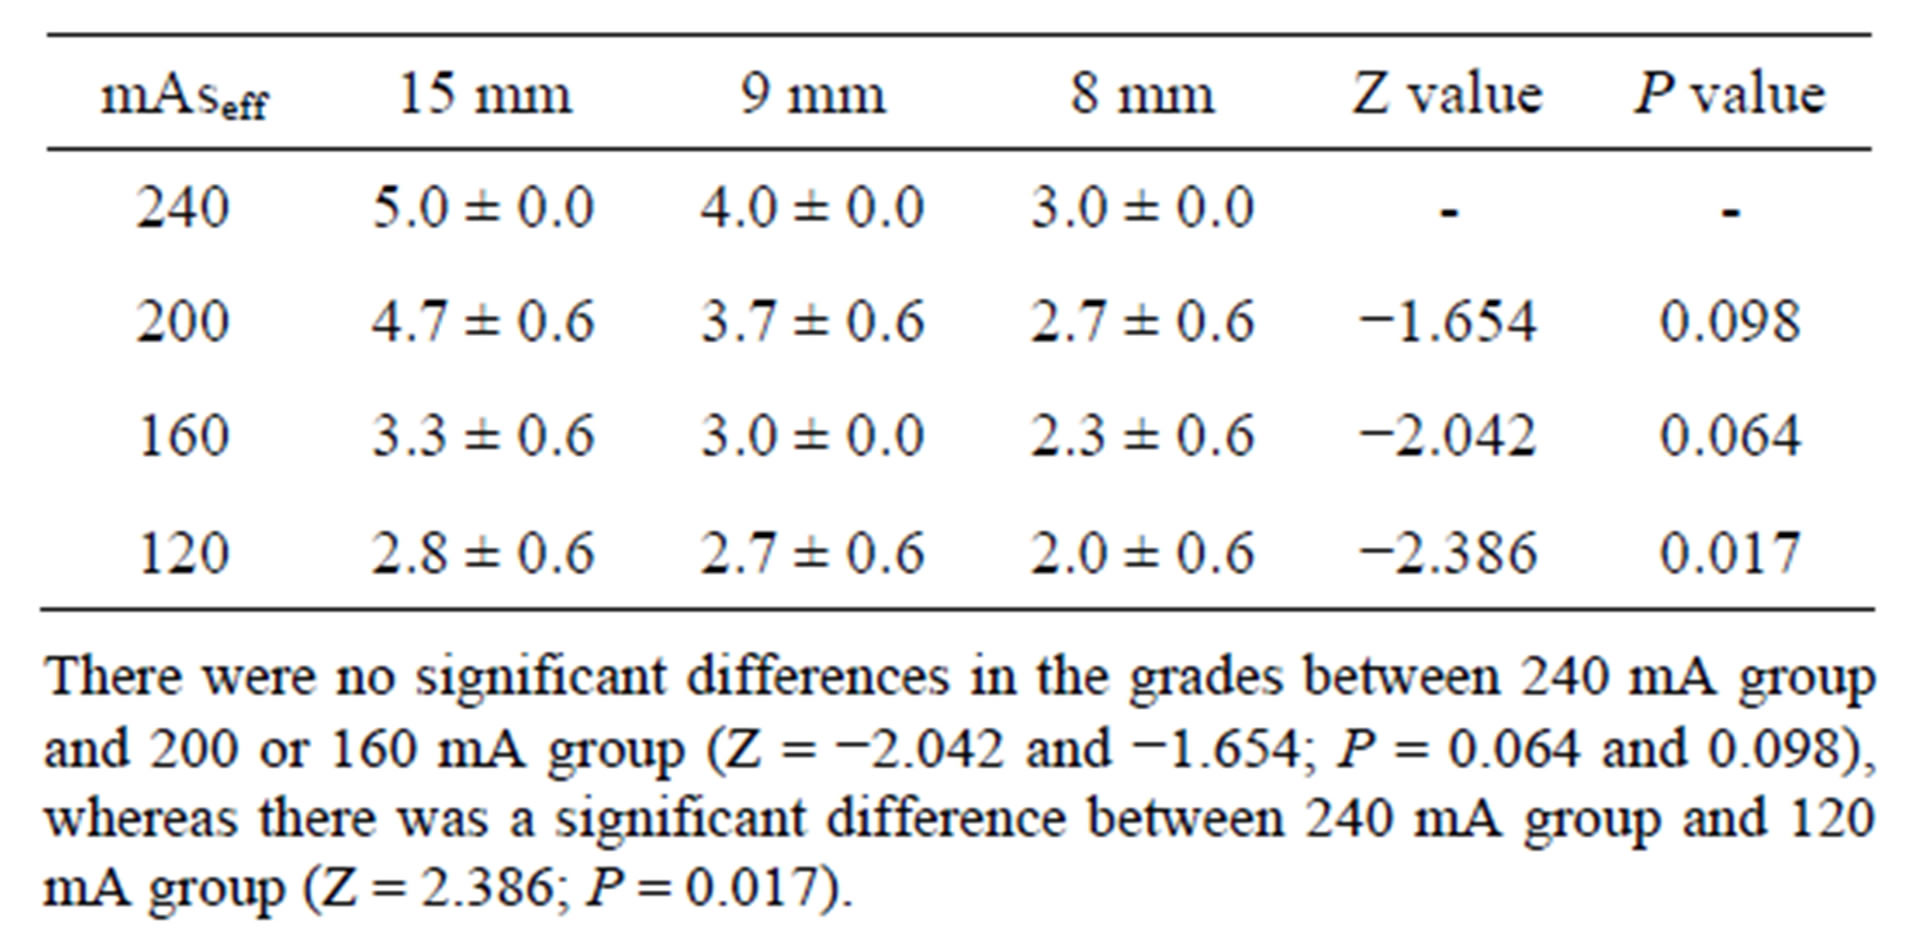
Table 2. Scores for low-contrast objects of 8, 9, 15 mm in diameter at different tube current-time product conditions on 8-MDCT.
and the radiation dose obtained in the CT examinations performed on both 8-MDCT and 64-MDCT. The Pearson correlation coefficient (r) and the corresponding P values were r = 0.99 and P < 0.001 on 64-MDCT, and r = 0.97 and P < 0.001 on 8-MDCT, respectively (Table 3).
3.4. Radiation Dose
Volume CT dose index (CTDIVOL) was used to represent radiation doses. CTDIVOL values for CT examinations performed with different effective tube current-time product conditions on 64-MDCT or 8-MDCT provided by the manufacturer are summarized in Tables 1 and 2, respectively. Compared with the tube current-time product recommended by the manufacturer for standard abdominal CT, there was a 21.1% reduction (from 19.15 to 15.10 mGy) in the radiation dose for the optimal tube current-time product on 64-MDCT, and a 32.50% reduction (from 20.61 to 13.91 mGy) in the radiation dose for the optimal tube current-time product on 8-MDCT.
4. Discussion
The present study was designed to determinate the maximum degree of reduction in radiation dose owing to optimized tube current setting on 8 and 64-abdominal MDCT. It suggested that a dose reduction of 21.2% and 32.5% on 8 and 64-abdominal MDCT could be achieved in the study.
Determination of the appropriate indicators for image quality evaluation is an important but challenging issue in the optimization of CT scan parameters. Objective evaluation indicators for image quality include mainly noise and the contrast-to-noise ratio (CNR). Studies of enhanced abdominal CT scans have shown that reduction of the tube voltage resulted in a decrease in X-ray photon energy, which was closer to elements with a high atomic number such as the iodine in contrast agents [10]. This led to an enhanced photoelectric effect, accelerated X-ray attenuation, and increased CT values. However, a decrease of the tube voltage can lead to a significant increase in noise, and thus interfere with observation of the target of interest. Even if the CNR value is not altered, the image quality still can be degraded due to the increased noise [8]. Therefore, objective indicators should not be the only criteria for evaluation of image quality, and they should be combined with subjective evaluation of the images when optimizing CT scan parameters. Abdominal organs have a relatively low soft tissue contrast in which the difference of contrast CT values between liver lesions and normal liver tissue is reported about 5 to 40 HU [7]. The LCD of abdominal organs is obtained from subjective observation and evaluation, which was supposed be useful in the optimization of abdominal CT scan parameters [8]. Based on the evidences mentioned above, the present study employed LCD with 1% contrast level (i.e., the difference of CT values between cylindrical low-contrast object and background is 10 HU) which was considered closely similar to contrast between the abdominal lesions and normal tissues.
Adjustments of the tube voltage, tube current, and exposure time are common strategies to reduce the radiation dose in CT scanning. Reduction of the tube voltage leads to an increased attenuation of calcified structures and iodinated contrast material, as the photoelectric effect increases and Compton scattering decreases [10]. This is useful for maintaining the contrast-to-noise ratio (CNR) because of the number of CT regions enhanced with iodinated contrast material by the low tube voltage applied in abdominal CT scans, particularly in dynamic CT examinations and vascular studies [5]. Increased image noise caused by lowering the tube voltage leads to detectability degradation in small lesions on routine CT of abdominal organs such as the liver, spleen, pancreas or kidneys. We suggest that if the tube voltage is reduced from 120 kV to 80 kV, a 4-fold increase of the tube current is needed to maintain the same noise level of the image [11]. Hence, reduction of the tube voltage is associated with a significant increase of the tube current to maintain the image quality. Furthermore, modification of tube voltage was used less frequently as the selections are limited. Therefore, adjustment of tube current is more widely used for dose reductions [12]. Several studies on radiation dose reduction by modifying the tube current have shown that it was acceptable to apply low-dose unenhanced abdominal CT scans for the patients with acute abdominal diseases such as urinary tract stones [13,14].
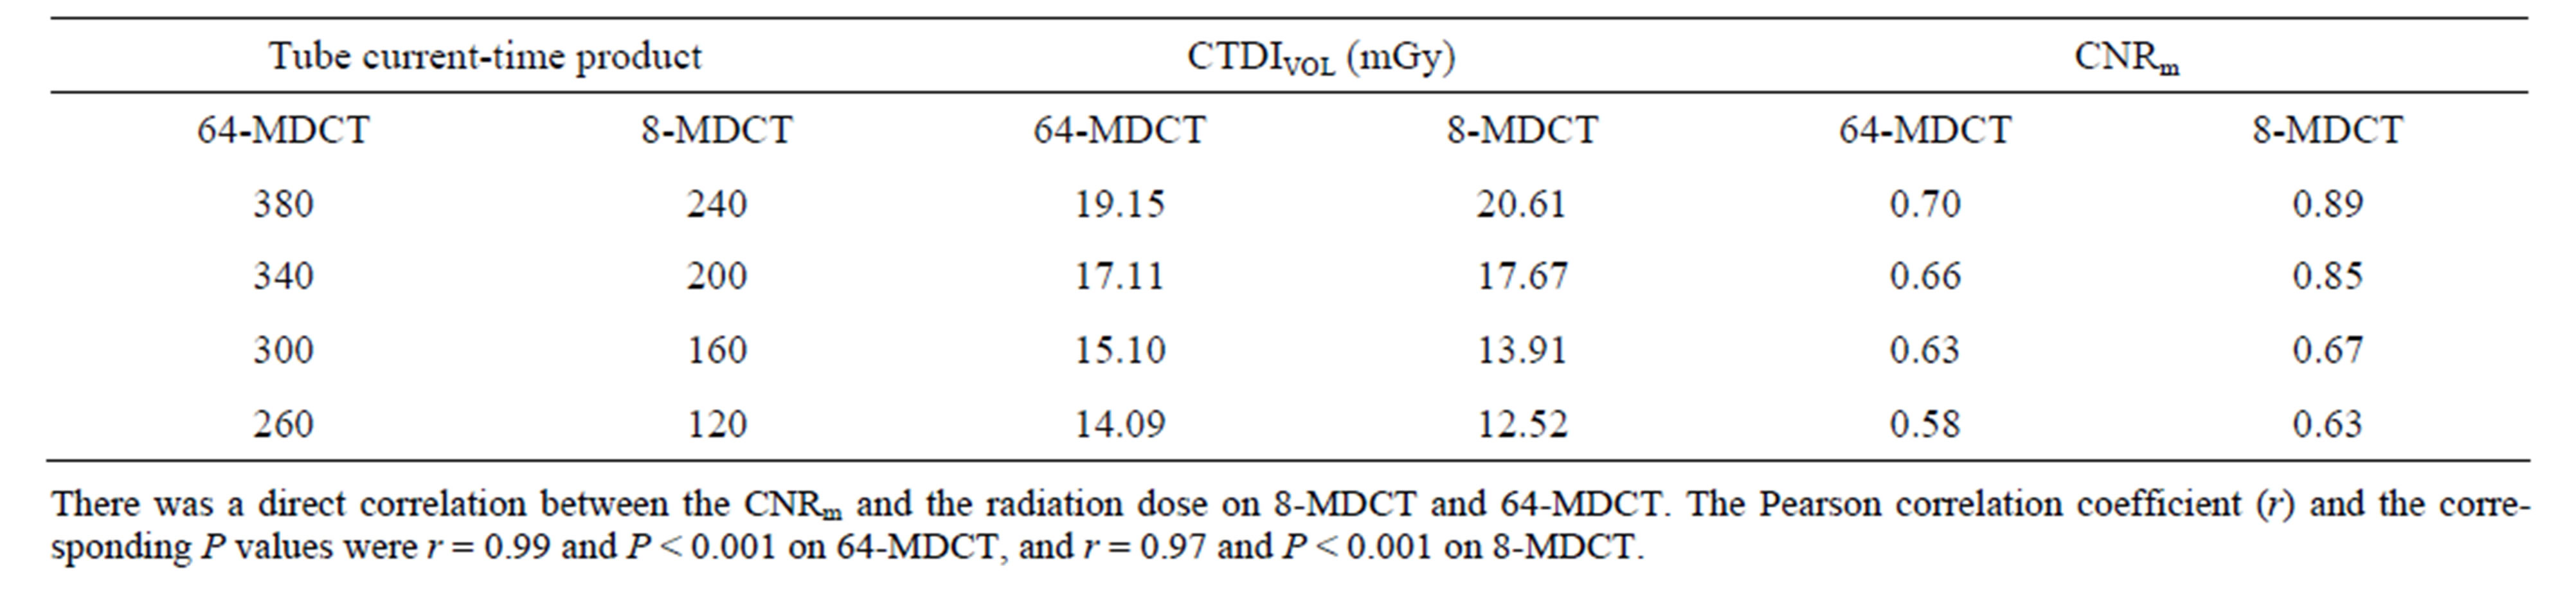
Table 3. Radiation dose and CNRm at different tube current-time product conditions on 64-MDCT and 8-MDCT.
The present study concluded that decreasing tube current is feasible and practical in radiation reduction process, as varying degree in reduction of radiation dose were obtained in 8 and 64-MDCT, indicated dose reduction of 21.1% and 32.5%, respectively. The radiation dose related to the optimized tube current setting for 8 and 64-MDCT (i.e., 160 and 300 mA ) were 13.91 and 15.10 mGy respectively, which were 55.6% and 60.4% of the value (25 mGy) recommended by Radiological Society of North America [15-17].
Our study had several limitations. Firstly, the phantom was made of materials of uniform density, whereas human tissues exhibit different densities, and optimized parameters with the phantom may not apply well to CT scans of the human abdomen. Secondly, to account for significant difference among individuals, reasonable scan parameters should be a series of ranges, rather than a list of fixed values. However, the findings of this phantombased study provide the basis for further clinical evaluation and for establishment of optimal ranges of CT scan parameters in clinical practice.
In conclusion, a reduction of the radiation dose in abdominal CT scanning by lowering the tube current is proved to be feasible in the present study. The optimal tube currents were determined to be 300 mA on 64- MDCT and 160 mA on 8-MDCT, with a fixed voltage of 120 kV, which can lead to a 21.1% and 32.5% reduction in the radiation dose without degradation of image quality on abdominal CT scanning.
REFERENCES
- W. Kalender, “Computed Tomography: Fundamentals, System Technology, Image Quality, Applications,” Publicis MCD Verlag, Munich, 2000.
- UNSCEAR United Nations Scientific Committee on the Effects of Atomic Radiation, “Sources and Effects of Ionizing Radiation. Report to the General Assembly with Scientific Annexes,” Vol. I, UNSCEAR, New York, 2010.
- National Council on Radiation Protection and Measurements, “Ionizing Radiation Exposure of the Population of the United States,” Report No. 160. NCRP, Bethesda, 2009.
- S. T. Schindera, R. C. Nelson, T. L. Toth, G. T. Nguyen, G. I. Toncheva, D. M. DeLong and T. T. Yoshizumi, “Effect of Patient Size on Radiation Dose for Abdominal MDCT with Automatic Tube Current Modulation: Phantom Study,” American Journal of Roentgenology, Vol. 190, No. 2, 2008, pp. W100-W105. http://dx.doi.org/10.2214/AJR.07.2891
- M. J. Siegel, B. Schmidt, D. Bradley, C. Suess and C. Hildebolt, “Radiation Dose and Image Quality in Pediatric CT: Effect of Technical Factors and Phantom Size and Shape,” Radiology, Vol. 233, No. 2, 2004, pp. 515-522. http://dx.doi.org/10.1148/radiol.2332032107
- Y. Nakayama, K. Awai, Y. Funama, M. Hatemura, M. Imuta, T. Nakaura, D. Ryu, S. Morishita, S. Sultana, N. Sato and Y. Yamashita, “Abdominal CT with Low Tube Voltage: Preliminary Observations about Radiation Dose, Contrast Enhancement, Image Quality, and Noise,” Radiology, Vol. 237, No. 3, 2005, pp. 945-951. http://dx.doi.org/10.1148/radiol.2373041655
- K. Awai, K. Takada, H. Onishi and S. Hori, “Aortic and Hepatic Enhancement and Tumor-to-Liver Contrast: Analysis of the Effect of Different Concentrations of Contrast Material at Multi-Detector Row Helical CT,” Radiology, Vol. 224, No. 3, 2002, pp. 757-763. http://dx.doi.org/10.1148/radiol.2243011188
- H. J. Brisse, J. Brenot, N. Pierrat, G. Gaboriaud, A. Savignoni, Y. De Rycke, S. Neuenschwander, B. Aubert and J. C. Rosenwald, “The Relevance of Image Quality Indices for Dose Optimization in Abdominal Multi-Detector Row CT in Children: Experimental Assessment with Pediatric Phantoms,” Physics in Medicine and Biology, Vol. 54, No. 7, 2009, pp. 1871-1892. http://dx.doi.org/10.1088/0031-9155/54/7/002
- Y. Funama, K. Awai, Y. Nakayama, K. Kakei, N. Nagasue, M. Shimamura, N. Sato, S. Sultana, S. Morishita and Y. Yamashita, “Radiation Dose Reduction without Degradation of Low-Contrast Detectability at Abdominal Multisection CT with a Low-Tube Voltage Technique: Phantom study,” Radiology, Vol. 237, No. 3, 2005, pp. 905- 910. http://dx.doi.org/10.1148/radiol.2373041643
- S. P. Kalva, D. V. Sahani, P. F. Hahn, et al., “Using the K-Edge to Improve Contrast Conspicuity and to Lower Radiation Dose with a 16-MDCT: A Phantom and Human Study,” Journal of Computer Assisted Tomography, Vol. 30, No. 3, 2006, pp. 391-397. http://dx.doi.org/10.1097/00004728-200605000-00008
- U. Nyman, T. L. Ahl, M. Kristiansson, L. Nilsson and S. Wettemark, “Patient-Circumference-Adapted Dose Regulation in Body Computed Tomography. A Practical and Flexible Formula,” Acta Radiologica, Vol. 46, No. 4, 2005, pp. 396-406. http://dx.doi.org/10.1080/02841850510021193
- T. Kubo, P. J. Lin, W. Stiller, M. Takahashi, H. U. Kauczor, Y. Ohno and H. Hatabu, “Radiation Dose Reduction in Chest CT: A Review,” American Journal of Roentgenology, Vol. 190, No. 2, 2008, pp. 335-343. http://dx.doi.org/10.2214/AJR.07.2556
- A. L. Spielmann, J. P. Heneghan, L. J. Lee, T. Yoshizumi and R. C. Nelson, “Decreasing the Radiation Dose for Renal Stone CT: A Feasibility Study of Singleand Multidetector CT,” American Journal of Roentgenology, Vol. 178, No. 5, 2002, pp. 1058-1062. http://dx.doi.org/10.2214/ajr.178.5.1781058
- M. Hamm, E. Knopfle, S. Wartenberg, F. Wawroschek, D. Weckermann and R. Harzmann, “Low Dose Unenhanced Helical Computerized Tomography for the Evaluation of Acute Flank Pain,” Journal of Urology, Vol. 167, No. 4, 2002, pp. 1687-1691. http://dx.doi.org/10.1016/S0022-5347(05)65178-6
- C. McCollough, T. Branham, V. Herlihy, M. Bhargavan, L. Robbins, K. Bush, M. McNitt-Gray, J. T. Payne, T. Ruckdeschel, D. Pfeiffer, D. Cody and R. Zeman, “Diagnostic Reference Levels from the ACR CT Accreditation Program,” Journal of the American College of Radiology, Vol. 8, No. 11, 2011, pp. 795-803. http://dx.doi.org/10.1016/j.jacr.2011.03.014
- H. Greess, H. Wolf, U. Baum, M. Lell, M. Pirkl, W. Kalender and W. A. Bautz, “Dose Reduction in Computed Tomography by Attenuation-Based On-Line Modulation of the Tube Current: Evaluation of Six Anatomical Regions,” European Radiology, Vol. 10, No. 2, 2000, pp. 391-394. http://dx.doi.org/10.1007/s003300050062
- M. K. Kalra, S. Prasad, S. Saini, M. A. Blake, J. Varghese, E. F. Halpern, J. H. Thrall and J. T. Rhea, “Clinical Comparison of Standard-Dose and 50% Reduced-Dose Abdominal CT: Effect on Image Quality,” American Journal of Roentgenology, Vol. 179, No. 5, 2002, pp. 1101-1106. http://dx.doi.org/10.2214/ajr.179.5.1791101
NOTES
*Corresponding author.