Natural Resources
Vol.5 No.7(2014), Article ID:45659,10 pages DOI:10.4236/nr.2014.57026
Signal Coordination for Saving Energy and Reducing Congestion Using TRANSYT-7F Model and Its Application in Gaza City
Essam H. Almasri
Civil Engineering Department, Islamic University of Gaza, Gaza, Palestine
Email: emasry@iugaza.mail.edu.ps
Copyright © 2014 by author and Scientific Research Publishing Inc.
This work is licensed under the Creative Commons Attribution International License (CC BY).
http://creativecommons.org/licenses/by/4.0/


Received 2 March 2014; revised 9 April 2014; accepted 22 April 2014
ABSTRACT
Transportation consumes for about 27% of total energy. Almost 100% of the energy used for propelling transport vehicles is derived from petroleum resources. In Gaza Strip and West Bank, transportation consumes about 60% of the total amount of imported fuel. The traffic congestion has a negative impact significantly on the environment because of the increased amount of fuel consumption and thus emissions of pollutants from vehicles. Serious traffic congestion is concentrated in the middle part of Gaza City, especially in major arterial roads such as Eljalaa Road. The congestion comes into view clearly in the segment of the street which consists of 5 consecutive signalized intersections. What makes the congestion even worse is the non-efficient traffic signal control; where each intersection is treated in isolation. The key solution to reduce the congestion and to save energy is to use signal coordination. Therefore, this study aims to redesign and coordinate the traffic signals along Eljalaa road using TRANSYT-7F Model. It aims also to compare between the traffic performance and the fuel consumption of the coordinated signals and the existing uncoordinated ones. The analysis and design are based on geometric data and manual traffic count. The results of comparison show a remarkable improvement of the traffic performance and energy saving of the studied area. There was a reduction of travel time, delay, stops and fuel consumption by 44%, 56%, 25% and 31% respectively. The level of service has been improved from F to D. Thus, it is recommended that signal coordination should be carried out at all arterial roads in Gaza city.
Keywords:Energy Saving, Congestion, Signal Coordination, TRANSYT-7F

1. Introduction
Transportation consumes for about 27% of total energy. Almost 100% of the energy used for propelling transport vehicles is derived from petroleum resources. Over 50% of all petroleum products consumed in the United States are for transportation purposes [1] . In Gaza Strip and West Bank, transportation consumes about 60% of the total amount of imported fuel [2] .
This study focuses on the center of the city of Gaza as a case study. Gaza is the largest governorate in the Gaza Strip, which has five governorates namely Gaza, Khan-Younis, Rafah, Middle and North. Gaza Strip has an area of 365 km2. It is a narrow coastal strip of land with a length of 40 km along the Mediterranean Sea in the northwest direction. It has 58 km borders with An-Naqav Desert to the east and south and 12 km with Egypt to the southwest. Most governmental and non-governmental organizations are located in Gaza city and concentrated in the middle part resulting in serious traffic congestion and therefore in increase of fuel consumption and emissions from vehicles, especially in major arterial roads such as Eljalaa St. This road is a principal arterial road connecting the southern part of Gaza city with the northern part. The congestion appears clearly in the segment which consists of 5 consecutive signalized intersections ([3] [4] ).
What makes the congestion worse is the non-efficient traffic signal control; where each intersection is treated in isolation. Furthermore, the timing setting is normally developed without proper calculations; it is usually assigned using experience which is not always the optimum solution. It is clear that the reduction of fuel consumption and vehicle emissions of polluting gases is an urgent need for environmental globally, as well as for people in Gaza Strip; especially since the Gaza Strip is suffering from a shortage of imported fuel and scarcity of energy resources. The key solution to reduce the congestion and to save energy is to arrange the green signal at the downstream signalized intersection to match with the platoon traffic flow arriving from the upstream signalized intersection. This arrangement is called signal coordination.
Given this context, the study aims to analyze the existing traffic situation and fuel consumption of the five consecutive uncoordinated signalized intersections located along Eljalaa Road. In addition, the study is also intended to redesign the timing settings of these signalized intersections so that the signals can be coordinated in a good manner. The proposed approach of traffic congestion is rarely discussed in Gaza Strip; therefore, this study is considered as the first of its type in Gaza Strip. The results of this study can improve the level of service of Eljalaa arterial; decrease delay; reduce vehicle emissions and fuel consumption; reduce driver aggravation related to unnecessary stops that may cause accidents; and enable traffic signals to communicate correctly with each other.
What follows this section is a general background on signal control and coordination. Then, the paper proceeds to a description of the selected signal coordination methodology. Section 4 presents data collection, while Section 5 provides the results of traffic situation analysis and signal coordination. Finally, Section 6 concludes major findings and recommendations.
2. Background
2.1. Definitions
An intersection is defined as an area shared by two or more roadways. Its main role is to allow the change of route directions. Intersections can be classified as grade-separated or at-grade [5] . Traffic control is used to allocate the right of way to drivers and thus to improve highway safety by ensuring the orderly and predictable movement of all traffic on highways. Traffic control devices are signs, signals, or markings which are used to regulate, guide, and/or warn traffic [1] .
Traffic signal is considered to be one of the most effective methods of intersection traffic control. It allows vehicle movements to be controlled by assigning time intervals. Traffic signal is frequently adopted at busy urban intersection. It can result in reducing congestion and improving road safety [6] .
2.2. Types of Signal Control
Traffic signals may operate independently or as a system. Thus, traffic control can be scaled into three categories which are individual intersection control, arterial control, and network control. In individual intersection control, a single traffic signal operates in a pre-timed, actuated, or traffic responsive mode, without affecting the operation of other traffic signals. In arterial control, two or more traffic signals operate synchronously along an arterial street in a pre-timed progression, traffic responsive, or adaptive control mode. In network control, traffic signals throughout an entire network of intersections are coordinated through a timing plan created offline, or an adaptive control strategy [7] .
Individual intersection control is already used in Gaza and has proved to be inefficient as drivers have to stop at each intersection along arterial roads like Eljalaa arterial. Because the studied intersections are located in a consecutive manner along Eljalaa road, the arterial control is adopted in this study. Traffic responsive or adaptive control mode requires the installation of traffic detectors at intersections which are expensive and not affordable by the responsible authorities in Gaza because of the bad economical situation. Therefore, the pre-timed progression (fixed time control) will be assumed in this study.
Fixed time control is the most widely used form of signal control. In fixed time control, signals are controlled using fixed timing plans. There are usually several coordination timing plans that are put into operation on a ‘time of day, day of week’ schedule. The plans consist of splits, cycle lengths, and offsets for every signalized intersection. These plans are developed offline either using manual methods or using special software and then loaded onto the controller [8] .
2.3. Signal Control Software
There are different software packages for fixed time control such as TRANSYT-7F [9] , SOAP [10] , MAXBAND [11] , PASSER II [12] , PASSER III [13] , PASSER IV [14] , and SIGOP III [15] . Among these software packages, TRANSYT-7F was selected in this study as it is one of the most widely used signal coordination programs ([16] [17] ). TRANSYT-7F is a version based on TRANSYT (Robertson [18] ) and is modified specifically for the United States. TRANSYT was originally developed by the Transportation and Road Research Laboratory in England in 1968. Other reasons for selecting TRANSYT-7F are: 1) its traffic model has recently been extended to overcome oversaturated traffic conditions; and 2) Genetic Algorithm has recently been added for optimization purposes which is an efficient tool for global optimization.
3. TRANSYT-7F Model
TRANSYT-7F is a deterministic, macroscopic simulation and optimization model. Accordingly, TRANSYT-7F model consists of a simulator and an optimizer.
3.1. TRANSYT-7F Simulator
The traffic model simulates traffic behavior in a roadway network which consists of junctions mostly controlled by traffic signals. This traffic simulator calculates the value of a “performance index” (PI) for the network for a given fixed-time plan and an average value of flow on each link [9] .
In TRANSYT-7F traffic simulator, the following basic assumptions are made [18] : 1) traffic rate of flow on each approach is constant; 2) the left/right turning percentages at each approach remain constant throughout the simulation period; 3) all major intersections in the system are controlled by signals or by a priority rule; and 4) all intersections in the system have a common cycle time or some multiple of a common cycle.
TRANSYT-7F uses the common modeling of traffic networks by graphs with nodes and links. In this system, each intersection is represented by a node and each one-way traffic movement between two nodes is represented by a link.
In TRANSYT-7F traffic flow model, the simulation is carried out by calculating the following three types of flow profiles which are IN profile, OUT profile and GO profile. “The IN profile is the pattern of traffic that would arrive at the stop line at the downstream end of the link with a condition of not impeding the traffic by the signals at that stop line. The OUT profile is the pattern of traffic that departs from the link. The GO profile is the pattern of the traffic that would leave the stop line if there is enough traffic to saturate the green.” The downstream arrival flow on internal links for each time step, t, is calculated by the following recurrence equation [18] :
![]() . (1)
. (1)
 . (2)
. (2)
where:![]() —predicted downstream flow rate in time interval t + βT of the predicted platoon; qt—flow rate of the initial platoon (OUT-profile) during step t; p—the proportion of the OUT flow entering this link; b—an empirical factor, generally 0.8; T—the cruise travel time on the link, in steps; F—a smoothing factor; a—an empirically derived constant, called the platoon dispersion factor; and T—the cruise travel time on the link from the upstream stop line to the downstream stop line.
—predicted downstream flow rate in time interval t + βT of the predicted platoon; qt—flow rate of the initial platoon (OUT-profile) during step t; p—the proportion of the OUT flow entering this link; b—an empirical factor, generally 0.8; T—the cruise travel time on the link, in steps; F—a smoothing factor; a—an empirically derived constant, called the platoon dispersion factor; and T—the cruise travel time on the link from the upstream stop line to the downstream stop line.
TRANSYT-7F uses the Highway Capacity Manual 2000 delay model. The model predicts average “control” delay, which contains initial deceleration delay, queue move-up time, stopped delay, and final acceleration delay. See National Research Council [19] or Hale [9] for more detail on delay calculation.
The estimation of fuel consumption in TRANSYT-7F is based on a linear combination of total travel, delay, and stops. The value of fuel consumption calculated using TRANSYT-7F model includes fuel consumed at cruise (for links on which a length has been provided), idle, and acceleration/deceleration [7] .
According to Hale [9] , the following fuel consumption model is used:
 . (3)
. (3)
where: F—fuel consumed in gallons (liters) per hour; TT—total travel in vehicle miles (vehicle kilometers) per hour; D—total delay in veh-hr/hr; S—total stops per hour; Kij—model coefficients that are functions of cruise speed (Vi) on each link i.
3.2. TRANSYT-7F Optimizer
The optimizer adjusts the settings of signal timing plan and examines if the adjusted settings better the performance index using the traffic simulator. The process is repeated until an optimum timing plan is reached.
In TRANSYT-7F optimizer, an objective function, the performance index (PI), is maximized (or minimized). The user can select the objective function depending on the desired operational characteristics of the system under consideration. The standard TRANSYT-7F Disutility Index (DI) is one of the performance indices which is a linear combination of the “standard” delay and stops.
The maximization/minimization in TRANSYT-7F optimizer is based on genetic algorithm optimization technique. It is a theoretical improvement over the traditional hill-climb optimization technique that has been employed by TRANSYT-7F for many years. Genetic algorithm has the ability to avoid becoming trapped in a “local optimum” solution, and is mathematically best qualified to locate the “global optimum” solution. For more description of genetic algorithm optimizer, see Hale [9] .
4. Data
4.1. Geometric Data
The study area is a part of Eljalaa Street consisting of five consecutive signalized intersections. A sketch of the street is presented in Figure 1. The spacing between intersections ranges between 276 m to 506 m. The name of intersections and geometric characteristics are summarized in Table 1. The table presents the number of lanes in each route before arriving and at each intersection. It is noted that the number of lanes before arriving intersections is less than at intersections because of either widening of intersections or using nearside lane for parking between intersections. Although intersection 4 is cross intersection in reality, the east bound approach is not used because of maintenance at this path. The work at the way is not finished until now because of the siege imposed on Gaza Strip five years ago.
4.2. Traffic Count
Manual traffic count was used in this work. The traffic count was conducted on 10/4/2011 from 7:00 am to 12:00 am by the civil engineering students under the supervision of the researcher. The form of manual traffic count is shown in Figure 2. The general information required to fill in the form are: intersection number, intersection name, name of counted approach, observer name, weather condition, date and sheet number. The traffic count was carried out every 15 minutes, which is usually used for traffic analysis and design. Thus, each traffic period requires one counting sheet; and the start and end of this period must be written in the general information at the top of the count form.
At each approach three movements are considered for traffic count. These are left-turn, through and right-turn
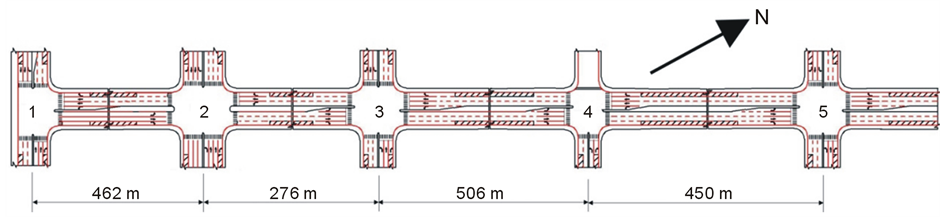
Figure 1. The studied part of Eljalaa Street.

Table 1. Geometric characteristics of the studied five intersections.
NB: North bound; SB: South bound; EB: East bound; WB: West bound.
movements. In each movement the traffic count is classified into 7 categories. The first category is Car/Van which is defined in this work as all vehicles that have two axles. Bus is all vehicles that have passenger capacity of about 50 persons. The third category is Truck which represents all vehicles that have three or more axles. The forth is Bike and the fifth is Motorcycle. The sixth is Tractor. The last one is Cart which is the animal driven cart.
When each vehicle enters the intersection, a slash mark is written until reaching 4 vehicles. Then, when the fifth vehicle enters the intersection, a slash is written across the four slashes. This is for making the calculation of total volume easier. Using slash marks might be difficult to be used at heavy intersections. Therefore, one may use numbers for each group of vehicles as indicated in Figure 2.
The traffic count was carried out with classification since the traffic composition has an effect on the capacity of traffic signal approaches. The effect of traffic composition on capacity is usually considered by the use of weighting factors, referred to as “passenger car units”, assigned to different vehicle categories. Constant factors are used to convert all vehicle types into passenger car units (pcu) value. Values of pcu used for signal analysis and design are as shown in Table 2 [20] .
The peak hour was between 11:00-12:00 and the peak 15-minutes period was between 11:00-11:15. This period will be considered for analysis and signal coordination based on TRANSYT-7F in the next section. The traffic volume for left-turn, through, and right-turn movements at each intersection in this 15-minutes period are presented in Table 3.
4.3. Current Signal Timing Plan
The existing signal timing at the considered intersections is presented in Table 4. The lengths of the cycle time for the intersections shown in Table 4 are not equal. This reveals that Eljalaa arterial road is not coordinated. The values of offsets for all intersections are zeros. This is another evidence of not using the signal coordination. The phase number, description and its value of green time are shown in Table 4. The abbreviations RS + LS + TE in the phase description column mean that phase 1 at the intersection 1 consists of right turn movement in the south approach (RS); left turn movement in the south approach (LS); and through movement in the east approach (TE).
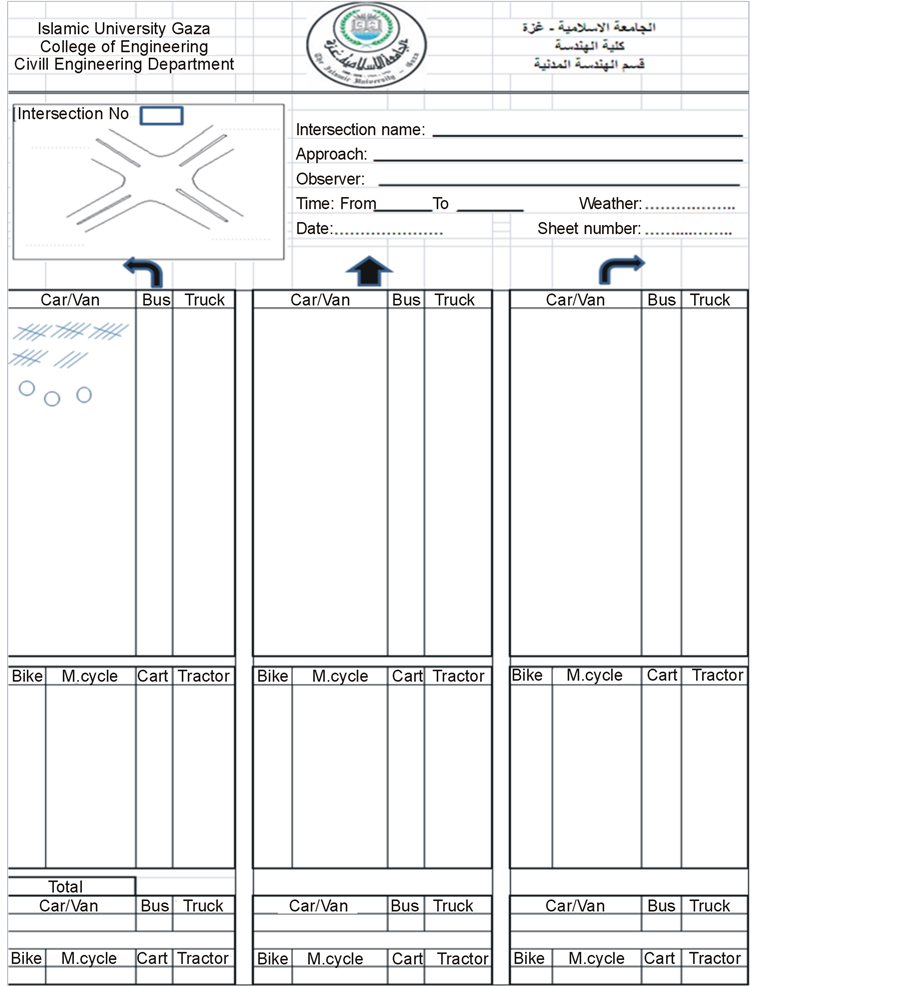
Figure 2. Form of manual traffic count.
Table 2. pcu for different types of vehicles.
Table 3. Traffic volume in the peak 15-minute (pcu/hr) in the peak hour.
L: Left-turn movement; T: Through movement; R: Right-turn movement.
Table 4. Existing signal timing plan for the considered intersections.
L: Left-turn movement; T: Through movement; R: Right-turn movement; N: North bound; S: South bound; E: East bound; W: West bound.
5. Signal Analysis and Coordination
5.1. Signal Analysis
To analyze the traffic performance of existing uncoordinated situation of Eljalaa arterial road, geometric and traffic data are input into TRANSYT-7F software. TRANSYT-7F predicts different performance measures for evaluation such as Total Travel Time, Level of Service, Average Delay, Stops Percentage, Fuel Consumption, and Disutility Index. The Disutility Index measures the overall cost of traffic congestion and is usually a combination of the total delay and the number of stops made by vehicles.
Table 5 presents the results of the analysis for the whole system of existing uncoordinated traffic situation in terms of the different performance measures obtained by TRANSYT-7F. The results show high amount of performance measures experienced during the peak period by most of the travelers. The results indicate that Eljalaa route is highly congested. Delay obtained, 98.2 sec/veh with reference to TRB [19] dictates level of service (LOS) F. Also travel time had a value of 125 veh-hr.
Table 5. Performance of existing uncoordinated situation of Eljalaa Arterial Road.
5.2. Signal Coordination
In order to reduce the traffic congestion, the existing timing plan has to be redesigned so that the signals along Eljalaa arterial road are coordinated. This can be achieved using TRANSYT-7F by optimizing common cycle time, green splits and offsets based on Genetic Algorithm available in the software. The values of Genetic Algorithm parameters used in the optimization are 30% for crossover probability; 1% for mutation probability; 0.01% for convergence threshold; 100 for maximum number of generations; and 50 for population size.
The results of optimum values of signal timing parameters are presented in Table 6. The common cycle time is 80 seconds, which is less than any cycle length for all intersections in the uncoordinated existing plan. This means that the existing timing plan is not proper calculated. The offsets for intersections 1, 2, 3, 4 and 5 are 0, 70, 45, 56, and 16 seconds respectively indicating of signals coordination.
The performance results for the whole coordinated arterial road are presented in Table 7. The results show reduction in the amount of travel time, delay, stops, fuel consumption and disutility index. The benefits of coordination are clearly visible. For the whole system, the Total Travel Time comes down from 125 veh-hr to 70 veh-hr, which shows an improvement of about 44%. The results show that the average delay experienced by the vehicles has dropped from 98 sec/veh to 43 sec/veh during the peak hour indicating improvement of 56%. The LOS has been changed to a better value of D. The Total Stops, Fuel Consumption and Disutility Index have been decreased to significant values.
The comparison based on Total Travel Time, Level of Service, Average Delay, Stops percentage, Fuel Consumption, and Disutility Index for the whole segment of the arterial road during peak hour at all approaches is shown in Figure 3. The impact of the coordination system is obvious from the fact that there is a significant reduction in the value of all performance parameters.
6. Conclusions
Travellers along Eljalaa arterial road, which is located in Gaza city, suffer from traffic congestion. The congestion is a result of inefficient traffic signal control. The signals at the arterial road are not coordinated; each intersection at the arterial is treated as an isolated one. Another reason for traffic congestion is that the timing setting is normally developed without proper calculations; but, it is usually assigned based on experience. This study intends to evaluate the existing uncoordinated timing plan for the arterial road, and then redesign a new timing plan ensuring signal coordination using TRANSYT-7F.
Geometric data were collected which include medium width and number of lanes of each approach at each intersection. For each lane, information about length and width in addition to the lane use by movement were also obtained. Classified manual traffic count was carried out on 10/4/2011. The peak hour was between 11:00-12:00 and the peak 15-minutes period was between 11:00-11:15. The volume in this peak 15-minutes period was used for analysis and signals coordination.
The results of the analysis of the existing uncoordinated pattern show a bad level of service (F) for the whole system. This indicates that Eljalaa road is highly congested. When timing plan is optimized and the coordination of signals, a major improvement in the traffic performance is obtained. The performance index (disutility index) which incorporates Total Travel Time, Average Delay, Total Stops and Fuel Consumption has been significantly reduced by 40.9%. The level of service has been changed from F to D.
Several recommendations have emerged from this research. First, different traffic volumes require different signal timing plans. Therefore, the same work should be carried out for different periods of time throughout the day. Second, other arterials roads are recommended to be coordinated in the same way. Third, when the economical situation is better, it is recommended to install sensors at intersections and to use actuated traffic responsive control.
Table 6. Design of signal timing plan for the considered intersections.
Table 7. Performance of signal coordination of Eljalaa Arterial Road.
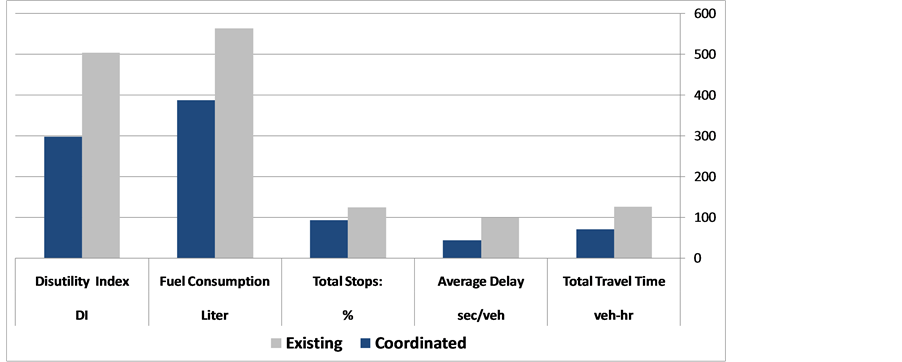
Figure 3. Performance comparison between existing and signal coordination of Eljalaa Road.
Acknowledgements
I would like to express my sincere and heartfelt gratitude to Thaer M. Abed, Alaa S. El-Manasra, Mohammed J. Harara, Metghal N. Abed and Nedal A. Daher for their help in collecting geometric data. I would also thank the civil engineering students for collecting traffic data.
References
- Garber, N.J. and Hoel, L.A. (2010) Traffic and Highway Engineering. 4th Edition, Cengage Learning, USA.
- Qumsieh, V., Isacc, J. and Qattoush, N. (1996) Energy and Its Impact on the Environment. Applied Research Institute, Jerusalem.
- Almasri, E. and Al-Jazzar, M. (2013) TransCAD and GIS Technique for Estimating Traffic Demand and Its Application in Gaza City. Open Journal of Civil Engineering, 3, 242-250. http://dx.doi.org/10.4236/ojce.2013.34029
- Almasri, E. and Alraee, S. (2013) Factors Affecting Mode Choice of Work Trips in Developing Cities—Gaza as a Case Study. Journal of Transportation Technologies, 3, 247-259. http://dx.doi.org/10.4236/jtts.2013.34026
- O’Flaherty, C.A. (1997) Transport Planning and Traffic Engineering. Arnold, London.
- Mannering, F.L., Washburn, S.S. and Kilareski, W.P. (2008) Principles of Highway Engineering and Traffic Analysis. 4 Edition, Wiley.
- Dunn Engineering Associates (2005) Traffic Control Systems Handbook. Federal Highway Administration.
- Garbacz, R.M. (2003) Adaptive Signal Control: What to Expect. ITS Cooperative Deployment Network.
- Hale, D.K. (2005) Traffic Network Study Tool, TRANSYT-7F. United States Version, Mc Trans Center, University of Florida, Gainesville.
- Transportation Research Center, University of Florida (1979) SOAP: Signal Operations Analysis Package. University of Michigan Library.
- Kelson, M.D. (1981) Optimal Signal Timing for Arterial Signal Systems: Vol. 3: MAXBAND Programmer’s Manual: Final Report. Federal Highway Administration, National Technical Information Service.
- Messer, C.J.A. (1974) Report on the User’s Manual for Progression Analysis and Signal System Evaluation RoutinePasser II Texas Transportation Institute, Texas A & M University.
- Venglar, S., Koonce, P. and Urbanik II, T. (1998) PASSER III-98 Application and User’s Guide, Texas Transportation Institute, Texas A&M University System, College Station.
- Chaudhary, N.A. (1996) PASSER IV-96, Version 2.1: User/Reference Manual, National Technical Information Service.
- Lieberman, E.B. (1983) SIGOP-III User’s Manual. Federal Highway Administration, Office of Implementation.
- Kim, D.N. (2003) Evaluation on Simulation Models for Urban Corridor Signal Optimizations. Proceedings of the Eastern Asia Society for Transportation Studies, 4.
- Wallace, C.E. and White, F.J. (1988) Modeling of Shared Lane Use in TRANSYT-7F. Transportation Research Record, 1194.
- Robertson, D.I. (1969) Transyt: A Traffic Network Study Tool. RRL Report LR 253, Road Resarch Laboratory Crowthorne, Berkshire.
- TRB Transportation Research Board (2000) Highway Capacity Manual. National Research Council, Washington DC.
- Salter, R.J. and Hovnsell, N.B. (1996) Highway Traffic Analysis and Design. 3rd Edition, Macmillan Press Ltd.