Advances in Infectious Diseases
Vol.2 No.2(2012), Article ID:19919,12 pages DOI:10.4236/aid.2012.22005
Anti-Microbial and Physico-Chemical Properties of Processed and Raw Honeys of Mauritius*
![]()
1Department of Agriculture and Food Science, Faculty of Agriculture, University of Mauritius, Reduit, Mauritius; 2Department of Health Sciences, Faculty of Science, University of Mauritius, Reduit, Mauritius.
Email: #f.mahomoodally@uom.ac.mu
Received March 8th, 2012; revised April 1st, 2012; accepted May 5th, 2012
Keywords: Honey; Antimicrobial; Minimum Inhibitory Concentration; Physicochemical; Antibacterial; Antifungal
ABSTRACT
Among the panoply of food products used in treatment of various ailments, honey has been used since prehistoric times as an effective antimicrobial therapy. Being first of its kind, honeys with specific botanical origin from Mauritius were examined. In this study, three commercially processed-enhanced v/s three unprocessed honeys were evaluated for possible antimicrobial activities against clinical bacterial (Enterococcus faecalis (ATCC 29212), Staphylococcus aureus (ATCC 29213), Escherichia coli (ATCC 25922), Pseudomonas aeroguinosa (ATCC 27853)) and fungal (Aspergillus niger (ATCC 16404) and Candida albicans (ATCC 10231)) isolates in vitro. Research findings showed that the respective physicochemical parameters of the samples ranged from; pH: 3.28 - 4.67, H2O: 17.63% - 24.87%, reducing sugar 42.95 - 60.31 g/100g, density 1.11 - 1.55 g/ml and viscosity: 1.85 - 26.24 Pa·s at 20˚C. Physiochemical parameters of different honeys were observed to vary significantly with respect to their floral origin (P < 0.05). After initial screening of the honeys tested at 100% (without dilution), minimum inhibitory concentration were established at three graded concentrations of 50%, 25% and 12.5% respectively. Promising results were observed against all clinical isolates evaluated; with inhibition zones ranging from 6 ± 0.00 to 20 ± 0.01 mm for undiluted honey samples compared to standard ampicillin from 14 ± 1.00 to 17 ± 3.06. The fungus used was found to be more resistant to the honeys than the bacteria. However, both processed and raw honeys were observed to possess highly significant antibacterial and antifungal properties (P < 0.05). The honey samples used in this study can be considered as valuable food products from their antimicrobial properties’ point of view and can have clinical potential.
1. Introduction
Eminent officialdom like WHO (World Health Organisation) recently reveals that the prominent effect of antimicrobial resistance versus control of infectious diseases is a serious challenge to be addressed [1]. The result of such a natural response by the minute organisms has the potential to succumb or even bring progress to a standstill. European countries, benchmarked, considered as well regulated health systems are already witnessing an increase in specific pathogenic resistance. Developing countries like Mauritius are definitely not spared amidst these tycoons. The cumulative fracture twisted and forged during the past decades urge for the development of new antibiotics for surfeit of reasons including treatment of chronic infections [2]. The WHO estimates that 70% - 80% of the world population relies on traditional medicines as primary health care, as an alternative and complementary medicines [3]. The relationship between diet and health has been reckoned worldwide and this has led to effervescence for food products that shore up health beyond simply providing basic nutrition. Concurrently, 50% of natural products and their derivatives including antibiotics represent all drugs in clinical use round the globe [4]. The resistance of antibiotics against pathogens have triggered research scientists to venture for substitute curatives. It is indeed of paramount importance to unveil new therapies directed at novel targets as budding to alternatives to antibiotics as well as validation of traditional remedies [5]. Plethora of studies has emerged towards natural products in addressing the dearth and limitations of current therapies.
One natural food product which has gained great momentum is honey. Researchers round the globe have worked both in vitro and in vivo to spark the unknown benefits of the inestimable attributes of honey as well as its applications [6-9].
Among the oldest book, 1432 years ago the Holy Quran clearly defines honey in a simple and understandable language. It was already mentioned it this Holy book that, “And thy LORD taught the bee to build its cells in hills, on tree and in men’s habitations, then to eat of all the produce of the earth and find with skill the spacious path of its LORD, there issues from within their bodies a drink of varying colours, wherein is a healing for men, verily in this a sign for those who give thought”. Blessed by these varying colourful colloids, it has set templates since prehistoric times and is still being exploited for its tremendous benefits and has been used in folk medicine since ancient times. In the modern era, the different biological, chemical and physical properties of honey have revealed several beneficial claims through different techniques. The multi facet properties of honey anchored in the scientific world is regarded as a sweetener, functional food, antioxidant, antimicrobial, antiseptic, pre-biotics, pro-biotics, immunomodulatory, antiinflammatory, anti-tumour and anti cancer effect amongst others [5,10-12]. Above and beyond its therapeutic effects or medicinal attributes [4,13], it is also of potential use as bio indicators for environmental contamination [14]. The colour of honey can vary from nearly colourless to dark brown and its consistency can be fluid, viscous or partly to entirely crystallised. The botanical spectrum or the nectar source visited by the honey bees leads to variation in colours, flavours and aroma [15].
The Republic of Mauritius, being a volcanic island with temperate tropical climate, along with its agglomerate sugar cane plantation, has a large floral biodiversity with many unique plants indigenous to the region. Parallel with the colourful vegetation round the island, it offers a variety of honeys which varies from colour, aroma, flavour as well as unique quality attributes resulting from different nectar origins. The main tree species are Schinus terebentifolius, Eucalyptus tereticornis, and Tamarindus indica and backyard flowers and vegetable crops. Honey is produced from these plants and sold commercially throughout the island. Beekeeping is regarded as a traditional practice by some apiarists whilst others as small entrepreneurship both generating a lucrative source of revenue. Mauritius is still not self-sufficient in honey production due to constraints like cyclone, droughts and also due to loss of interest by apiarists. As a result, Mauritius import natural honey from different countries like Australia, Egypt, India, France, Madagascar, United kingdom, Pakistan, China, Germany, South Africa, U.S.A, New Zealand and Spain [16]. On the other hand, recent report published by Belmin reported that around 24 tons of honey from Rodrigues is exported annually to Mauritius which is nearly half of its local production [17]. Rodrigues honey is also recognised for its unique organoleptic attributes especially the Eucalyptus tereticornis.
The multifarious composition of honey kept on fascinating researchers around the world to unveil its remarkable attributes and health benefits. Since the composition of honey varies with the floral species of origin, local climate, and approach procedures used for harvesting and storage, therefore Mauritian honeys can be expected to be unique. Though honey has been documented to possess therapeutics potential worldwide, none of the studies have evaluated the antimicrobial activity and possible use as medical grade for Mauritian honeys.
The present study was, therefore, to investigate the antimicrobial potential and physico-chemical properties of three honeys from indigenous and exotic plants grown in the Republic of Mauritius, including one from Rodrigues Island. Additionally, three commercially processed honeys were studied in an endeavour to compare results.
2. Materials and Methods
2.1. Sampling
All honey samples sourced were mainly from the Republic of Mauritius, including Rodrigues Island. Sufficient samples were collected such that all experiments during the study were performed with same sample batch. Three varieties of a leading local brand were purchased from a commercial source (Product specifications were recorded for identification). The remaining three samples were pure fresh honey obtained directly from specific beekeepers. After collection, honey samples were stored in air tight glass jars at ambient temperature (20˚C - 25˚C) in the dark for analysis. The six different honey samples used were each unique in its own for they were from different floral origin. The commercially used honey was of unknown floral origin since it was not specified. For instance, the commercial honey is usually obtained from various local beekeepers and blended together for pretreatment and processing prior to bottling for distribution. For this reason, the commercially used honey was assumed to be multifloral. The unifloral natural raw honeys used were: Wild pepper, Litchi and Eucalyptus. The specification and source of honey used are illustrated in Table 1.
2.2. Preparation of Honey Samples
Samples were prepared according to Association of Official Analytical Chemists (AOAC) standard [18]. Honey samples used were free from granulation, suspended solids and from any form of crystallisation. The samples were thoroughly mixed using a clean sterile glass rod to ensure homogeneity prior to use.
2.2.1. Determination of Viscosity
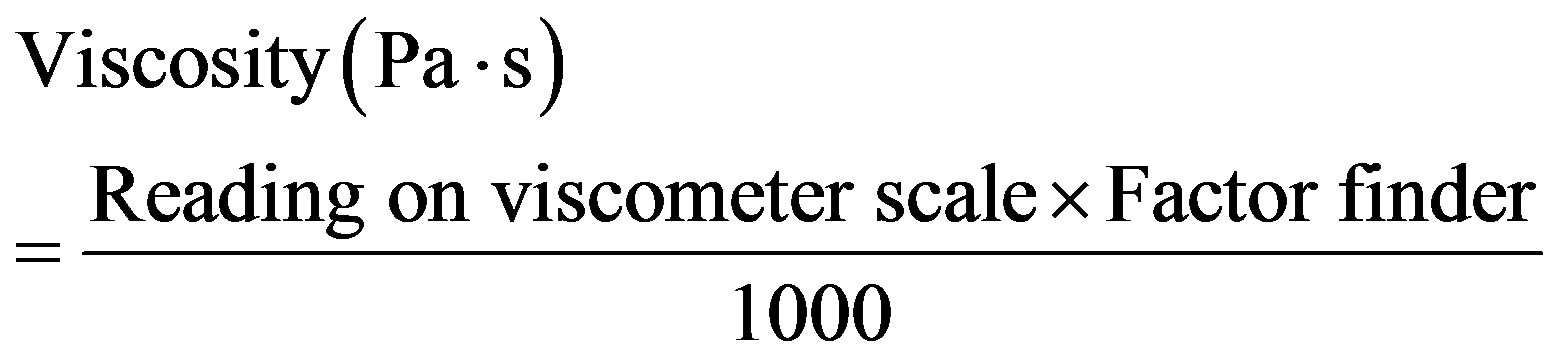
The Rheology of honey sample was determined as described by Tavakolipur & Ashtari with some amendments [19]. About 200 ml of each honey samples were used for measurement. Brookfield Synchro-lectric Viscometer (Model RVT, Britain) was used for viscosity measurement within temperature range 20˚C - 45˚C at 5˚C intervals. A water bath—Grant (Model W28, England)—was used to raise the sample’s temperature and ice packs were used for temperature lowering. Viscosity was measured within seconds to ensure accuracy of results. Temperature was measured using a digital thermometer—HANNA (Model H193510, Romania). Samples were pre-heated at 55˚C for 1 hr prior to viscosity determination to prevent formation of air bubbles and crystals. All experiments were performed in duplicates and apparatus was operated according to manufacturer instructions (Manual No. M/85-150-N898). Viscosity was calculated according to the table factor finder instruction using spindle number and its speed (RPM) of rotation.
The following formula below was used to calculate viscosity in Pa·s:
2.2.2. Determination of Colour
Optical density measurement was used for colour classification. The procedure used was adapted from Gidamis et al. [20] and Kumar & Mandal [21]. Honey samples were heated in a water bath at 50˚C to dissolve any fine crystals and filtered to remove any coarse particles which may affect the measurement. Samples were allowed to cool at ambient temperature and homogenised using a glass rod before measurement. Milton Roy, spectronic, 1001 plus spectrometer (USA) was used to measure absorbance at OD560nm and blank with deionised water. Absorbance values obtain was compared with standard USDA [22] colour classification for honey as shown in Table 2.
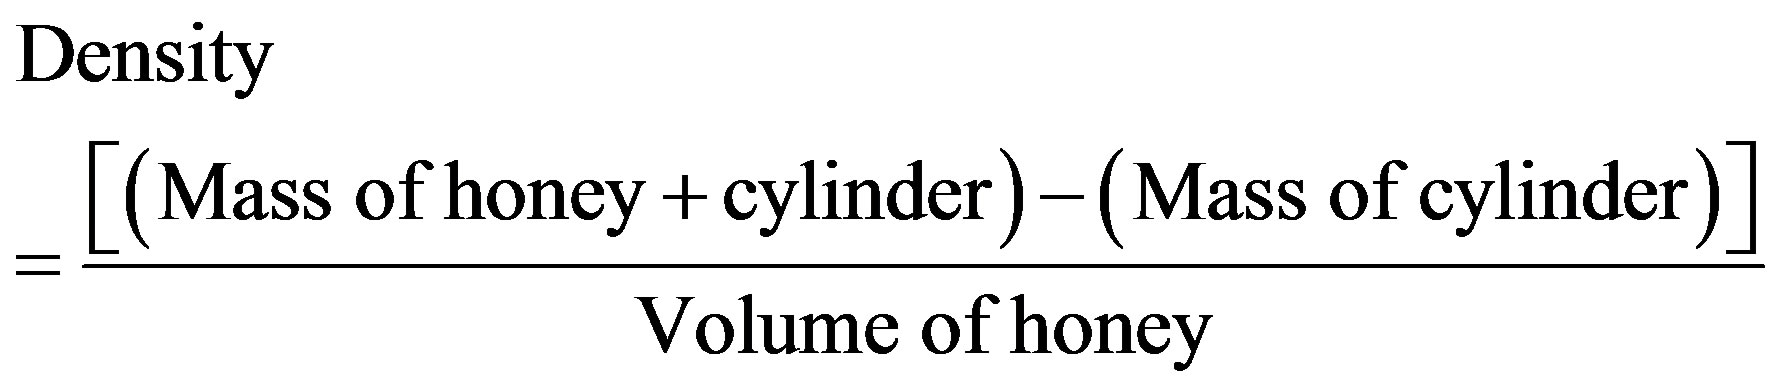
2.2.3. Determination of Honey Density
Density was obtained by the mass to volume ratio relationship. By the use of a dropper, exactly 1 ml of sample was introduced in a 5 ml measuring cylinder. The mass was then measured using an electronic balance—Adam (Model PW254, UK). The density of different sample was calculated from the following equation:
2.2.4. Determination of Reducing Sugars
Lane and Eynon method was used with some minor
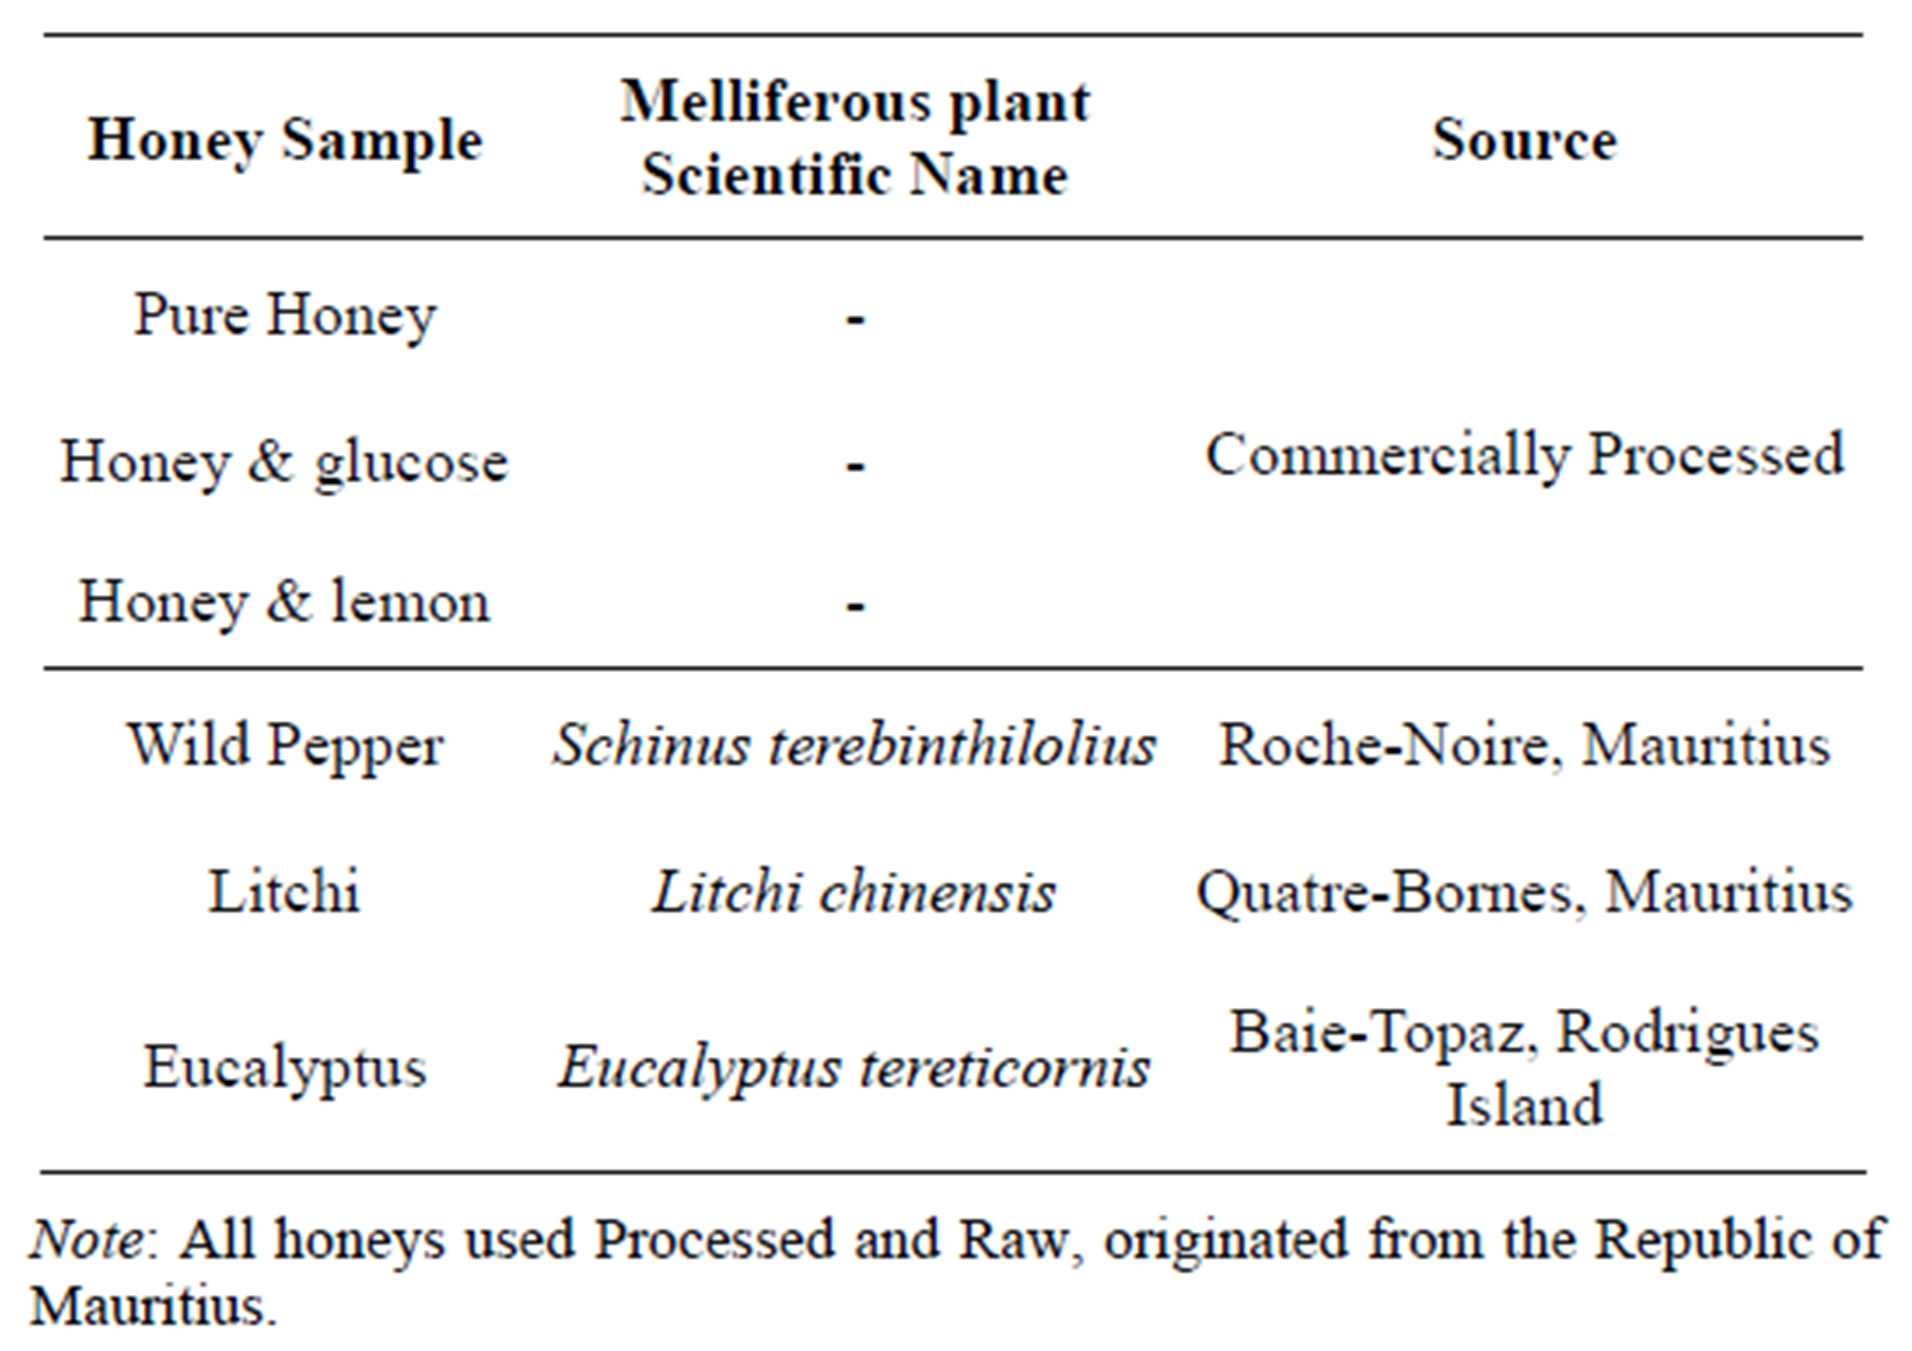
Table 1. Specification of honey samples.
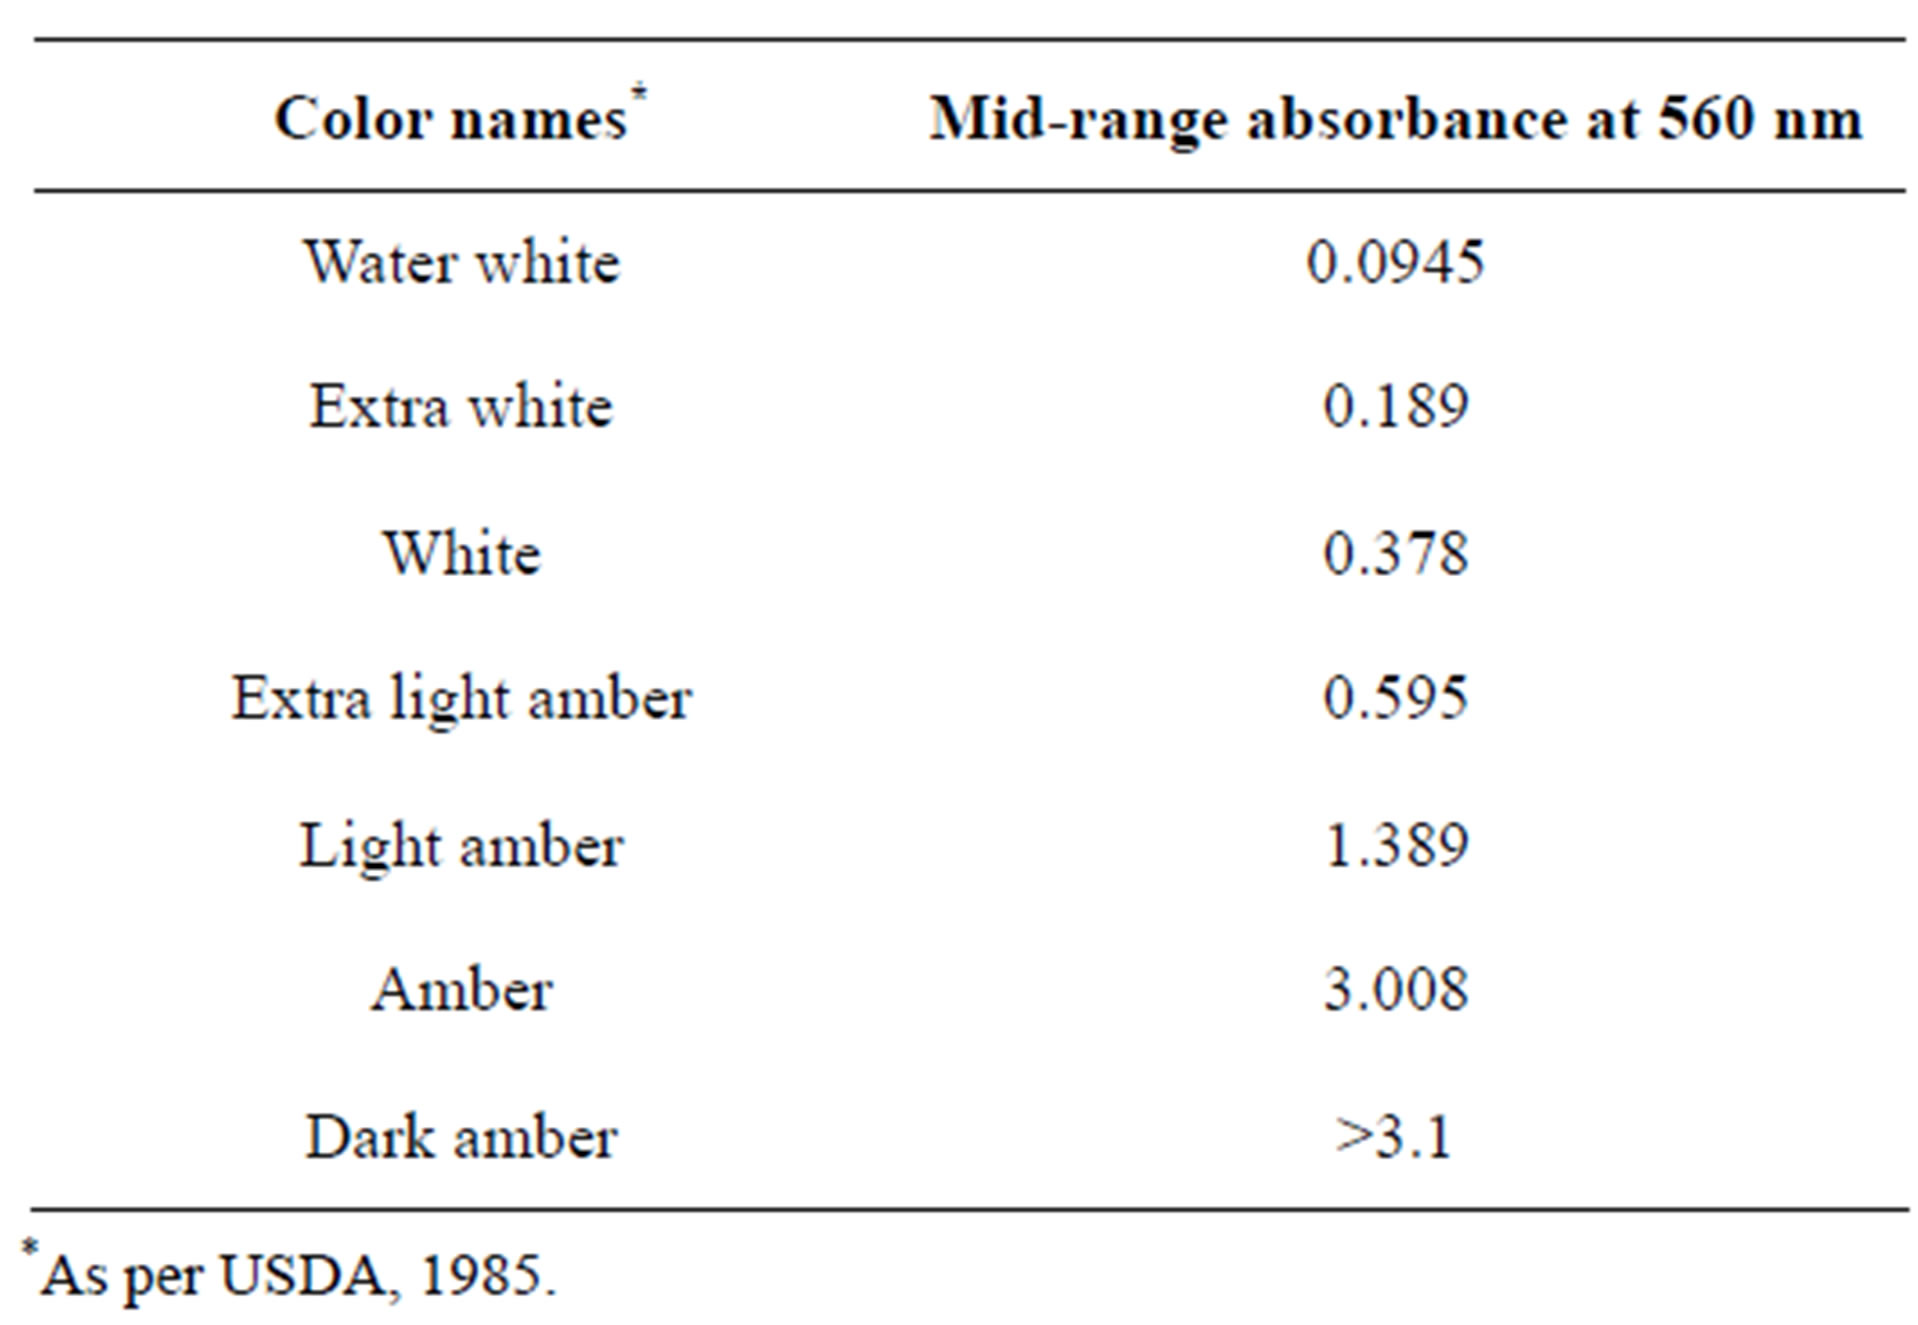
Table 2. Classification of samples based on colour.
modifications [23]. Approximately 3 g of honey was weighed using an electronic balance—Adam (Model PW 254, UK)—and was mixed with 50 ml distilled water. The pH value of the sample was adjusted to approximately 7 with aqueous NaOH solution to prevent inversion reaction during boiling. The honey solution was made up to the mark in a 250 ml-volumetric flask with distilled water and transferred to a 50 ml-burette. About 15 ml of honey solution was run into a 250 ml-conical flask with anti-bumping granules. 30 ml of Fehling’s solution was prepared by mixing equal volumes of Fehling’s 1 and Fehling’s 2 solutions into a 50 ml-beaker. 25 ml of the Fehling’s solution was transferred to the conical flask and the mixture was boiled for about 15 sec prior to addition of 3 drops of 1% aqueous methylene blue indicator. The honey solution was added rapidly dropwise until the blue colour was discharged and a brick red colour was obtained. Two accurate titrations were performed using 1 ml less of the rough titre value of honey solution prior to boiling for 2 min and addition of methylene blue indicator. Then the mean titre value and the percentage reducing sugars were calculated and reported to two decimal places.
2.2.5. Determination of pH
The procedure describes by AOAC (962.19:1990) was used for pH determination [18]. The pH of honey samples was measured using a pH meter—Mettler Toledo (Model MP220, Switzerland). 10 g of honey was dissolved in 75 ml cooled boiled distilled water (CO2-free) using a glass rod. Duplicate measurements on two separate test portions from the same sample were used. The mean value was then calculated.
2.2.6. Determination of Moisture Content
A hand refractometer model ATAGO HONEY (Japan) with the ranges 12% - 26% was used. The prism was carefully washed with distilled water and dried with soft tissue paper. A drop of honey sample was directly smeared on the prism and water content (%) was noted.
2.2.7. Determination of Total Soluble Solids
Total soluble solids were determined as described by ISO 2173:2003 [24]. Eleptron hand refractometer (Model RR32, Germany) with ranges of 50˚Brix - 85˚Brix, was first standardised. The prism was then washed with distilled water and dried off with a soft tissue. A drop of honey sample was placed on the refractometer prism and the reading was noted. The Brix of the sample was then calculated and temperature correction applied.
2.3. Microbiological Assays
2.3.1. Clinical Isolates Used
Culti-loops (Remel) of microorganisms were obtained from the Bacteriology Section of the Central Laboratory Candos, Victoria Hospital and stored at 4˚C. The test organisms used for the screening of antimicrobial activity were: gram positive bacteria; Enterococcus faecalis (ATCC 29212), Staphylococcus aureus (ATCC 29213), gram negative bacteria; Escherichia coli (ATCC 25922), Pseudomonas aeroguinosa (ATCC 27853) and fungus: Aspergillus niger (ATCC 16404) and Candida albicans (ATCC 10231). Growth of the micro-organisms were inoculated aseptically in nutrient broth (Himmedia) and incubated at 37˚C, except for Aspergillus niger for 48 hr at 25˚C.
2.3.2. Well Diffusion Assay
A screening assay using well diffusion was adapted from Sherlock et al. [25] and Agbagwa and Peterside [26]. About 200 µl of organisms adjusted to 0.5 Mc Farland in sterile Nutrient broth was applied to the centre of the agar. Mueller Hington agar plates (Oxoid) was used for the bacterial suspensions and Potato Dextrose Agar (Oxoid) for the fungus. Dry Sterile cotton swabs were used to spread the inoculums over the surface of the set agar plate (90 mm Petri-dishes). After inoculation, 6 mm diameter wells were cut into the surface of the agar using a sterile cork borer. Ten micro-litres of test honey were added to each well. Well were sufficiently spaced to avoid over-lapping of results. Plates were incubated at 37˚C for 24 hr except for Aspergillus niger, plates were incubated at 25˚C. A10 µl of 10 µg/ml of ampicillin (Sigma) was used as positive control and sterile distilled water as negative control. The diameter of zones of inhibition including that of the well was measured using a ruler (mm). Each assay was carried out in triplicate.
2.3.3. Disc Diffusion Assay
Disc diffusion assay was determined by a slight modification used by Ansari and Alexender [27]. 200 µl of micro-organisms adjusted to 0.5 Mc Farland in sterile Nutrient broth was innoculated on agar plates (90 mm) using sterile cotton swabs. 6 mm disc (made from Whatman nr 1) sufficiently spaced to prevent over-lapping of results were placed. 10 µl of honey samples was introduced directly on the disc after it was placed on respective agar. 10 µg standard ampicillin disc (Oxoid) was used as positive control and 10 µl of sterile distilled water was used as negative control. The diameter of zones of inhibition including that of the disc was measured using a ruler (mm). Each assay was determined in triplicate.
2.3.4. MIC Determination
The minimum inhibitory concentration (MIC) was determined according to Basson and Grobler [28] and Mahomoodally et al. [29] with some minor modifications. Two fold dilutions of the stock honeys (100%) sample were aseptically prepared in sterile distilled water using a carry-over technique to give a final volume of 5ml in each tube. Dilution was repeated to obtain graded concentration 50%, 25% and 12.5% v/v. Each dilution was carried out afresh prior to the determination. The samples least concentration at which the test samples shows effect was noted to the nearest (mm).Triplicates of the assay was established and the mean MIC was calculated.
2.3.5. Statistical Analysis
All analysis were performed in triplicate and data was expressed as mean standard deviation (±). Differences between the activities of the honeys as measured by the zones of inhibition were analysed using one-way analysis of variance (ANOVA) and P < 0.05 was considered statistically significant.
3. Results
3.1. Physical Characteristics of the Selected Honeys
With increase in temperature, it was observed that the viscosity of the honey samples tend to decrease as shown in Figure 1. However, the rate of decrease in viscosity by the different honey samples upon temperature is high with the exception of the sample honey and lemon. Honey and lemon sample was less affected by temperature. At 20˚C honey and glucose was more viscous 26.24 ± 0.23 Pa·s, followed by pure honey 18.56 ± 0.20 Pa·s, litchis honey 15.50 ± 0.71, eucalyptus 13.00 ± 0.14, wild pepper 12.85 ± 0.21 Pa·s and honey and lemon 1.85 ± 0.04 Pa·s. For instance, at 45˚C, ranging from more viscous to less, honey and glucose viscosity was 4.00 ± 0.14 Pa·s, pure honey 1.75 ± 0.07 Pa·s, litchis honey 0.75 ± 0.07 Pa·s, eucalyptus 1.45 ± 0.07 Pa·s, wild pepper 0.96 ± 0.10 Pa·s and honey and lemon 0.31 ± 0.02.
3.1.1. Colour Assessment
The commercial honeys were darker than the pure honeys. Based on the USDA colour classification [22], all the commercial honeys analysed were light amber whereas raw honeys white. The absorbances of the different honey samples were measured at 560 nm to determine their colour intensities. The colour intensity of S1 > S3 > S2 > S5 > S4 > S6 are depicted in Table 3.
3.1.2. Density
The commercial honey with glucose had the highest density (1.55 ± 0.12) while commercial honey labelled as pure honey had the lowest density (1.11 ± 0.02). The densities of all the honey samples were more or lesssimilar as illustrated in Figure 2.
3.2. Chemical Characteristics of the Selected Honeys
3.2.1. pH Profile of the Honey Samples
Commercial honey with lemon had the lowest pH of 3.28 ± 0.05 than all the other honeys. Litchis honey was found to be more acidic than the three other natural honeys as depicted in Table 4.
3.2.2. Moisture Content and Total Soluble Solids
The water content of the commercial honey significantly differed from each other with commercial honey and lemon having the highest moisture content (24.87 ± 0.12). At P < 0.05 all the samples showed significant difference
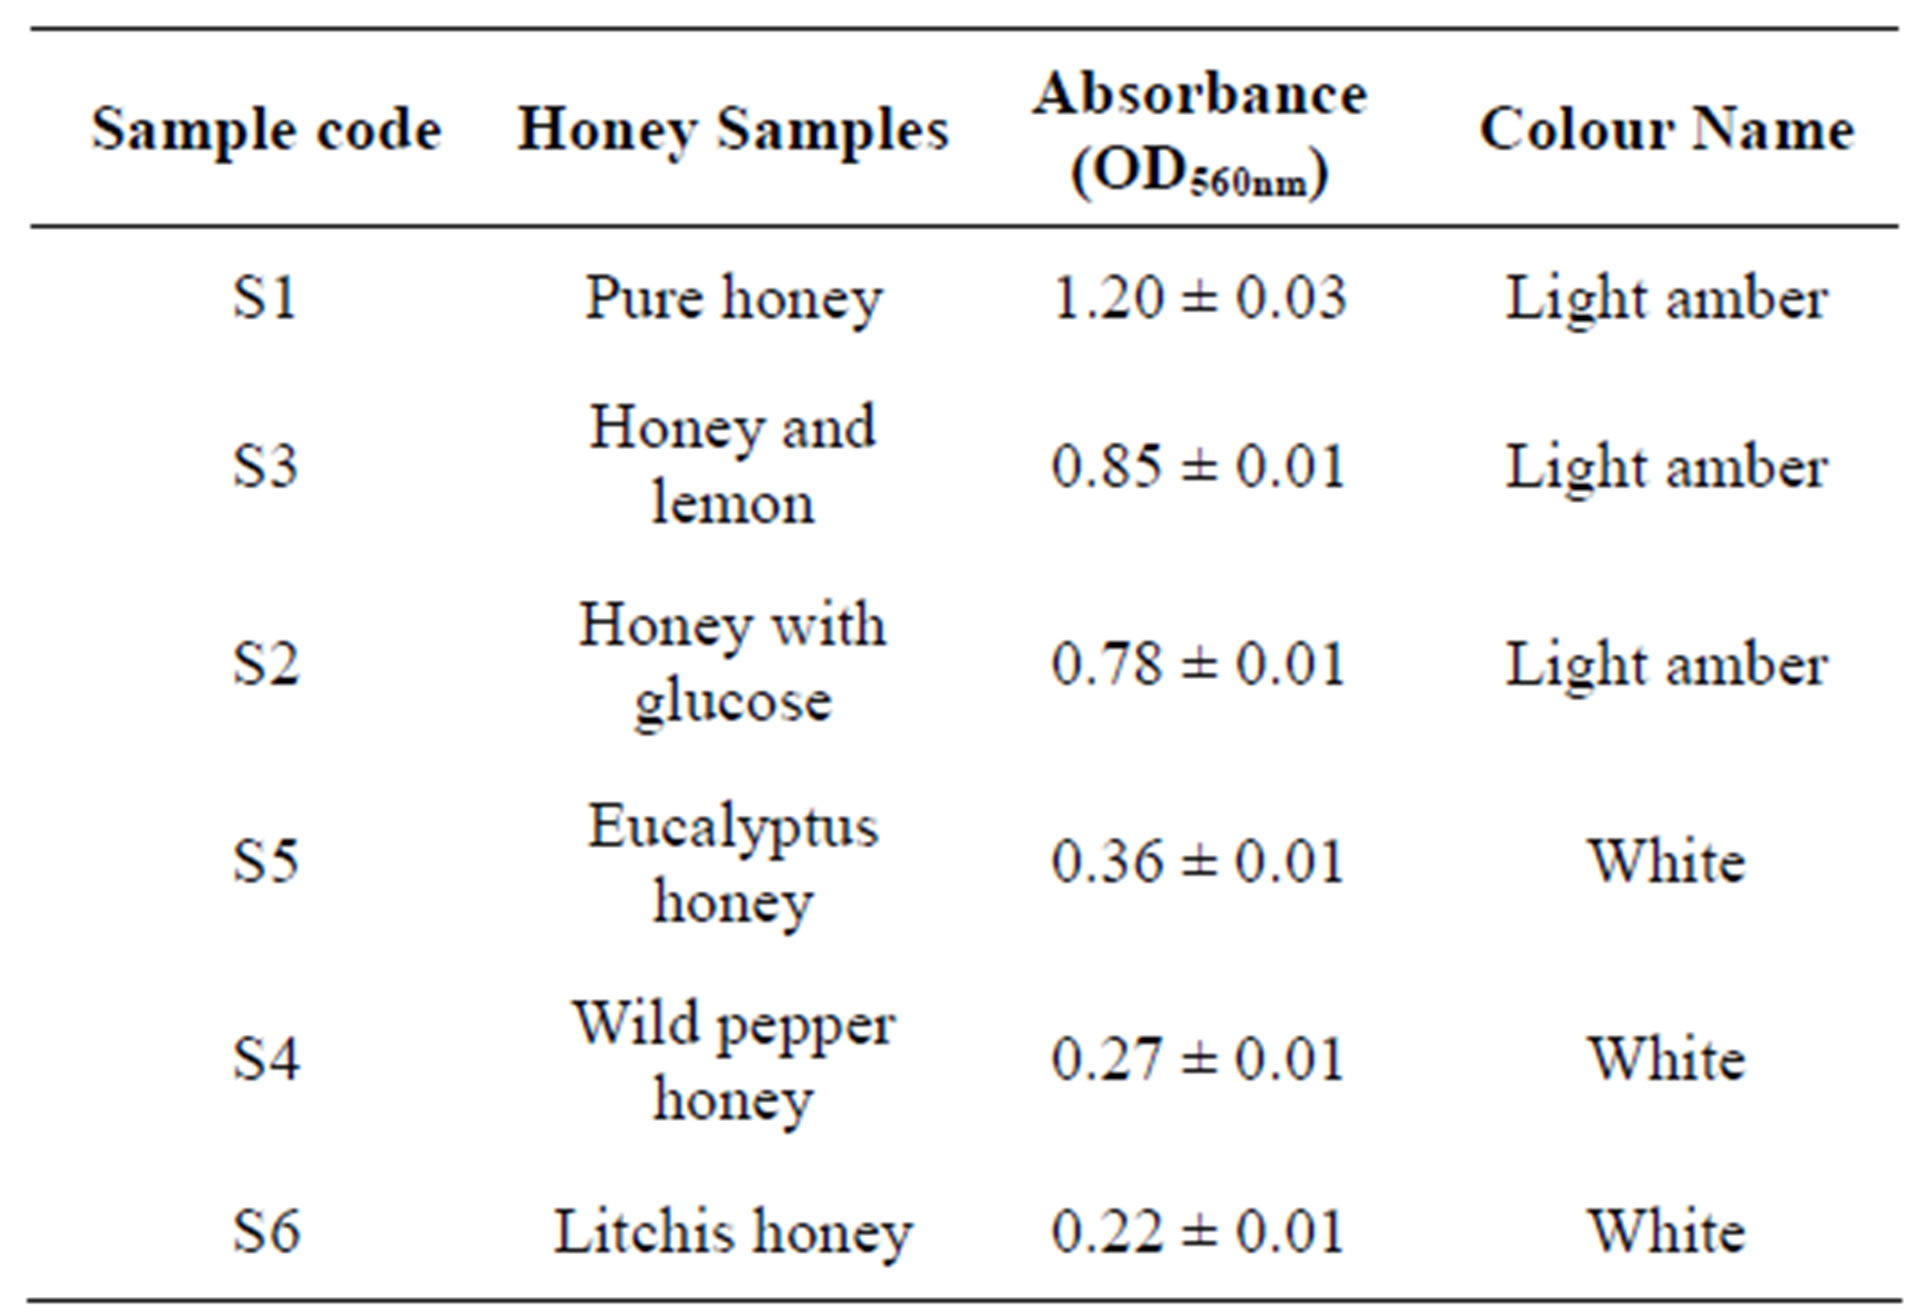
Table 3. Colour classification according to USDA.
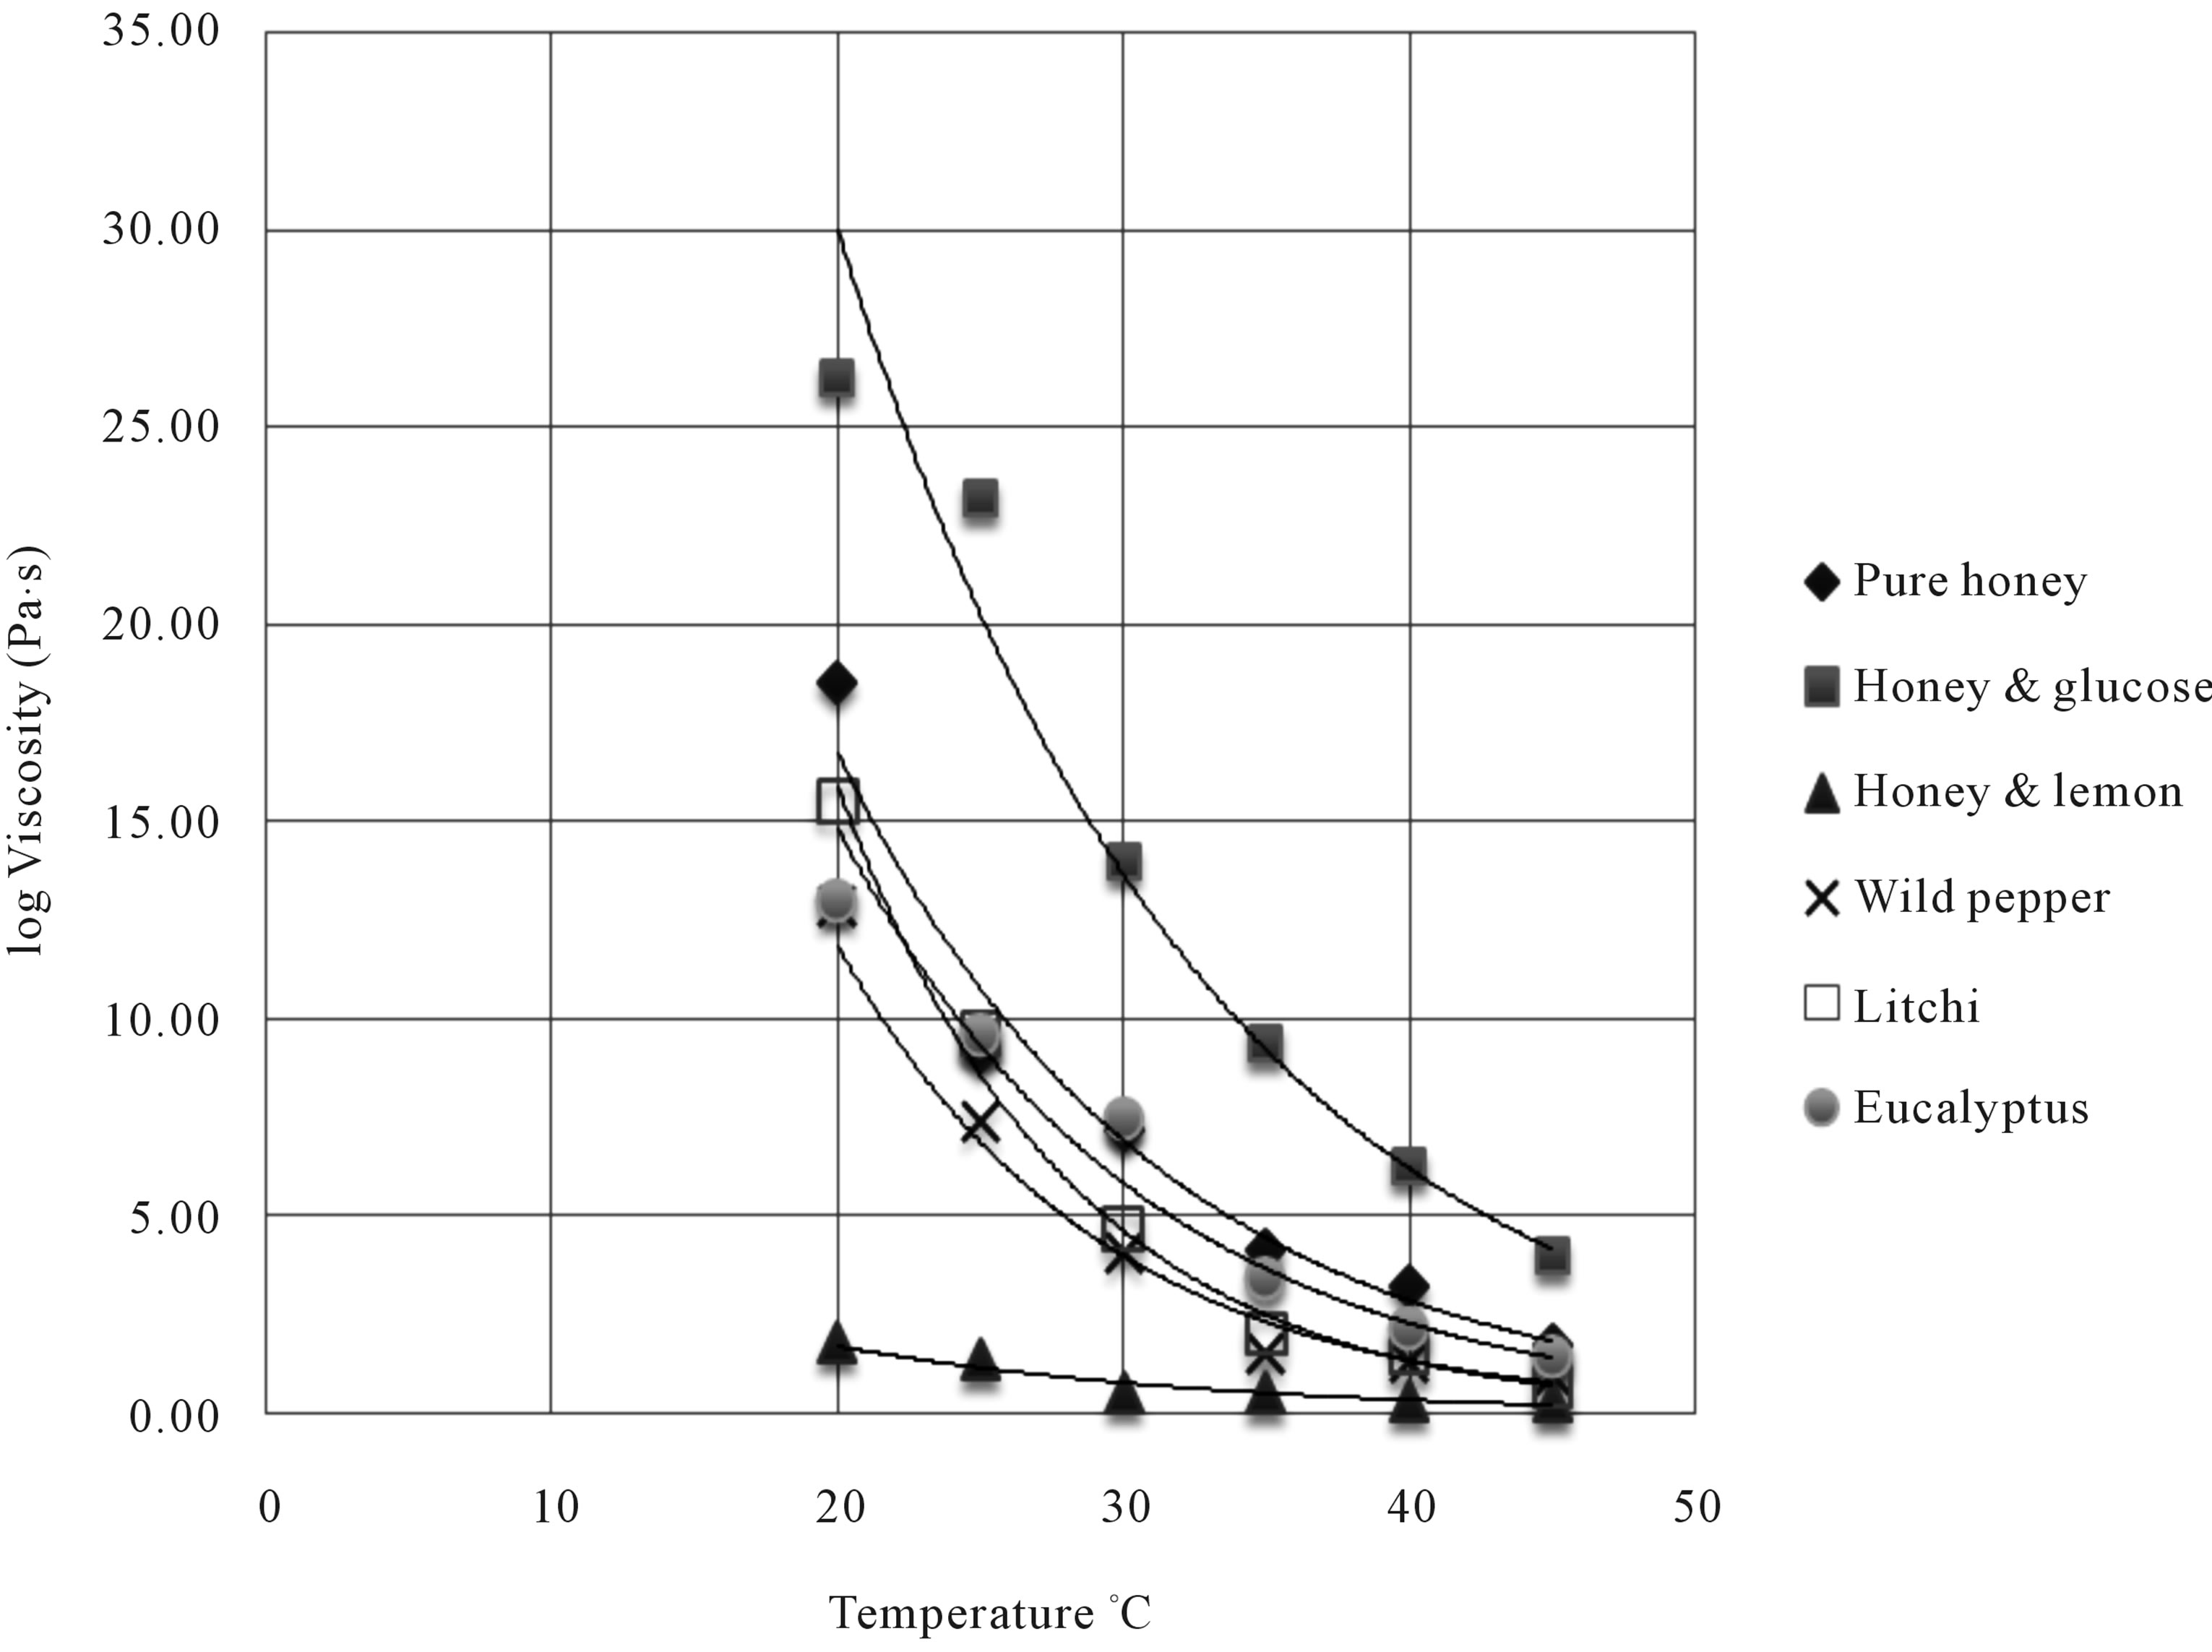
Figure 1. Viscosity of samples at different temperature.
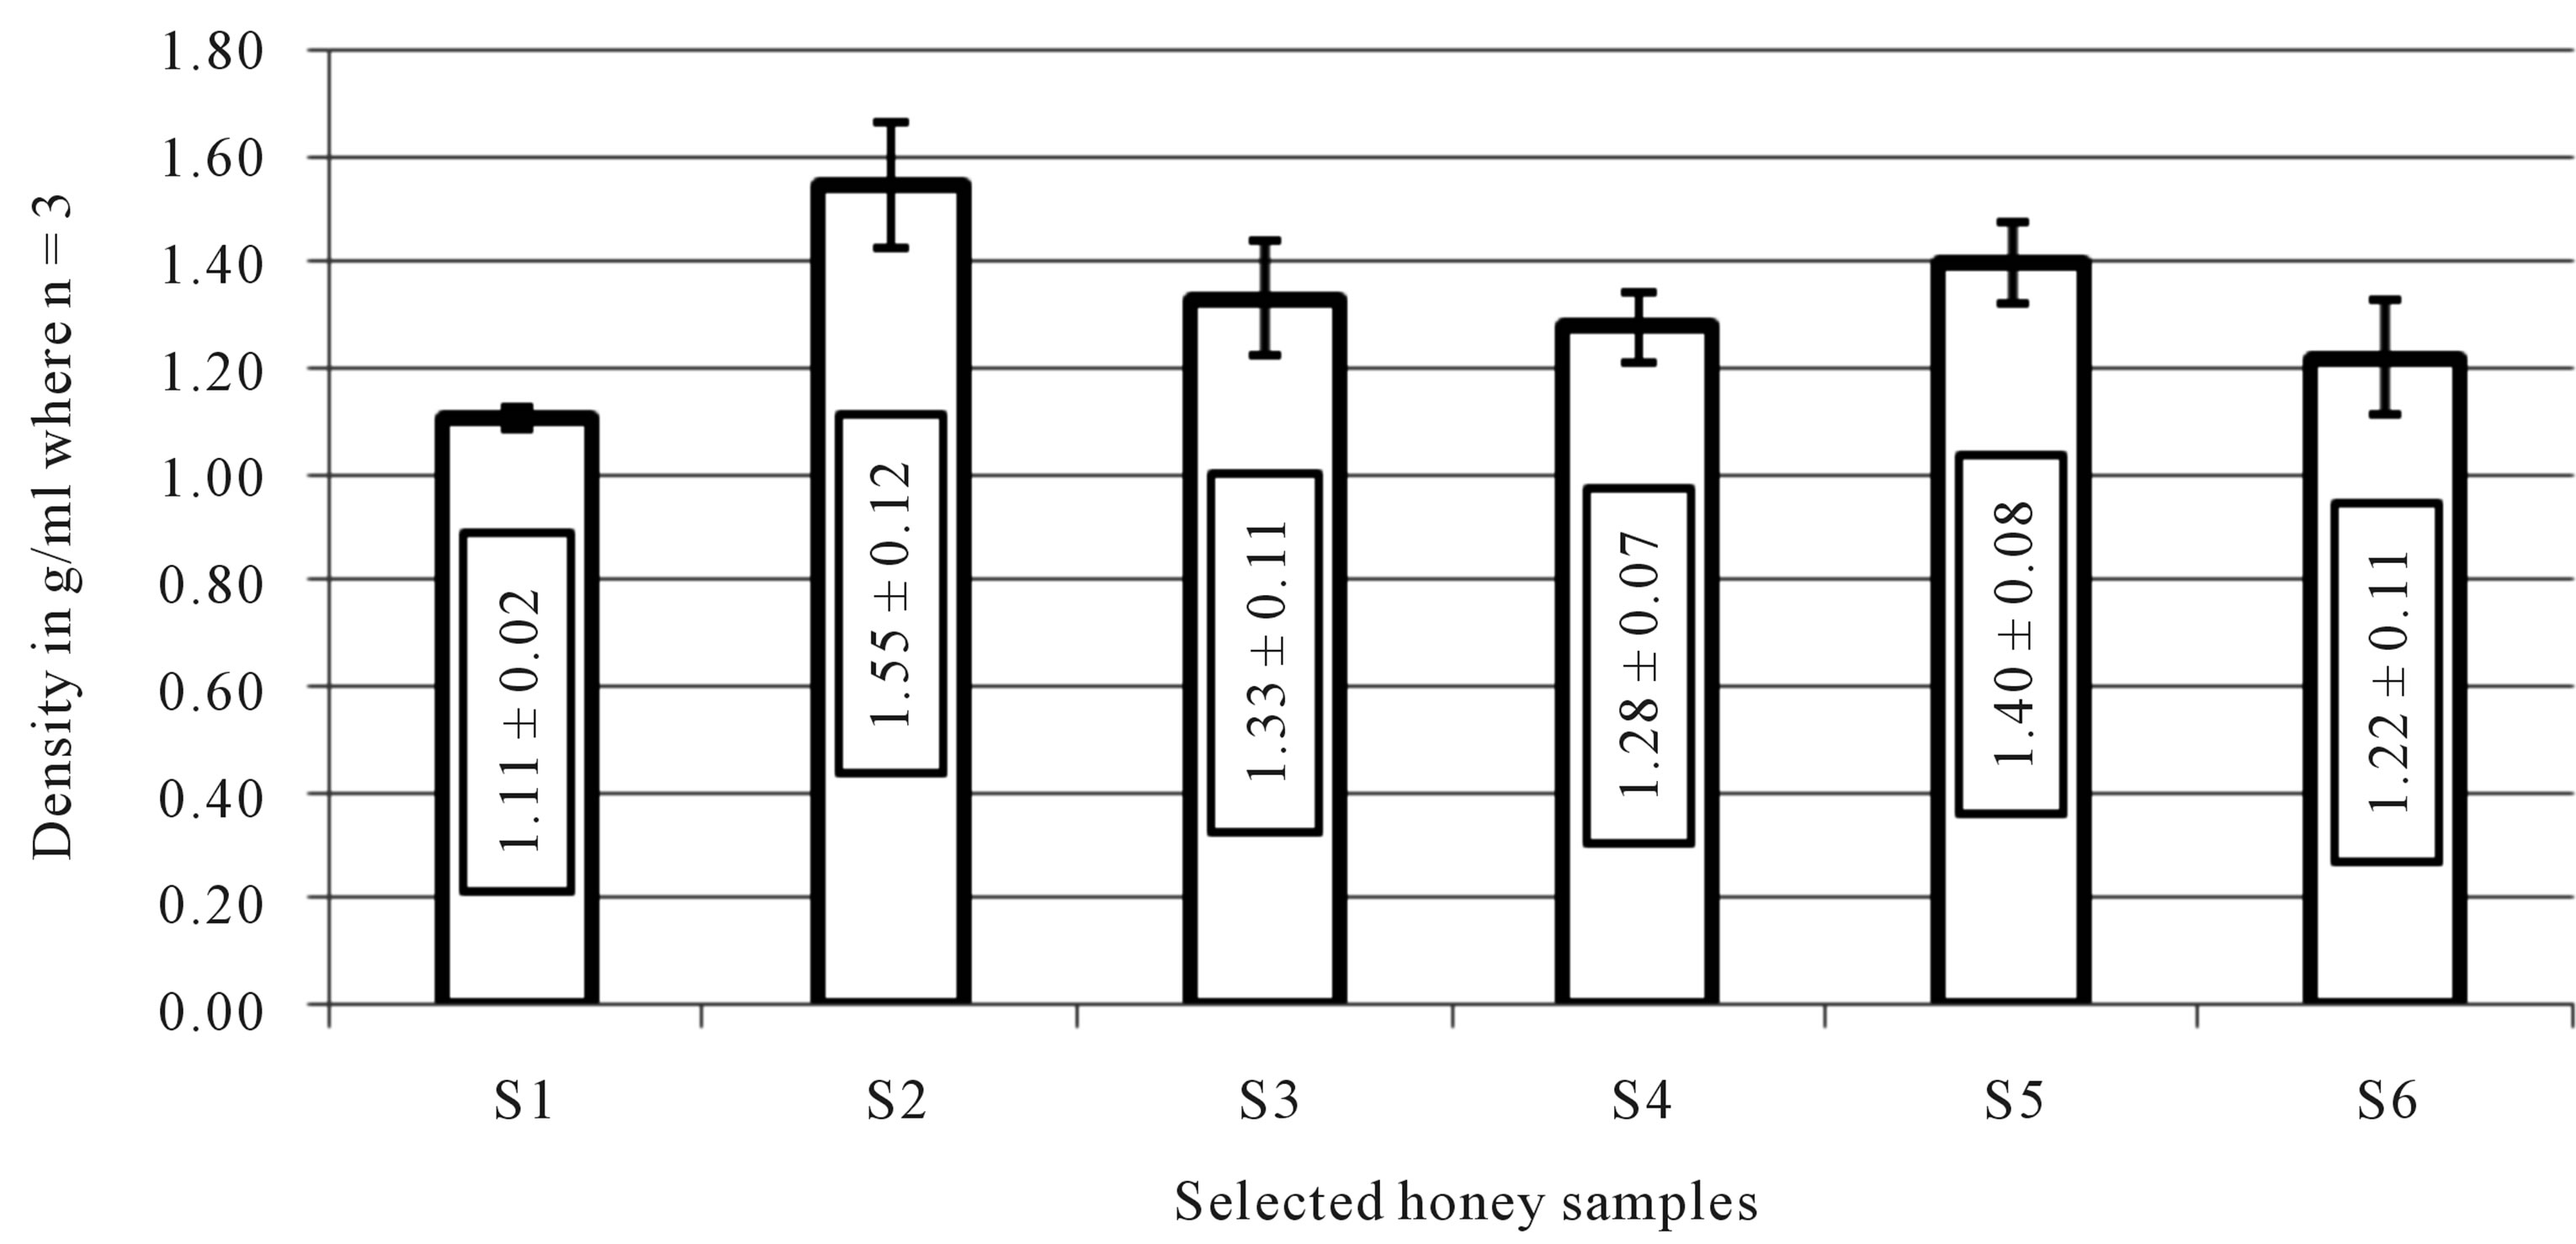
Figure 2. Density of selected honey samples.
except honey with glucose (processed) and Eucalyptus (raw) tested at LSD (Least Significant Difference) value 0.32 which were similar.
Honey with glucose (82.17 ± 0.29) contained the highest total soluble solids with honey and lemon (75.50 ± 0.00) being the least. AT P < 0.05, pure honey (processed) and Eucalyptus honey (raw) were similar in terms of total soluble solids at LSD value 0.42. Moreover, Wild pepper and Litchis honey, both raw were found to be similar. All the other honey samples showed significant difference at P < 0.05.
3.2.3. Reducing Sugar Content of the Samples
The reducing sugar content of all the honeys was high and significantly different from each other at P < 0.05 wit LSD value of 0.10. Litchis honey (S6) had the highest % reducing sugar content (60.31 ± 0.73) and least reducing sugar was 42.95 ± 0.39 in honey and lemon. All samples were distinct in terms of their reducing sugar content as shown in Figure 3.
3.2.4. Antimicrobial Bio-Assay
Results tabulated in Table 5 show interesting zone of inhibition except for fungi, no activity was observed using commercial pure honey with glucose and Standard ampicillin (Stda) at any concentration. However, raw honeys showed to be dominant in inhibiting growth of both bacteria and fungus at the same concentration used. Enteroccocus faecalis was observed to be most sensitive to the honeys used since zones of inhibition recorded ranges almost the same from 14 mm to 17 mm where no significant difference was observed among the honeys tested at (P < 0.05). Wild pepper honey had the greatest zone of inhibiton of 18 ± 0.58 mm on Staphyloccocus aureus and Commercial honey labelled as honey and lemon had the least zone of inhibition on the fungus Aspergillus niger at 6 ± 0.00 mm.

Table 4. pH of selected honeys.
During screening using stock honey sample (100%), the entire honey sample tested against Enterococcus faecalis were not significantly different at (P < 0.05) except litchis honey. All the bacteria showed inhibitory effect at 100% except the fungi Aspergillus niger and Candida albicans which had no effect or little effect using the commercial pure and glucose enriched honeys. It can be concluded that honey sample S3, S4, S5 and S6 were more sensitive in inhibition of the fungi compared to no activity with the standard ampicillin (Stda). Unlike the action of ampicillin, honeys showed to inhibit fungus. The greatest zone of inhibition was observed on Pseudomonas aeroginosa at 20 ± 1.00 mm with Eucalyptus honey and least on Candida albicans at 7 ± 0.00 mm with commercial honey with glucose as shown in Table 6.
The minimum inhibitory concentration of different honey samples are tabulated in Table 7. The inhibitory concentration ranges from 100% - 25%, with the latter being the least. For Pseudomonas aeroguinosa, treatment with litchi sample, the minimum inhibitory concentration (MIC) observed for the disc diffusion was at 100% whereas for the well diffusion it was 25%. Similarly, Wild pepper honey applied to Enterococcus faecalis and Staphylococcus aureus showed MIC of 100% in disc diffusion test compared to 50% from the well. However,
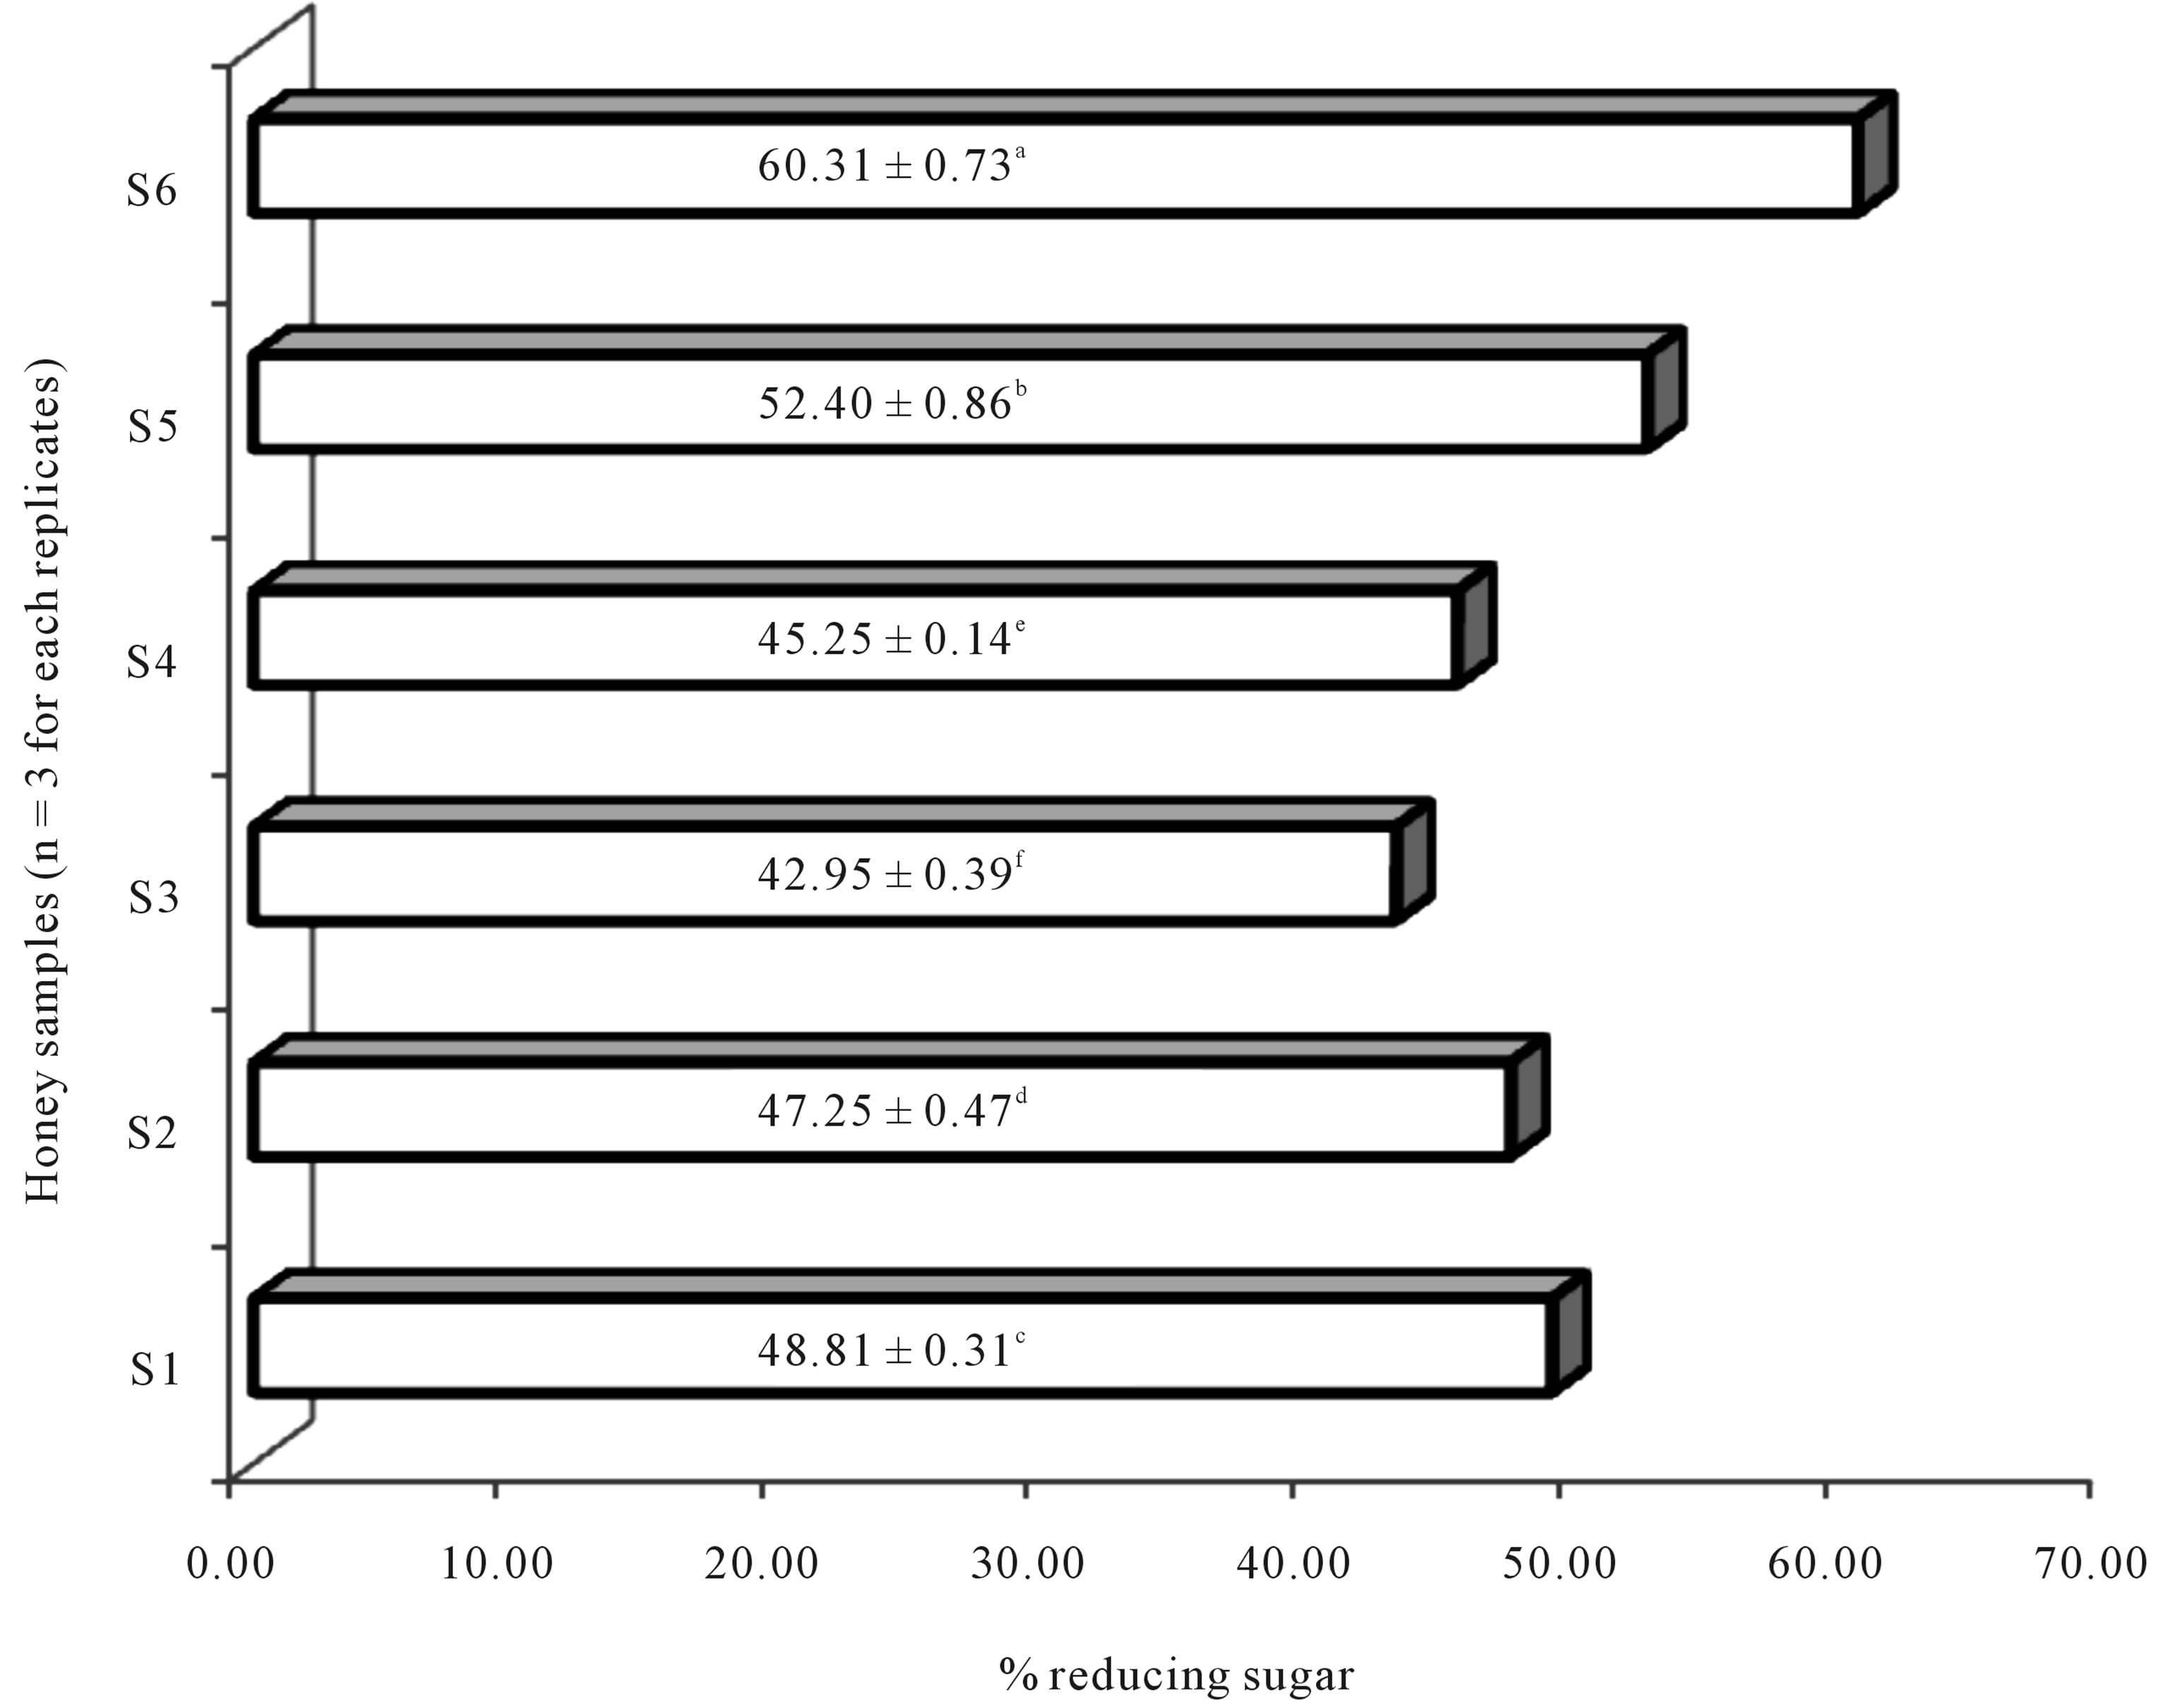
Figure 3. Reducing sugar content of selected honeys. Note: S1: Commercial honey labelled as pure honey; S2: Commercial honey labelled as honey with glucose; S3: Commercial honey labelled as honey and lemon; S4: Wild pepper honey; S5: Eucalyptus honey; S6: Litchis honey; n = 3, Least Significant Difference (LSD) = 0.10, tested at 5 % (a ≠ b ≠ c ≠ d ≠ e); Values are reported as mean ± SD.
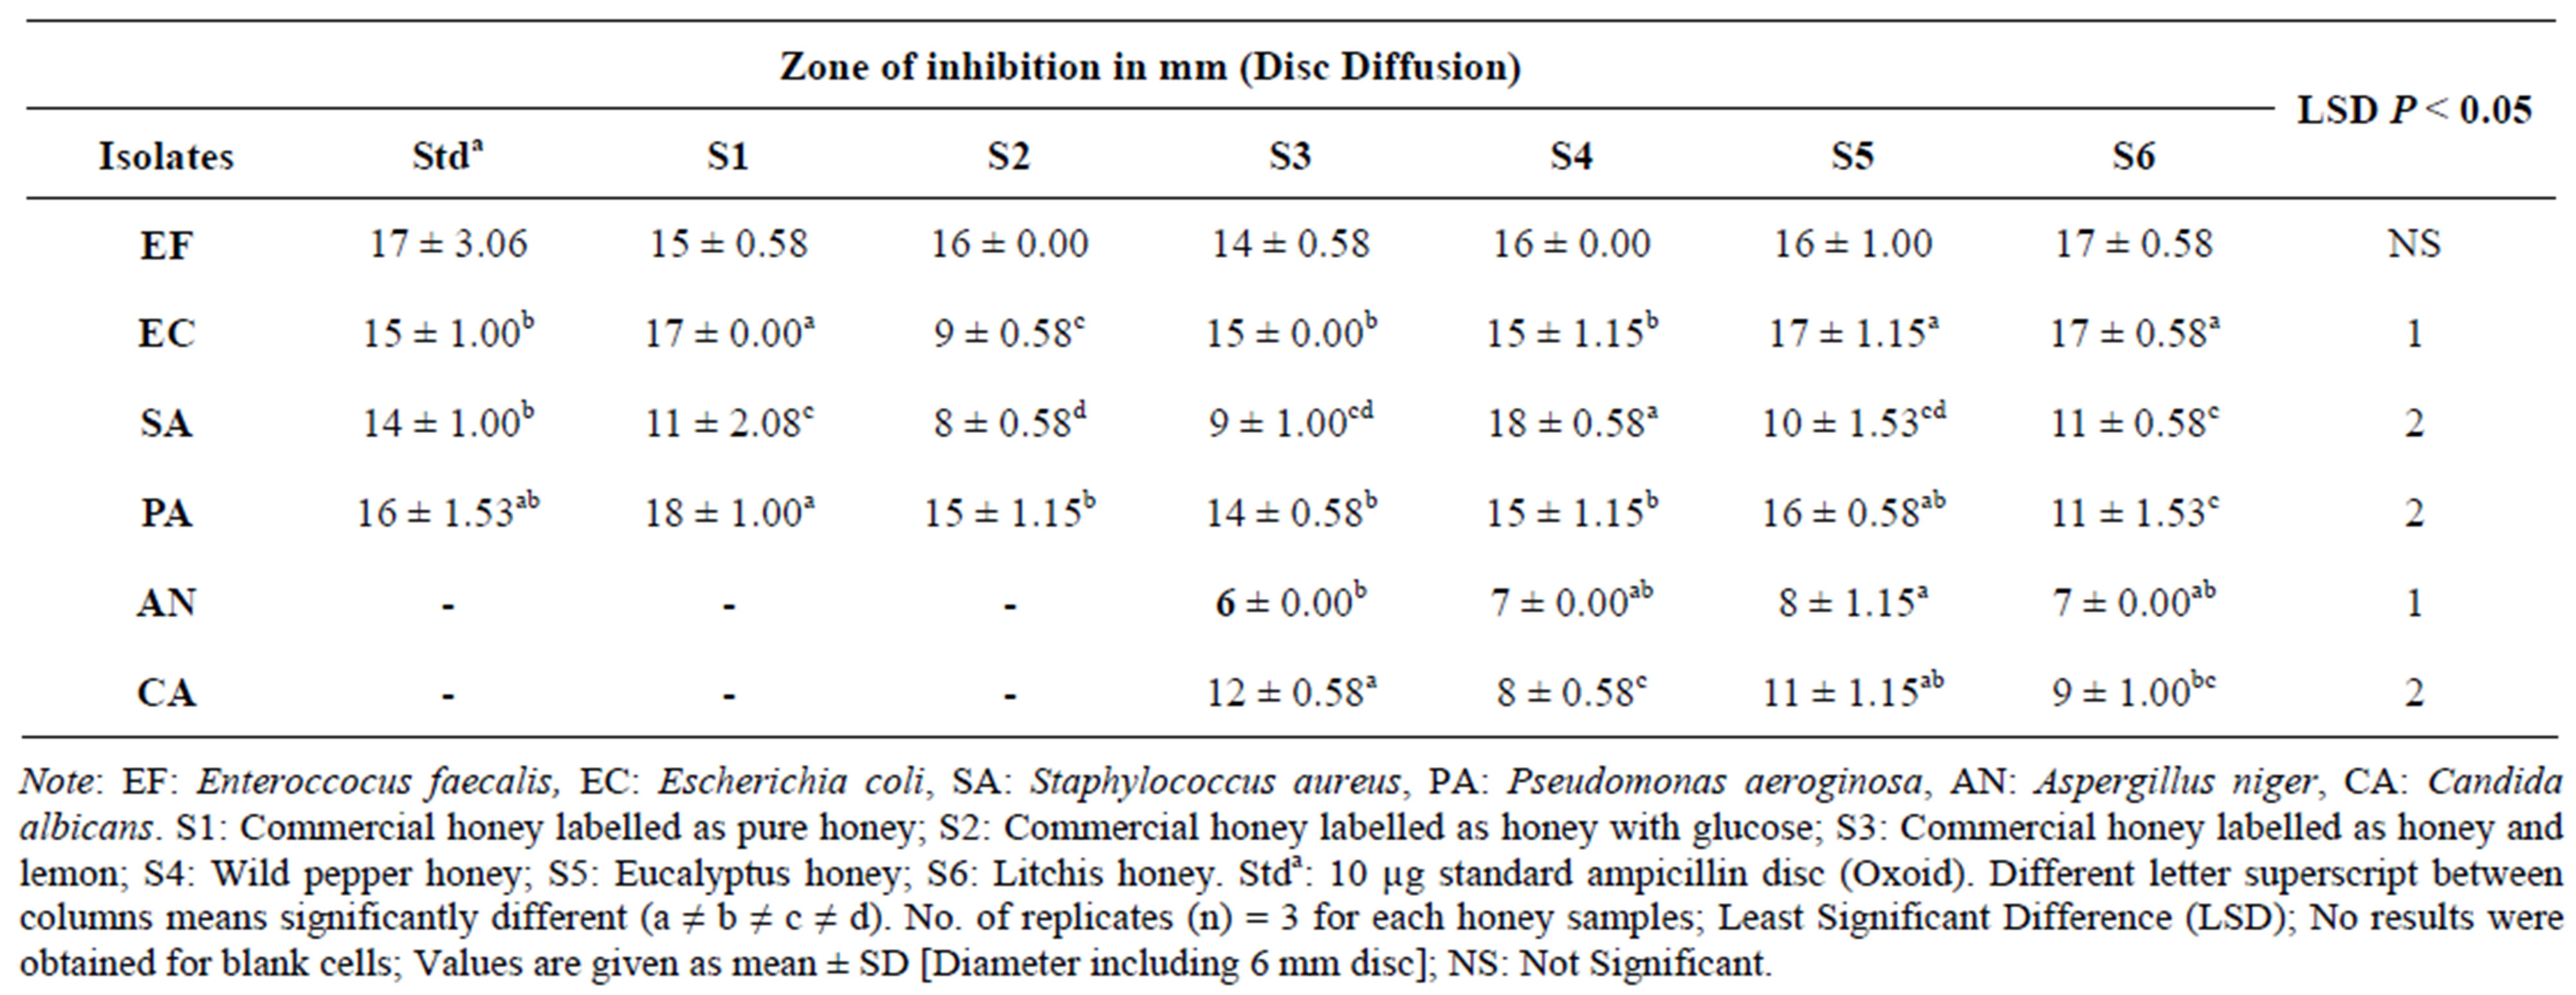
Table 5. Mean zones of inhibition for Disc diffusion in mm (100% Honey).
Eucalyptus honey activity on Enterococcus faecalis using the disc diffusion test showed 25% MIC compared to 50% on the well diffusion which can be regarded as being an exception. The minimum concentration that prevents growth of the inoculum of E. faecalis, E. coli, P. aeroginosa and C. albicans were 25% while that of S. aureus and A. niger were 50%. One average, this can conclude that the well diffusion method is much better than the disc diffusing one.
4. Discussion
Important parameters were investigated in the different honey samples in the present study. As a first step to establish data on the viscosity for Republic of Mauritius’
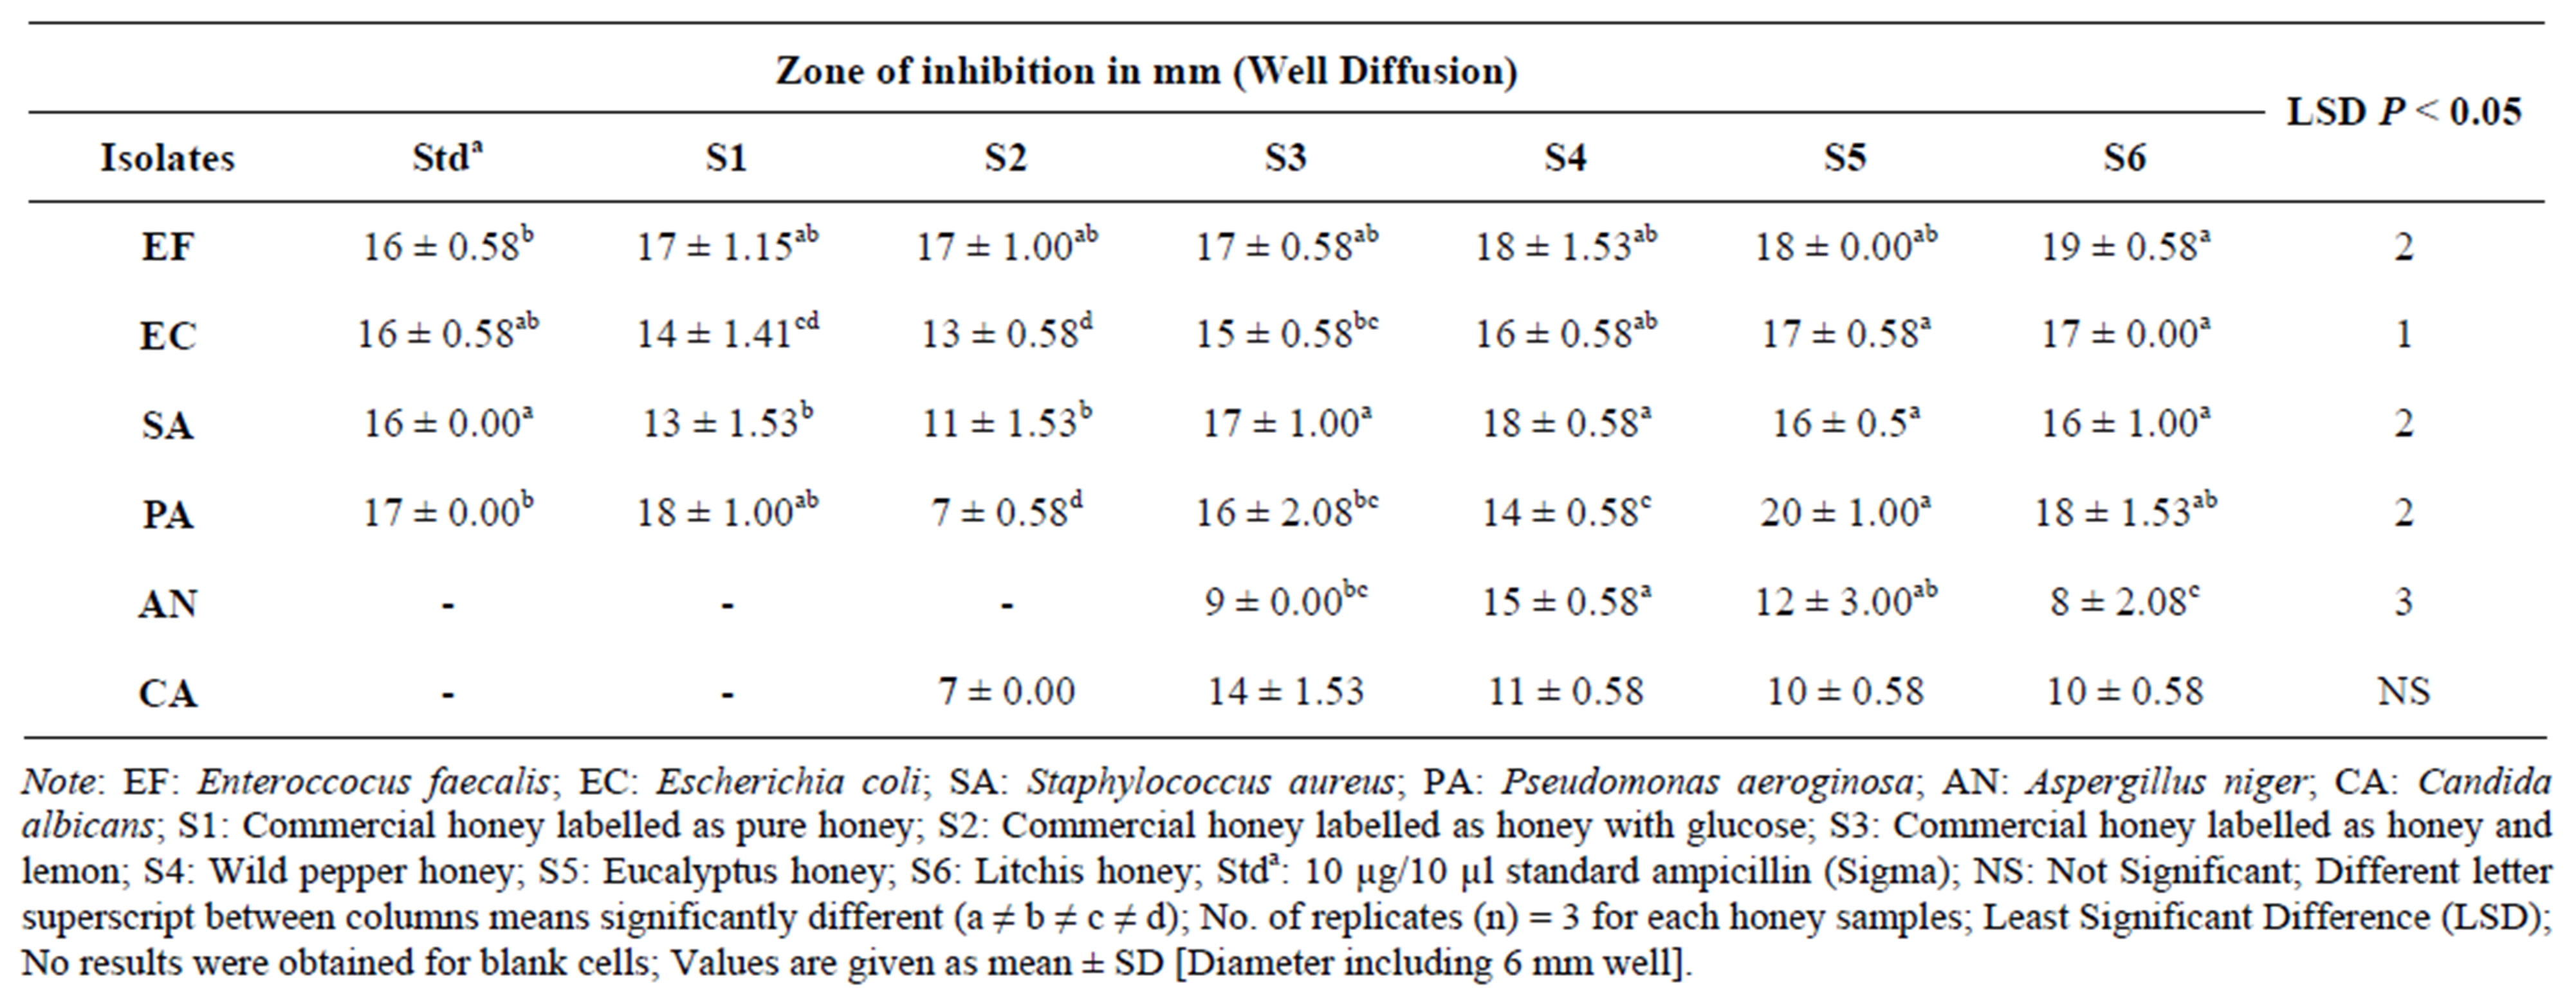
Table 6. Mean zones of inhibition for well diffusion in mm (100% Honey).
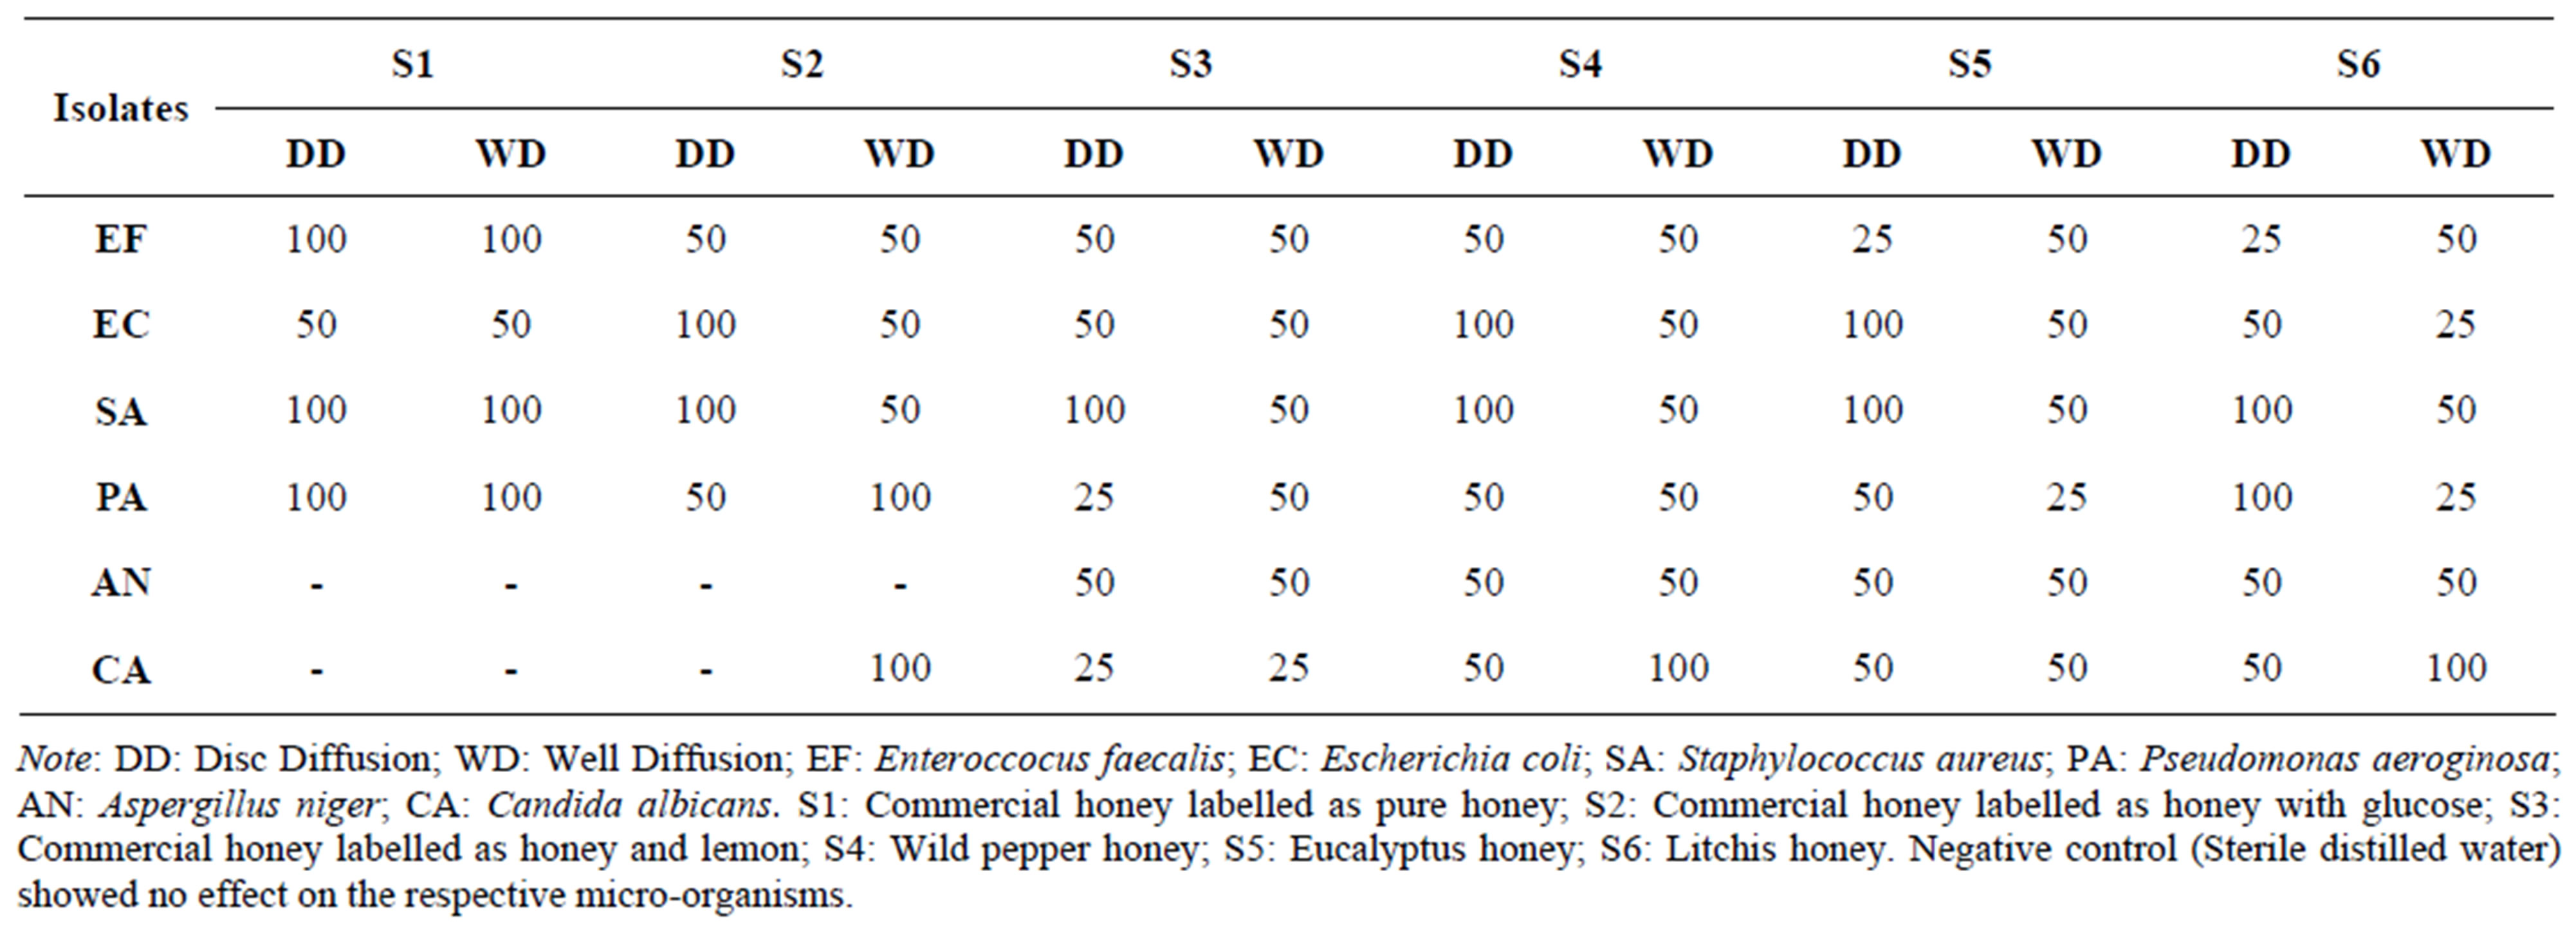
Table 7. Minimum inhibitory concentration (%) v/v of different honeys on isolates.
honeys, values obtained ranges (26.24 ± 0.23) − (0.31 ± 0.02) Pa.s at 20˚C - 45˚C. However, different in depth research conducted have revealed that Honey have different flow behaviour. For instance, Indian honey evaluated at temperature 10˚C and 30˚C with viscosities ranging 1.31 - 96.7 Pa.s showed newtonian behaviour [21]. Therefore, the Mauritian honeys addressed were not as viscous as that of the Indian honey. Unlikely the investigation of several types of German honeys revealed nonnewtonian behavior [30]. Furthermore, a research conducted by Gomez-Diaz et al. observed pseudoplastic behaviour at low shear rate values [31]. However, the present study revealed that viscosity of honey is highly dependent on the botanical and geographical origin.
Besides the influence of major content like proline and phenol, colour pigment is also significant to antioxidant activity of honey [32]. The colour intensity of honey also reflects phenolic content and correlation to its antioxidant capacity [33]. For instance, Tualang honey from Malaysia had good colour intensity with high phenolic contents [33]. From this present study, the commercially locally available honeys were found to be darker than raw honey investigated. However, the presence of amino acids acts as precursor for colour as well as aroma compounds. Commercial honey is normally blended honey subjected to pasteurisation to eliminate nuclei of sugar crystals to lower crystallisation and to increase fluidity for ease of manipulation in terms of flow characteristic. During production, processing and storage of honey; thermal or enzymatic reaction occurs. Such process leads to Maillard reaction and formation of intermediates compounds. Intermediates compounds formed are Amadori compound (1-amino-1-deoxyketose) and Heyns compound (2-amino-2-deoxyaldose). As a result there is a change in colour intensity (darkening), flavour and other properties [34]. Hence these can account for the darker colour intensity of the commercial honeys rather than high phenolic content.
Individual honey is distinct from its water-soluble antioxidants they contain. Darker coloured honey has shown to have higher antioxidant activity. A millilitre of Illinois buckwheat honey was found to contain 20 times the antioxidant activity in the same quantity of one of the lightest coloured California sage honey [35]. Ranging in order of decreasing optical density (OD) at 560 nm; pure honey 1.20, honey and lemon 0.85, honey and glucose 0.78, wild pepper honey 0.27, eucalyptus honey 0.36 and litchis honey 0.22 were obtained during this investigation. The honeys analysed were white and light amber. The nectar honey were the one recorded as white which is the same as reported by Finola et al. [36]. As depicted in Table 8 the total soluble solids of the pure commercial honey were 81.33˚Brix compared to the maximum of 82.17˚Brix in honey and glucose sample. Unlike ShibeDodoma honey, it was reported that the highest colour measured at OD 460 nm correlates to the highest suspended colloid present among other sample [20]. Colour spectrum emanating from honey is due to derivatives of nectar source [37].
Colour grading has been used by the honey industry for many years. Metamorphose by the panoply of floral nectarines; honey reveals an array of shades almost from colourless to deep amber to dark molasses. Liquid or solid, an excellent honey should be presented as a unicolour robe, clear and residue free. The glittering spectrum of honey is highly dependent upon the botanical origin. For instance honey like, rosemary, acacia, litchi, eucalyptus, lavender, colza are classified as lighter honey whereas wild pepper, ivy, metcalfa, pine, oak and buckwheat are amber to dark [38].
Density is an important parameter of practical importance. The specific gravity of honey is 50% greater than density of water [39]. As a result, this difference in density can at time leads to stratification of honey in large storage container. Recourse to thorough mixing could
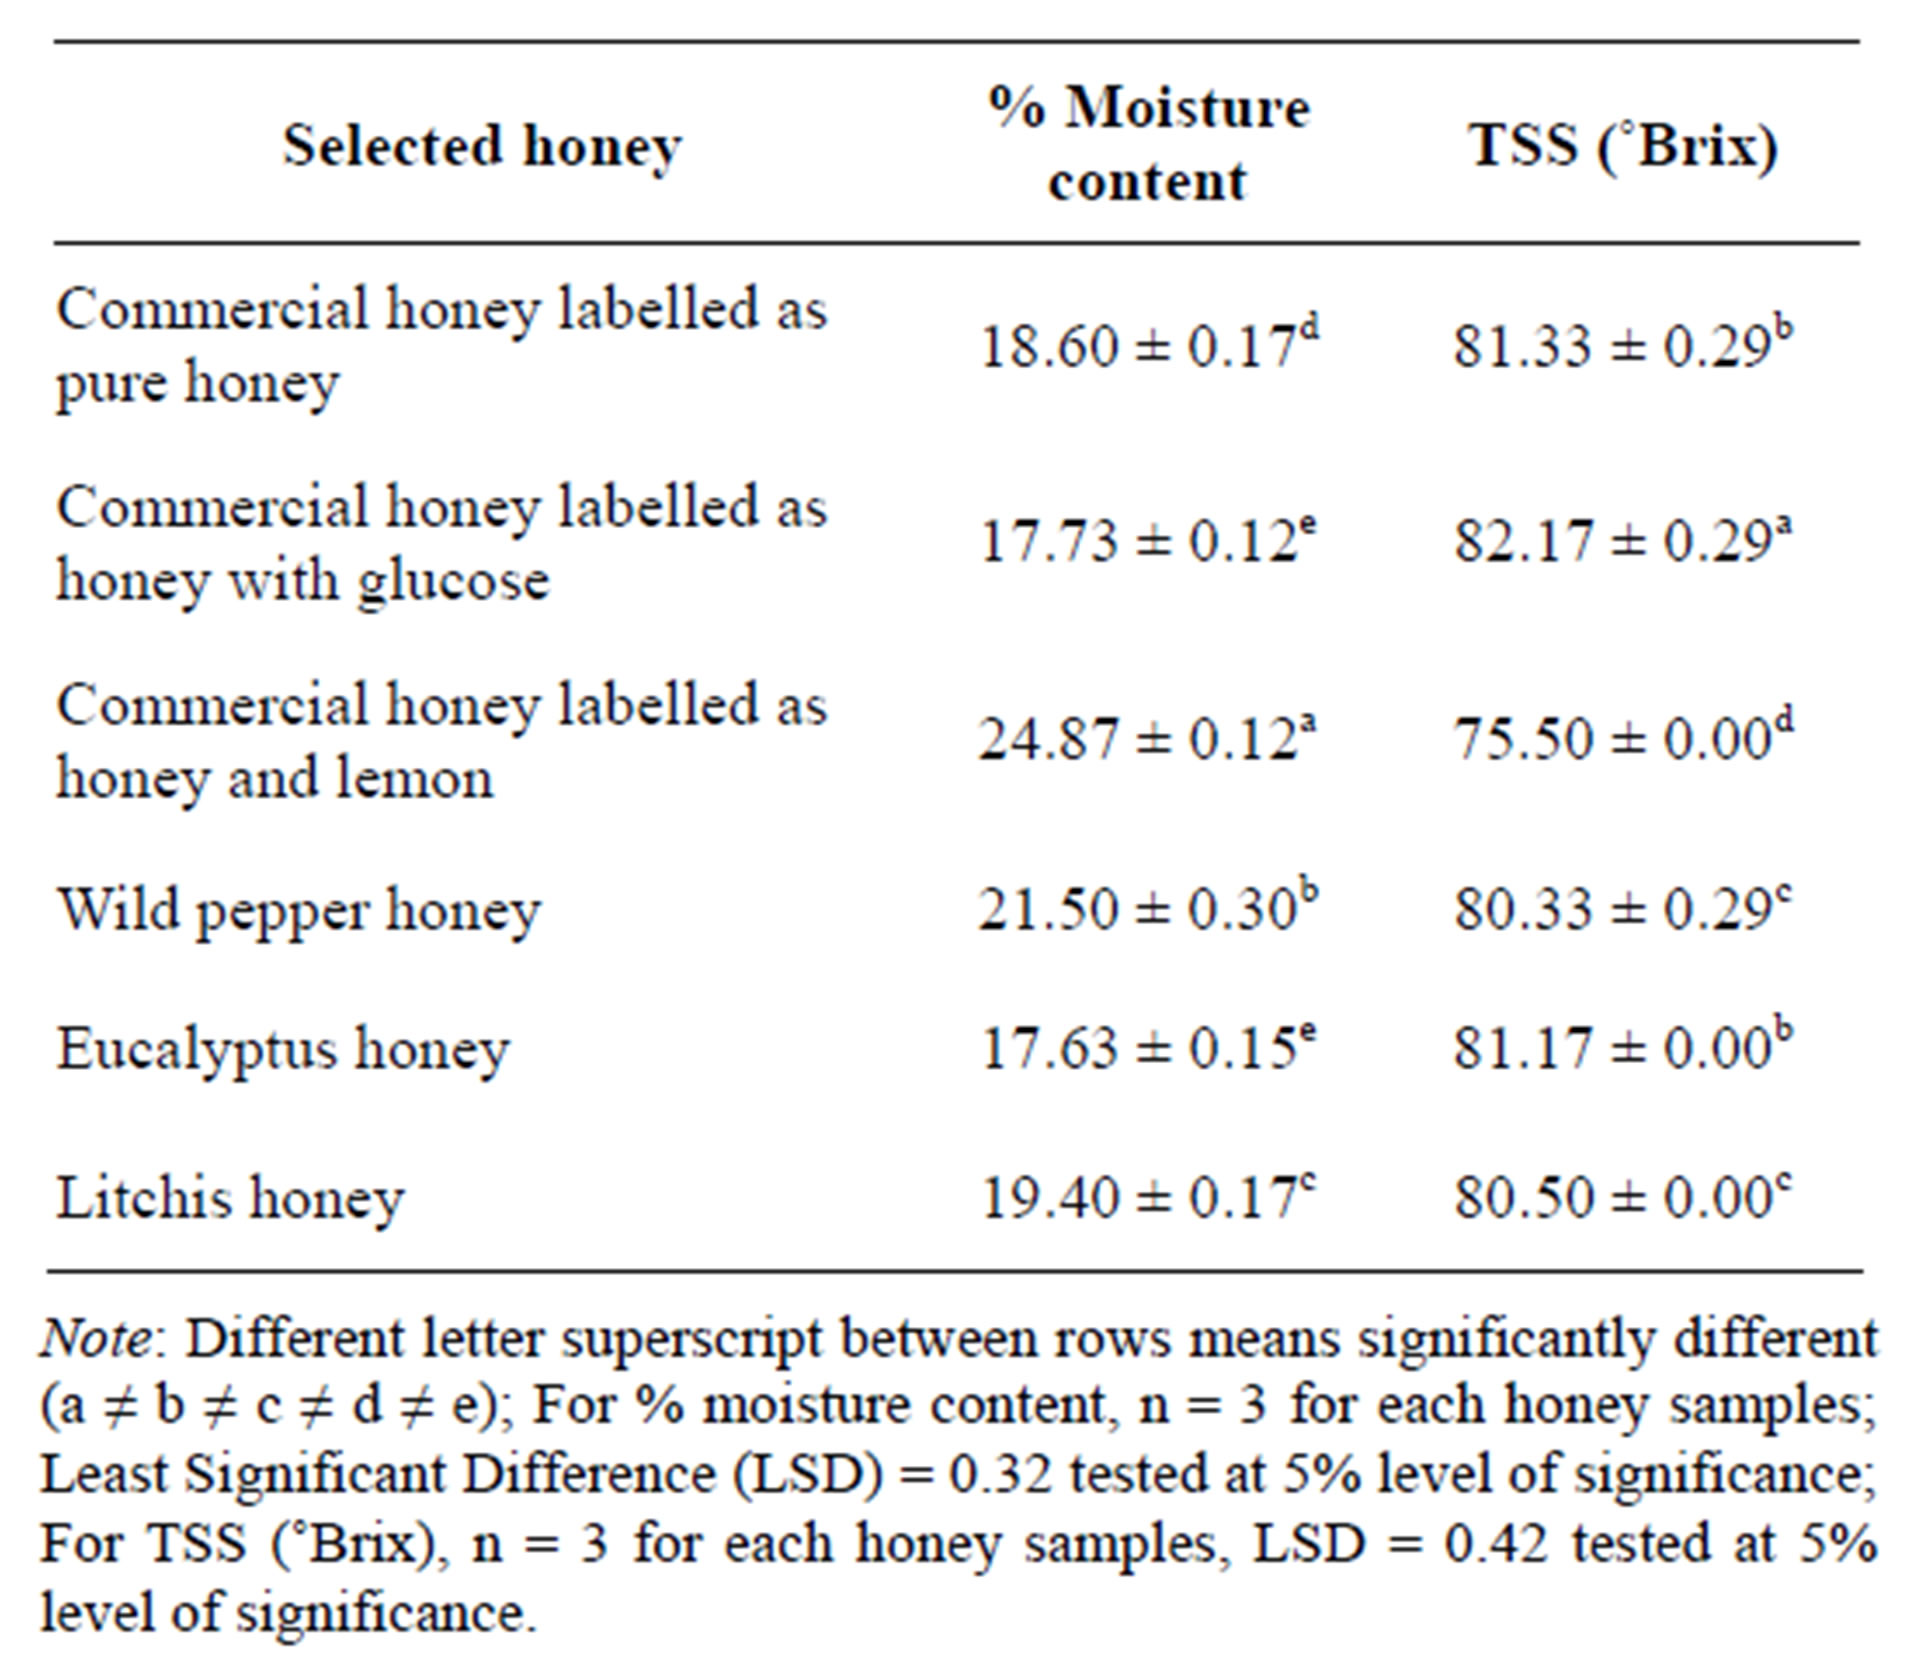
Table 8. % Moisture content and TSS (˚Brix).
avoid such separation. During this present research, glucose enriched honey had the highest density of 1.55 g/ml. Furthermore, eucalyptus honey density obtained was 1.40 g/ml which reflects same as honey from the United Arab Emirates honey [40]. Published report tends to indicate that the typical pH of honey should lies within the range of 3.3 - 5.6 [10]. The pH of honey samples investtigated here varied from 3.28 - 4.67, honey and lemon being the lowest and wild pepper the highest. According to these values, both commercially and raw honey were within limits. The growth of some species of bacteria is inhibited since pH of honey is low enough. However, this acidity may be diluted or neutralised in-vivo by the buffering of liquids fluids [41].
Several factors in honey have been reported to influence inhibition of bacteria and fungus. The carbohydrates concentration, low pH, hydrogen peroxide, enzymes or other minute’s components present may all show antimicrobial activity [28]. The antimicrobial properties of honey produced by the Apis mellifera have been extensively studied [7]. Data from this study showed that all tested honeys had some antibacterial and antifungal properties at any concentration ranging from 100% - 25% (v/v). Honey other than commercially available antibacterial honeys like manuka (Leptopsermum scoparium) honey can have equivalent antibacterial activity on certain clinical isolates [42]. In contrast to the activity of the respective honey samples used in this present study, the zone of inhibition observed against the gram positive and negative bacteria and that among the fungus were significant at 100%. The only exception is that no significant difference was observed in between all the honey samples on the bacteria Enterococcus faecalis using the disc diffusion method and on Candida albicans for the well diffusion which indicates that the honeys used almost behave more or less the same on these organisms. The diffusing power of the well diffusion methods was better compared to the disc one referring to Figure 4. Minutes particle in honey tend to migrate more easily in the well diffusion assay to influence the action of the micro-organisms. Honey tested by Lusby et al. had no activity on Candida albicans [42]. In contrast, Mauritian honey investigated showed that the well diffusion method for Candida albicans showed inhibition of 7 ± 0.00 mm diameter using honey with glucose unlike disc diffusion assay where no results was apparent at concentration of 100% (v/v). The most sensitive microorganism with the undiluted honey samples was Pseaudomonas aeroguinosa with eucalyptus honey and litchis honey on Enterococcus faecalis using the well diffusion methods. Using the agar diffusion method, on average, wild pepper honey was found to be more effective against inhibition of the different clinical isolates. The peaks of inhibition for the well diffusion assay were higher all together. A
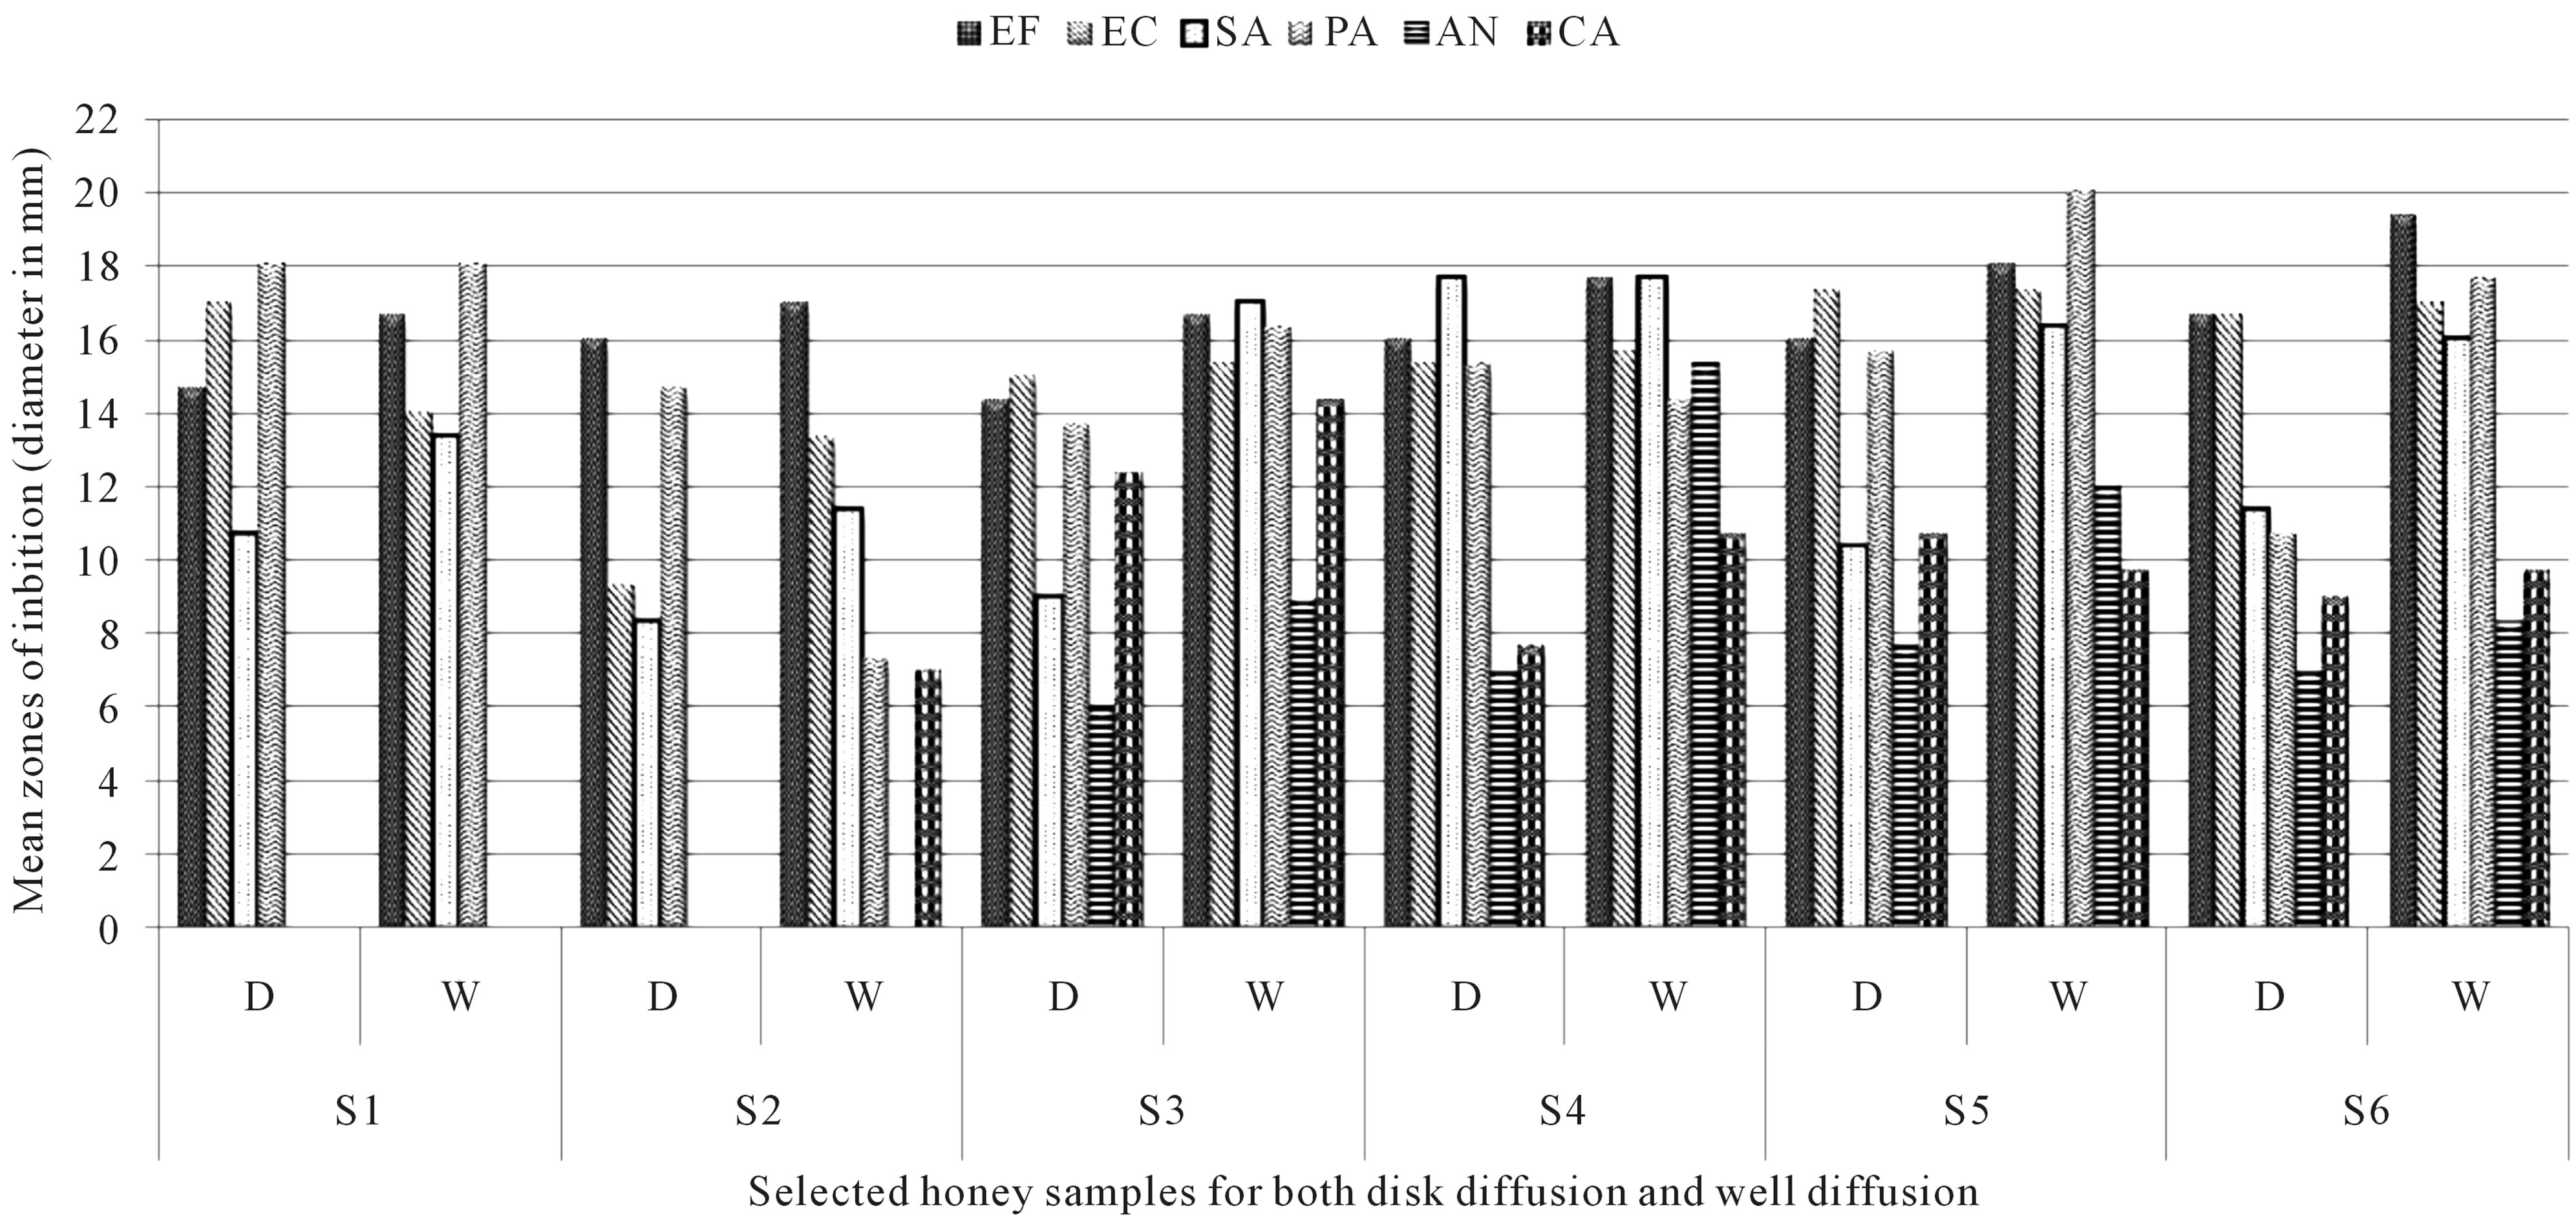
Figure 4. Comparative mean zones of inhibition for disc and well diffusion (100% conc.). Note: EF: Enterococcus faecalis; EC: Escherichia coli; SA: Staphyloccus aureus; PA: Pseudomonas aeroguinosa; AN: Aspergillus niger; CA: Candida albicans; D: Disc diffusion method; W: Well diffusion method.
review made on functional properties of honey, propolis, and royal jelly stated that the antioxidant activity is primarily associated with the presence of phenolic compounds and flavonoids [43]. Mauritian honeys have significantly high phenolics, flavonoids and antioxidant activities [44]. Additionally, the concept of generalising the honey sample among the clinical isolates might not be well solicited. Some honey samples have showed to be more effective on specific clinical isolates than others.
The MIC of processed honeys—pure honey, honey and glucose, honey and lemon and raw honey—wild pepper honey, litchi honey and eucalyptus honey against gram positive bacteria; Enteroccocus faecalis, Staphylococcus aureus, gram negative bacteria; Escherichia coli, Pseudomonas aeroguinosa and fungus; Aspergillus niger and Candida albicans were evaluated. General interpolation of the study reveals that Pseudomonas aeroguinosa had the greatest zone of inhibition and was more sensitive. Similar effect was observed but at lower MIC ranges 10% - 20% (w/v) [45]. Moreover, bacteria were more susceptible than fungus. Gram-negative cells have a complex cell wall containing an outer membrane and a middle membrane made of peptidoglycan. Gram-positive cells on the other hand have a thicker cell wall consisting of several mucopeptide and mainly two types of teichoic acid [46]. Compared to bacteria, yeast are able to grow even at low pH. However, the low pH of honey during this research might have inhibited the growth of Aspergillus niger and Candida albicans. Other intrinsic factors like hypertonic of sugar, high osmolarity could have also contributed to the antimicrobial effect of honey [47]. Zone of inhibition observed on Pseudomonas aero -guinosa was greater than other pathogens tested in the present study since gram-negative bacteria are more sensitive than gram-positive bacteria [46]. The action of enzymes glucose oxidase when diluted generates hydrogen peroxide. The anti-bacterial activity of honey also depends on hydrogen peroxide as well as methyglyoxal (MGO), and bee defensin-1 [48].
5. Conclusions
Both locally and commercially available honey showed significant antibacterial and antifungal activities which revealed its efficacy of broad spectrum. In the light of this present research, it can be asserted that honey in its most concentrated form is very efficient against the clinical isolates tested. Promising results were obtained and reveals that locally available honey had greater potential in inhibiting growth of the clinical isolates compared to honeys tested in other countries. Moreover, it was found that bacteria were more sensitive upon treatment of honey compared to the fungi. The comparative assays used for the microbial susceptibility testing was more prominent for the well diffusion. As a result, higher zones of inhibitions were observed in contrast to the disc susceptibility testing. The methods employed clearly showed that zone of inhibitions does not only depends on antibacterial activity but also on the rate of diffusion of antibacterial factors through the agar matrix. Additionally, when the zone of inhibition of standard ampicillin was compared with the undiluted honeys, it was found to have lesser effects. It might be suggested that the high sugar content, low pH, low water content and high total soluble solids all contributed to the significance inhibitions of the clinical isolates.
6. Recommendation
In line to further add to the Mauritian honey profile, further in depth studies should be geared to determine the type of flow characteristics of honey, the broad honeys available should be exploited and in-vivo studies would be a further milestone in the recognition of Mauritian honeys to achieve medical grade.
7. Acknowledgements
The support of the technical staff of the Botany Department of the Faculty of Agriculture, in particular Mrs A. Issany and those of the Department of the Faculty of Science, University of Mauritius, are gratefully acknowledged.
REFERENCES
- World Health Organisation, “Containing Antimicrobial Resistance: A Renewed Effort,” Bulletin of the World Health Organization, Vol. 88, No. 12, 2010, pp. 877-953. http://www.who.int/bulletin/volumes/88/12/10-084236/en
- E. R. Choffnes, D.A. Relman and A. Mack, “Antibiotic Resistance: Implications for Global Health and Novel Intervention Strategies,” Workshop Summary, National Aca -demies Sciences, Washington DC, 2010. http://www.ncbi.nlm.nih.gov/books/NBK45639/pdf/nap12925.pdf
- World Health Organisation, “Traditional Medcines,” Media Centre, No. 134, 2008.
- D. P. Mohapatra, V. Thakur and S. K. Brarl, “Antibacterial Efficacy of Raw and Processed Honey,” Biotechnology Research International, Vol. 2011, 2011, pp. 1-6. doi:10.4061/2011/917505
- R. Jenkins, N. Burton and R. Cooper, “Effect of Manuka Honey on the Expression of Universal Stress Protein A in Meticillin-Resistant Staphylococcus aureus,” International Journal of Antimicrobial Agents, Vol. 37, No. 4, 2011, pp. 373-376. doi:10.1016/j.ijantimicag.2010.11.036
- R. T. Cursons, “The Post-Antibiotic Effect of Manuka Honey on Gastrointestinal Pathogens,” International Journal of antimicrobial Agents, Vol. 36, No. 5, 2010, pp. 467-482. doi:10.1016/j.ijantimicag.2010.06.046
- J. Irish, D. E. Carter, S. E. Blair and T.A. Heard, “Antimicrobial Activity of Honey from the Australian Stingless Bee Trigona carbonaria,” Journal of Antimicrobial Agents, Vol. 32, No. 1, 2008, pp. 89-98. doi:10.1016/j.ijantimicag.2008.02.012
- S. Kumari, K. Harjai and S. Chhibber, “Topical Treatment of Klebsiella Pneumoniae B5055 Induced Burn Wound Infection in Mice Using Natural Products,” Journal of Infection in Developing Countries, Vol. 4, No. 6, 2010, pp. 367-377.
- S. S. Zaid, S. A. Sulaiman, K. N. M. Sirajudeen and N. H. Ortman, “The Effects of Tualang Honey on Female Reproductive Organs, Tibia Tone and Hormonal Profile in Ovariectomised Rats-Animal Model for Menopose,” BMC Complementary and Alternative Medicine, Vol. 10, No. 82, 2010. doi:10.1186/1472-6882-10-82
- P. L. Conway, R. Stem and L. Tran, “The Value-Adding Potential of Prebiotic Components of Australian Honey,” Rural Industries Research and Development Corporation, Barton, Australia, 2010.
- A. Giorgi, M. Madeo, J. Baumgartner and G. C. Lozzia, “The Relationships between Phenolic Content, Pollen Diversity, Physicochemical Information and Radical Scavenging Activity in Honey,” Mololecules, Vol. 16, No. 1, 2011, pp. 336-347. doi:10.3390/molecules16010336
- A. N. Fauzi, M. N. Norazmi and N. S. Yaacob, “Tualang Honey Induces Apoptosis and Disrupts the Mitochondrial Membrane Potential of Human Breast and Cervical Cancer Cell Lines,” Food and Chemical Toxicology, Vol. 49, No. 4, 2011, pp. 871-878. doi:10.1016/j.fct.2010.12.010
- M. E. Conti, J. Stripeikis, L. Campanella, D. Cucina and M. B. Tudino, “Characterization of Italian Honeys (Marche Region) on the Basis of Their Mineral Content and Some Typical Quality Parameters,” Chemistry Central Journal, Vol. 1, No. 14, 2007, pp. 14. doi:10.1186/1752-153X-1-14
- O. Celechovska and L. Vorlova, “Groups of Honey- Physico-Chemical Properties and Heavy Metals,” Acta Veterinaria Brno, Vol. 70, No. 1, 2001, pp. 91-95. doi:10.2754/avb200170010091
- C. A. C, “Codex Standard for Honey,” FAO Agricultural Services Bulletin, Value Added Products from Beekeeping, Agriculture and Consumer Protection Department, Rome, 1996. http://www.fao.org/docrep/w0076e/w0076 e30.htm
- Central Statistics Office, “Statistics on Food and Agricultural Imports Trade Data for Agricultural Products,” Agricultural Information Division, Ministry of Agro Industry and Food Security, Mauritius, 2009.
- R. Belmin, “Intérêt, Faisabilité, et Modalités de Mise en Place d’Une Indication Géographique pour le Miel de Rodrigues,” Ecole Nationale Supérieure d’Agronomie et des Industries Alimentaires, Ile de la Réunion, 2010.
- K. Helrich, “Official Methods of Analysis of AOAC INTERNATIONAL,” AOAC INTERNATIONAL, Gaithersburg, 1990.
- H. Tavakolipur and A. K. Ashtari, “Rheology of Selected Persian Honeys,” International Journal of Food Engineering, Vol. 6, No. 3, 2010. doi:10.2202/1556-3758.1799
- A. B. Gidamis, B. E. Chove, N. B. Shayo, S. A. Nnko and N. T. Bangu, “Quality Evaluation of Honey Harvested from Selected Areas in Tanzania with Special Emphasis on Hydroxymethyl Furfural (HMF) Levels,” Plant Foods for Human Nutrition, Vol. 59, No. 3, 2004, pp. 129-132. doi:10.1007/s11130-004-0020-7
- J. S. Kumar and M. Mandal, “Rheology and Thermal Properties of Marketed Indian Honey,” Nutrition & Food Science, Vol. 39, No. 2, 2009, pp. 111-117. doi:10.1108/00346650910943217
- United State Department of Agriculture, “United States Standards for Grades of Extracted Honey,” United State Department of Agriculture, Washington DC, 1985.
- R. S. Kirk and R. Sawyer, “Pearson’s Composition and Analysis of Foods,” 9th Edition, Longman Scientific and Technical, Essex, 1991.
- International Standard Organisation, “Fruit and Vegetable Products—Determination of Soluble Solids—Refractometric Method,” 2nd Edition, International Organisation for Standardisation, Geneva, 1998.
- O. Sherlock, A. Dolan, R. Athman, A. Power, G.Gethin , S. Cowman and H. Humphreys, “Comparison of the Antimicrobial Activity of Ulmo Honey from Chile and Manuka Honey Against Methicillin-Resistant Staphylococcus aureus, Escherichia coli and Pseudomonas aeroginosa,” BMC Complementary and Alternative Medicine, Vol. 10, No. 47, 2010. doi:10.1186/1472-6882-10-47
- O. E. Agbagwa and N. F. Peterside, “Effect of Raw Commercial Honeys from Nigeria on Selected Pathogenic Bacteria,” African journal of Microbiology Research, Vol. 4, No. 16, 2010, pp. 1801-1803.
- A. A. Ansari and C. Alexander, “Effect of Natural Honey (Produced by African sculata in Guyana) Against Bacteria (Pseudomonas aeruginosa, Escherichia coli and Staphylococcus aureus) and Fungus (Candida albicans),” World Dairy & Food Science, Vol. 4, No. 1, 2009, pp. 73-77.
- N. J. Basson and S. R. Grobler, “Antimicrobial Activity of two South African Honeys Produced from Indigenous Leucospermum cordifolium and Erica Species on Selected Micro-Organisms,” BMC Complementary and Alternative Medicine, Vol. 8, No. 41, 2008. doi:10.1186/1472-6882-8-41
- M. F. Mahomoodally, A. Gurib-fakim and A. H. Subratty, “Screening for Alternative Antibiotics: An Investigation into Antimicrobial Activities of Medical Food Plants of Mauritius,” Journal of Food Science, Vol. 75, No. 3, 2010, pp. 173-177. doi:10.1111/j.1750-3841.2010.01555.x J. Smanalieva and B. Senge, “Analytical and Rheological Investigations into Selected Unifloral German Honey,” European Food Research and Technology, Vol. 1, No. 7, 2009, pp. 107-113. doi:10.1007/s00217-009-1031-2
- D. Gomez-Diaz, J. M. Navaza and L. C. Quintans-Riveiro, “Rheological Behaviour of Galician Honeys,” The Journal of European Food Research and Technology, Vol. 222, No. 3-4, 2006, pp. 439-442. doi:10.1007/s00217-005-0120-0
- S. Saxena, S. Gautam and A. Sharma, “Physical, Biochemical and Antioxidant Properties of some Indian honeys,” Journal of Food Chemistry, Vol. 118, No. 2, 2010, pp. 391-397. doi:10.1016/j.foodchem.2009.05.001
- M. Mohamed, K. N. S. Sirajudeen, M. Swamy, S. Y. Nik and A. S. Siti, “Studies on the Antioxidant Properties of Tualang Honey of Malaysia,” African Journal of Traditional, Complementary and Alternative Medicines, Vol. 7, No. 1, 2010, pp. 59-63. doi:10.4314/ajtcam.v7i1.57256
- H. D. Belitz, W. Grosch and P. Schieberle, “Food Chemistry,” 4th Edition, Springer, Heidelberg, 2009.
- J. Raloff, “The Color of Honey,” Science News, Vol. 154, No. 11, 1998, pp. 170-172. doi:10.2307/4010759
- M. S. Finola, M. C. Lasagno and J. M. Marioli, “Microbiological and Chemical Characterisation of Honeys from Central Argentina,” Food Chemistry, Vol. 100, No. 4, 2008, pp. 1649-1653. doi:10.1016/j.foodchem.2005.12.046
- E. F. Phillips, “Definitions of Honey Colour Grades,” Journal of Agricultural Research, Vol. 45, No. 12, 1932, pp. 757-770.
- H. Clément, “Guide des Miels: 40 Mielsà Découvrir,” Rustica Editions, Paris, 2002.
- S. Bogdanov, “Books of Honey, Physical Properties of Honey,” Bee Product Science, Zhejiang, 2011.
- N. S. Al-Waili, M. Akmal, F. S. Al-Waili, K. Y. Saloom and A. Ali, “The Antimicrobial Potential of Honey from United Arab Emirates on Some Microbial Isolates,” Medical Science Monitor, Vol. 11, No. 12, 2005, pp. 433-438.
- M. O. Adenekan, N. A. Amusa, A. O. Lawal and V. E. Okpeze, “Physico-Chemical and Microbiological Properties of Honey Samples Obtained from Ibadan,” Journal of Microbiology and Antimicrobials, Vol. 2, No. 8, 2010, pp. 100-104.
- P. E. Lusby, A. L. Coombes and J. M. Wilkinson, “Bactericidal Activity of Different Honeys against Pathogenic Bacteria,” Archives of Medical Research, Vol. 36, No. 5, 2005, pp. 464-467. doi:10.1016/j.arcmed.2005.03.038
- M. Viuda-Martos, Y. Ruiz-Navajas, J. Fernandez-Lopez and J. A. Perez-Alvarez, “A Review: Functional Properties of Honey, Propolis, and Royal Jelly,” Journal of Food Science, Vol. 73, No. 9, 2008, pp. R117-R124. doi:10.1111/j.1750-3841.2008.00966.x
- B. S. SHAM, “Antioxidant and Flavonoid Profiles of Mauritian Honeys,” BSc (Hons) Biology Dissertation, University of Mauritius, Reduit, 2010.
- E. Halawani and M. Shohayeb, “Evaluation of the AntiBacterial Potential of Selected Honeys Available in Saudi Markets on Some Infectious and Food Spoilage Bacteria,” International Journal of Microbiological Research, Vol. 1, No. 2, 2010, pp. 45-49.
- B. Ray, “Fundamental Food Microbiology,” 3rd Edition, CRC Press, Boca Raton, 2005.
- M. S. Hassanein, M. H. Gebreel, and A. A. R. Hassan, “Honey Compared with Some Antibiotics against Bacteria Isolated from Burn-Wound Infections of Patients in Ain Shams University Hospital,” Journal of American Science, Vol. 6, No. 10, 2010, pp. 301-320.
- P. H. Kwakman, A. A. Te Velde, D. Speijer, C. M. Vandenbroucke-Grauls and S. A. Zaat, “How Honey Kills Bacteria,” Journal of Federation of American Societies for Experimental Biology, Vol. 25, No. 4, 2010, pp. 1145-1155.
NOTES
*Author Disclosure Statement: All the authors report no conflicts of interest. In addition, no competing financial interests exist.
#Corresponding author.