Open Journal of Civil Engineering
Vol.07 No.01(2017), Article ID:73887,18 pages
10.4236/ojce.2017.71002
Bilinear Model Proposal for Seismic Analysis Using Triple Friction Pendulum (TFP) Bearings
Iván Delgado, Roberto Aguiar, Pablo Caiza
Departamento de Ciencias de la Tierra y la Construcción Universidad de Fuerzas Amadas ESPE Av. Gral. Rumiñahui s/n, Quito, Ecuador
![]()
Copyright © 2017 by authors and Scientific Research Publishing Inc.
This work is licensed under the Creative Commons Attribution International License (CC BY 4.0).
http://creativecommons.org/licenses/by/4.0/


Received: August 18, 2016; Accepted: January 31, 2017; Published: February 3, 2017
ABSTRACT
An analytical model is presented for seismic analysis of triple friction pendulum bearings and validated using 81 bearing tests, each subjected to three cycles, with a duration of 12 seconds and using 250, 200 and 100 tons vertical loads. The main objective is to develop formulas for bilinear behavior using maximum, average and minimum friction coefficients to check which is the closest to the real behavior in the laboratory tests and comparatives curves plotting to observe the standard derivation. Parameters such as friction coefficients, effective stiffness, damping factor and vibration periods are analyzed to understand the structural behavior of the TPF bearings.
Keywords:
Triple Friction Pendulum Bearings

1. Introduction
Recent earthquakes have shown that, even though modern codes have limited damage to structural elements, there are significant losses in the non-structural components [1] (Zayas, 2013). Given this reality, it is important to consider structural systems such as base isolation that limits both structural and non- structural components damage, achieving structures with superior performance levels [2] [3] (Aguiar et al., 2008; Kawamura et al., 2000).
The base isolation devices are of two main types: elastomer and friction based [4] (Naeim and Kelly, 1999). The elastomers were developed and implemented first; there are three types: low damping, high damping and lead rubber bearings [5] (Constantinou et al., 2012).
The frictional devices are classified into three types: simple, double and triple concave friction pendulum bearings. The scientific research continues and a new device called fifth friction pendulum has just appeared [6] (Lee and Constantinou, 2016).
It is noteworthy that despite the advantages and existing applications [7] . (Chistopupoulus, 2006), there are limitations in the application of isolation devices, mainly for very slender and/or with many stories structures with important P-Δ effects. In addition, the seismic vertical components tend to affect non- structural elements such as ceilings. This issue has been investigated in the E- Defense Laboratory in Japan (2011).
This paper will focus on the triple friction pendulum TFP bearings, since isolation devices of this type will be placed in the new research center of the Universidad de las Fuerzas Armadas-ESPE. These devices combine friction with restoring forces created by the skin characteristics and geometry of the surface plates [8] (Fenz, 2006).
Double and triple frictional devices are called second and third generation devices respectively, and have some advantages over the first generation, such as: more compact, able to adapt its performance relative to demand, increased displacement capacity and lower speed in the movement, which prevents excessive variation in the friction coefficients. Another notable aspect of the second and third generation devices is the reduction of structural responses, thereby improving the performance of nonstructural components and elements [9] (Fenz and Constantinou, 2008).
The TFP bearings are constituted by an inner device with radius plates R2, R3, and by an exterior device with radius plates R1, R4. So that it really has two isolation devices instead of one. This allows having smaller dimensions with respect to the first and second generation and having greater displacement capacity [10] (Constantinou et al., 2016).
In the Universidad de las Fuerzas Armadas-ESPE, six buildings are being constructed with TFP type FPT8833/12-12/8-6 bearings, as shown in Figure 1. In total 81 bearings were used and also initially tested considering three vertical

Figure 1. FPT8833/12-12/8-6 used at Universidad de las Fuerzas Armadas-ESPE, in Ecuador.
loads 250, 200 and 100 tonf (EPS 2015) (Earthquake Protection Systems, Mare Island, Vallejo, California 94592-USA).
2. Three-Step Model
The curvature radius of the outer and inner plates of the TFP bearings may be different as well as the heights hi, for i = 1:4. Thereby, the displacement capacity di, may be different too. In this way, there could be up to 12 geometric conditions and 4 different friction coefficients μi in each of the plates. In this case the five-step model proposed by [9] [11] (Fenz and Constantinou, 2007, 2008) and/ or [12] (Fadi and Constantinou, 2010) is the most appropriate.
Now, in the case of the FPT8833/12-12/8-6 bearing the geometric conditions are reduced to 6 because the radius of curvature of the outer plates is equal. The same happens with the radius of the inner plates. In addition, this bearing has similar heights as shown in Figure 1. Moreover, only two friction coefficients are needed, one for the outer plates and the other for the inner plates. For these conditions, McVitty and Constantinou (2015) [13] proposed a three-step model defining horizontal displacement versus shear hysteresis curves. The equations are:
 (1)
(1)
 (2)
(2)
where Ri is the curvature radius; hi is height; Ri,eff is effective radius of curvature;  is displacement capacity. The subscript i, varies from 1 to 4. The following are the 3 steps or model regimes.
2.1. Regime I
Relative displacement occurs between plates 2 and 3.
 (3)
(3)
 (4)
(4)
where u is the lateral displacement of the bearing; F is the applied lateral force; w is the weight applied on the bearing. To the left of Figure 2, the inner moving surfaces 2 and 3 can be seen; to the right, the corresponding hysteresis diagram is shown.
2.2. Regime II
The pillow block inside the two interior plates reaches the stops and surfaces 1 and 4 start adding displacement. Normally, it is in this regime that the bearing works under an earthquake of moderate and high intensity. The governing equations are shown below. The corresponding hysteresis curve is presented in Figure 3.

Figure 2. Bearing performance in Regime I. Source: [13] (McVitty and Constantinou, 2015).

Figure 3. Bearing performance in Regime II. Source: [13] (McVitty and Constantinou, 2015).
![]() (5)
(5)
![]() . (6)
. (6)
2.3. Regime III
This regime occurs when the earthquake is extremely strong and the inner plates meet the outer stops. In these conditions, the inner pillow block begins to slide on surfaces 2 and 3. The equations are shown below. The corresponding hysteresis curve is presented in Figure 4.
![]() (7)
(7)
![]() . (8)
. (8)
3. Proposed Model
The proposed model works for Regime II. But it can also be applied to Regime I. It differs from the model proposed by [13] (McVitty and Constantinou, 2015) in the following aspects. First, there is no resistance at zero displacement, Qd. In addition, the vertical line of length 2 Qd is not considered at unloading, instead an inclined line is used as explained later.
In Figure 5(a), the model proposed by [13] (McVitty and Constantinou, 2015) for Regime II is presented. It is seen that unloading starts with a vertical line and then it continues with a line whose slope is the same as the elastic stiffness.
Now, it is proposed, as can be seen in Figure 5(b), that the unloading branch starts directly with a rigidity equal to the elastic stiffness 3. That is, a bilinear model whose friction coefficient is defined by the following equation:
![]() (9)
(9)
where μ1, μ2, are friction coefficients in the inner and outer plates respectively; μ is the equivalent friction coefficient.
The equations that define the bilineal model are:
![]() (10)
(10)
![]() (11)
(11)
![]() (12)
(12)
![]() (13)
(13)
![]() (14)
(14)

Figure 4. Bearing performance in Regime III. Source: [13] (McVitty and Constantinou, 2015).
 (a) (b)
Figure 5. Models for Regime II: (a) [13] (McVitty and Constantinou, 2015) and (b) model proposed in this paper.
where W is the vertical load on the bearing; q is the lateral displacement in the bearing, calculated in iterative form; ξeq is the equivalent damping factor; kef is the effective or secant stiffness; T is the bearing period; g is the acceleration due to gravity.
4. Experimental Results
In Figure 6(a), some of the 81 TFP bearings acquired by the Universidad de las Fuerzas Armadas-ESPE to EPS can be seen. In Figure 6(b), the transport of 4 of them on a lift truck to the test area is observed; in Figure 6(c), a bearing is observed without external protection during the test and finally, Figure 6(d) shows the hysteresis curve that relates the displacements with the lateral force in three load cycles that lasted 12 seconds each with a maximum lateral displacement around 12 inches.
The bearings were initially not centered due to shakings during their transport, so a first manual load cycle is needed to re-center the bearing (Figure 7(a)). The same happens at the end of the test where a final cycle is needed so that the bearing returns to its initial position with lateral displacement equal to zero (Figure 7(b)).
Finally, the curve that best fits the three loading cycles is calculated. Then, the friction coefficients are determined using the five regimes model of [9] [11] (Fenz and Constantinou, 2007, 2008). In Figure 8, the hysteresis curve for the TFP8833/12-12/8-6 is presented.
In Figure 8, f1 corresponds to the use of the inner surfaces coefficient of friction

 (a) (b)
 (c) (d)
Figure 6. (a) Bearings for the Universidad de las Fuerzas Armadas-ESPE; (b) Bearing transport; (c) Bearing test; (d) Hysteresis curves.
 (a)
(a)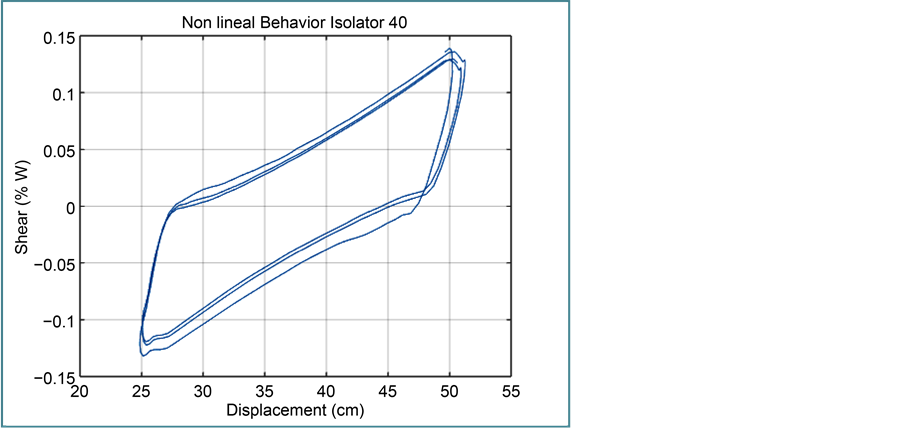 (b)
(b) (c)
(c)
Figure 7. (a) Initial exact curves due to uncentered bearing; (b) Initial curve without the first manual curve; (c) Approximation of the numerical model to the experimental results.

Figure 8. Hysteresis curve shear vs. lateral displacement (TFP8833/12-12/8-6). Source: EPS (2015).
μ2; f2, f3, to the use of the outer surfaces coefficients of friction μ1 μ4. These coefficients are determined experimentally. Using the five regimes model, EPS (2015) calculated the effective stiffness kef, the equivalent damping factor ξeq and the vibration period T associated to a lateral displacement of 12''.
5. Results
In this paper, the same parameters that EPS calculated using the five-regime model are determined for the bilineal (proposed) model. They are: the effective stiffness, the equivalent damping factor and the vibration period associated to a lateral displacement of 12''.
The database proportioned by EPS (2015) included the friction coefficients in each hysteresis cycle as well as their mean values for 81 bearings. It is important to note that 61 bearing were tested with a vertical load of 250 tonf, 10 additional bearings with a vertical load of 200 tonf and the remaining 10 bearings with a load of 100 tonf. Three types of hysteresis curves were obtained, one for mean, one for maximum and other for minimum friction coefficient values.
5.1. Friction Coefficients
In Figure 9, mean, maximum and minimum friction coefficient values found under a vertical load of 250 tonf are drawn. These values are a product of the 61 tests performed by EPS.
Figure 10 compares the friction coefficients when the vertical load is 200 and 100 tonf. These values are a product of 20 tests performed by EPS.
 (a)
(a) (b)
(b)
Figure 9. Comparison of the friction coefficients obtained under a 250 tonf vertical load, (a) Friction coefficient for the outer plates (u1): mean, maximum and minimum friction coefficients; (b) Friction coefficient for the inner plates (u2): mean, maximum and minimum friction coefficients.
5.2. Effective Stiffness
Figure 11 shows the effective stiffness when the vertical load is 250 tonf for maximum, minimum and average friction coefficient. It was found that the values found experimentally are slightly higher than those found with the proposed bilinear model. The biggest difference between the two models is less than 4%.
Figure 12 shows the effective stiffness when the vertical load is 200 tonf (at the left) and 100 tonf (at the right). The values are similar to those in Figure 11, although in some cases the proposed effective stiffness is equal to the experimental.
5.3. Equivalent Friction Coefficients
In Figure 13 and Figure 14 the damping factors found under a vertical load of

 (a)
(a)
 (b)
(b)
Figure 10. Comparison of the friction coefficients obtained under a 200 and 100 tonf vertical, (a) Friction coefficient for the outer plates (u1): mean, maximum and minimum friction coefficients; (b) Friction coefficient for the inner plates (u2): mean, maximum and minimum friction coefficients.

Figure 11. Effective stiffness when the vertical load is 250 tonf for (a) mean, (b) maximum and (c) minimum friction coefficients.

Figure 12. Effective stiffness when the vertical load is 200 (at the left) and 100 tonf (at the right) for (a) mean, (b) maximum and (c) minimum friction coefficients.
250 (61 tests), 200 (10 tests) and 100 tonf (10 tests) are presented. It is noted that the equivalent damping factor found with the proposed model is slightly greater than that found experimentally.
5.4. Vibration Period
In Figure 15, the TFP bearing periods are for the vertical load of 250 tonf, and in Figure 16, for the vertical load of 200 tonf (at the left) and 100 tonf (at the right). In numeral 6 these results are commented.

Figure 13. Equivalent friction coefficient for a vertical load of 250 tonf using (a) mean; (b) maximum and (c) minimum friction coefficients.

Figure 14. Equivalent friction coefficient for a vertical load of 200 tonf (at the left) and 100 tonf (at the right) using (a) mean; (b) maximum and (c) minimum friction coefficients.
6. Results Variation
Two points of interest are presented here, the experimental and the proposed model variations of the effective stiffness, equivalent damping factor and the vibration period. For this purpose in Tables 1-3 mean values and standard deviation data of Figures 11-16 are presented.

Figure 15. Vibration periods for a vertical load of 250 tonf using (a) mean; (b) maximum and (c) minimum friction coefficients.

Figure 16. Vibration periods for a vertical load of 200 tonf (at the left) and 100 tonf (at the right) using (a) mean; (b) maximum and (c) minimum friction coefficients.

Table 1. Effective stiffness variation.
Table 2. Damping factor variation.
Table 3. Period of vibration variation.
7. Conclusions
It is noted that the proposed bilinear model is consistent and provides an estimate of the response of the structure, which could be compatible with the comments provided by McVitty and Constantinou.
The proposed model is validated with experimental data provided by EPS, based on the TFP bearings used in the New Research Center at Universidad de las Fuerzas Armadas-ESPE.
Effective stiffness, damping and vibration periods using the proposed model with maximum, minimum and average friction coefficients values show that the bilinear analytical model is compatible with the experimental results.
Cite this paper
Delgado, I., Aguiar, R. and Caiza, P. (2017) Bilinear Model Proposal for Seismic Analysis Using Triple Friction Pendulum (TFP) Bearings. Open Journal of Civil Engineering, 7, 14- 31. https://doi.org/10.4236/ojce.2017.71002
References
- 1. Zayas, V. (2013) Seismic Isolation Desing for Resilient Building, Base Isolation Systems: Applications, Codes & Quality Control Tests. Istanbul Technical University, Istanbul.
- 2. Aguiar, R., Almazan, J.L., Dechent, P. and Suarez, V. (2008) Aisladores elastomericos y FPS, Centro de Investigaciones Cientificas. Escuela Politecnica del Ejercito ESPE, 242 p.
- 3. Kawamura, S., Sugisaki, R., Ogura, K., Maezawa, S., Tanaka, S. and Yajima, A. (2000) Seismic Isolation Retrofit in Japan. The 12th World Conferences on Earthquake Engineering (WCEE), Vol. 2523, 8 p.
- 4. Naeim, C. and Kelly, J.M. (1999) Desing of Seismic Isolation Structures. John Wiley & Sons Inc.
https://doi.org/10.1002/9780470172742 - 5. Constantinou, M.C., Sarlis, A.A., Pasala, D.T.R., Reinhorn, A.M., Nagarajaiah, S. and Taylor, D.P. (2012) Negative Stiffness Device for Seismic Protection of Structures. Journal of Structural Engineering, 139, 1124-1133.
https://doi.org/10.1061/(ASCE)ST.1943-541X.0000616 - 6. Lee, D. and Constantinou, M.C. (2016) Quintuple Friction Pendulum Isolator-Behavior, Modeling and Validation. Earthquake Spectra, 32, 1607-1626.
https://doi.org/10.1193/040615EQS053M - 7. Chistopupoulus, C. and Filiatraul, A. (2006) Principles of Passive Supplemental Damping and Seismic Isolation. IUSS Press, Instituto Universitario di Studi Superiori di Pavia, Pavia, IT.
- 8. Fenz, D. and Constantinou, M.C. (2006) Behavior of Double Concave Friction Pendulum Bearing. Earthquake Engineering and Structural Dynamics, 35, 1403-1424.
https://doi.org/10.1002/eqe.589 - 9. Fenz, D.M. and Constantinou, M.C. (2008) Development, Implementation and Verification of Dynamic Analysis Models for Multi-Spherical Sliding Bearings. Report No. MCEER-08-0018, Multidisciplinary Center for Earthquake Engineering Research, Buffalo, NY.
http://mceer.buffalo.edu/publications/catalog/reports/Development-Implementa-tion-and-Verification-of-Dynamic-Analysis-Models-for-Multi-Spherical-Sliding-Bearings-MCEER-08-0018.html - 10. Constantinou, M., Aguiar, R., Morales, E. and Caiza, P. (2016) Desempeno del aislador FPT8833/12-12/8-5 en el analisis sismico del Centro de Investigaciones y de Post Grado de la UFA-ESPE. Revista Internacional de Ingeniería de Estructuras, 21, 1-25.
http://www.riie.espe.edu.ec - 11. Fenz, D. and Constantinou, M. (2007) Mechanical Behavior of Multi-Spherical Sliding Bearings. Technical Report MCEER-08-0007, Multidisciplinary Center for Earthquake Engineering Research.
http://mceer.buffalo.edu/publications/catalog/reports/Mechanical-Behavior-of-Multi-Spherical-Sliding-Bearings-MCEER-08-0007.html - 12. Fadi, F. and Constantinou, M. (2010) Evaluation of Simplified Methods of Analysis for Structures with Triple Friction Pendulum Isolators. Earthquake Engineering and Structural Dynamics, 39, 5-22.
- 13. McVitty, W.J. and Constantinou, M.C. (2015) Property Modification Factors for Seismic Isolators: Design Guidance for Buildings. Technical Report No. MCEER-15-0005, Multidisciplinary Center for Earthquake Engineering Research, State University of New York at Buffalo, Buffalo, NY.
http://mceer.buffalo.edu/publications/catalog/reports/Property-Modification-Factors-for-Seismic-Isolators-Design-Guidance-for-Buildings-MCEER-15-0005.html