Modern Mechanical Engineering
Vol.07 No.04(2017), Article ID:80360,14 pages
10.4236/mme.2017.74008
Numerical Simulation on the Comb Drive Micro-Accelerometer
Xiangyi Zhao
Jiangsu Tianyi High School, Wuxi, China

Copyright © 2017 by author and Scientific Research Publishing Inc.
This work is licensed under the Creative Commons Attribution International License (CC BY 4.0).
http://creativecommons.org/licenses/by/4.0/


Received: September 1, 2017; Accepted: November 12, 2017; Published: November 16, 2017
ABSTRACT
In this study, we research about comb-drive micro-structure, which is a MEMS device used to measure velocities and accelerations. To ensure the accuracy and visualization of the result, we simulate the dynamics of the comb drive using COMSOL Multiphysics, meanwhile introducing the concept of re-meshing. We aim to find the optimal comb-drive-building material, which can provide the device with the most desirable first eigenfrequency. According to the optimization process, silver is the most suitable construction material. Afterwards, the electric responses of both the optimized device and the pre-optimized one are analyzed in frequency domain and stationary study. We conclude that the capacitance change is positively related to frequency in a linear manner, and that the optimized device has a larger increment of both displacement and capacitance per unit of frequency change than the pre-opti- mized one, showing that the optimization of material realizes our goal of enhancing electrical performance.
Keywords:
Comb-Drive Micro-Structure, COMSOL Multiphysics, Optimization, Electric Responses

1. Introduction
Micro Electromechanical Systems (MEMS) technology combines knowledge and researches in areas like Mathematics, Physics, Computer Studies, Electric Engineering, and Mechanical Engineering. This technology is attracting attention from a wide range of academic and economy sectors, and has been applied to a number of cutting-edge fields of research, including gyroscopes, controllers, scanners, and accelerators. The rising of MEMS these years is induced by a increasingly matured technology market and a significant reduction of costs due to the development of silicon fabrication technology. Comb-drive micro-structure, one of the most widely applied MEMS devices, is used to measure the velocities and accelerations in through the drive’s output voltage. Comb drive is continuously gaining popularity because it requires little reaction time, has significant output force, and performs small and steady output displacement. However, comb-drives are still facing challenges in designs and fabrications. For example, the designs require great accuracy and huge expense; many constrains which restrict the dimensions of comb-drives are still existing during manufacturing processes.
Many researches in the field of comb drive study have being working to conquer these problems. Among them, researchers Hoang Manh Chu and Kazuhiro Hane focus on the aspect of fabrication method. They examine difficulties of making precisely controlled submicron gaps from thick poly-crystalline Silicon, and propose a method called “oxidation machining” to realize controlled submicron gaps for comb drives [1] . New designs of comb drives are also presented by a number of scholars, Gaopeng Xue and Pablo G. as representatives. To break the limit of the detectable minimum force, Gaopeng Xue and his partners design a chip-level comb-drive XYZ-microstate that produces large displacements into x-, y-, and z-directions [2] . Pablo G. and his team members manage to project two capacitive comb drives with the aim to eliminate the levitation effect often observed in such systems [3] . Besides the areas of researches above, a size-de- pendent nonlinear model is built by Dai, H. L. and other scientists based on the modified couple stress theory [4] . However, flaws remain in current models. Many models are built based on numerical calculations by hand, which is extremely time-consuming and is problematic in accuracy. Moreover, models are mainly static or focus on time domain, while frequency domain has not been deeply studied in the researches.
In this paper, we show how we optimize the material of the comb drive to obtain the highest voltage amplitude. In order to raise the accuracy and visualization, we developed a finite element code to simulate the dynamics of the comb drive using COMSOL Multiphysics, which calculates the intrinsically coupled electrodynamics and electrostatics. At first, we study the equilibrium state of the model and figure out its eigenvalues. Then we run the optimization to find out the most suitable material for building the device. After the above, we study the pre-optimized and the optimized model in stationary study in order to determine the differences of their electric responses. Frequency domain is also included in our study. In addition to that, we re-mesh the model after every step of simulation. Comparing to traditional meshing methods which assume that the traits of the model remain unchanged during the simulation, re-meshing can improve the preciseness of our data in a large scale.
2. Model Setup
2.1. Geometry and Boundary Conditions
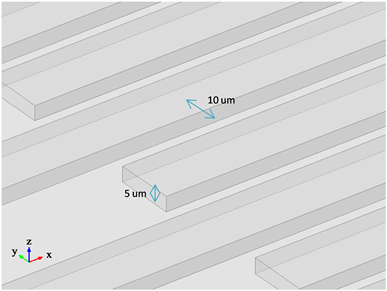
The schematic design of comb drive is shown in Figure 1. The device consists of
 (a)
(a)
 (b)
(b)
Figure 1. (a) Top view of comb-drive; (b) 3D view of comb-drive.
two parts: the suspension spring on the left and the comb drive body on the right. 7 pairs of fingers constitute the body part of this model. The fingers are 200 um in length and 20 um in width with a gap of 10um between the neighboring two. The shuttles have a length of 380 um and a width of 100 um. The distance between the outstretching end of a finger and the stator is the length of overlap lover, which is 80 um. The springs are 20 um in width with a 40 um length of the shorter two and a 400 um length of the longer two. The suspension spring part enables the body part to move along the x axis in parallel. The whole device has a thickness of 5 um. An air box is also added around the comb drive to calculate the electric field in the surrounded air. The left most end in the suspension spring part is the anchor which is set to be fixed in the model. The right body part is the stator and it has a fixed boundary condition. A roller is added onto the fingers to ensure that the fingers move along the x axis without shift in other directions. An applied force, F, is applied on the shuttle in the left body part. For the electrical aspect, the right body part of the device is grounded, while the remaining is conducted to a voltage of 1 V.
2.2. Optimization Process
This comb drive accelerator is planned to be applied to rocket chamber measurement. Therefore, we want the objective operation frequency to be as close to 10,000 Hz as possible, which is within the range of rocket chamber resonance. In this work, by comparing different materials, the objective frequency can be realized by the process of optimization.
At the beginning, copper is used to build the comb drive. We change the setting so that the optimization process will only take the first eigenfrequency into account, at which the comb drive has uniform displacement in x direction. In the optimization process, the material properties, which include density and young’s modules, can vary in a certain range.
After each optimization result, we improve the material according to their density and Young’s Modulus. After two rounds of optimization, we finally decide that silver is the most appropriate material for our device. When building the device with silver, the first eigenfrequency is the closest to 10,000 Hz.
2.3. Stationary Study and Frequency Domain
After using the study of eigenfrequency to find the optimized material for comb drive, we also wish to find out the electric response of our optimized design and compare it to that of the pre-optimized one’s. We use the stationary study and the frequency domain to graph their capacitance change as a function of frequency.
3. Results and Discussion
3.1. Optimization Process
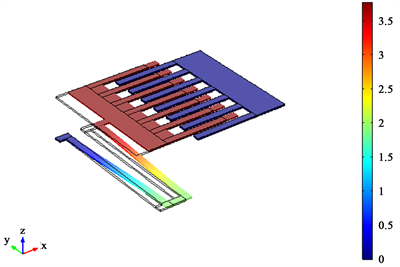
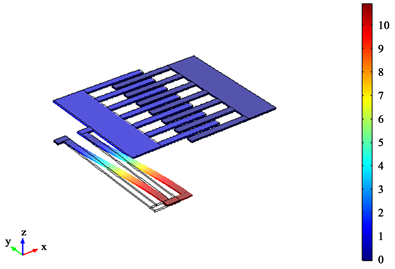
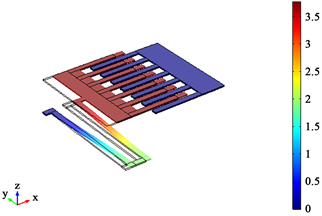
Figures 2(a)-(c) present the first three eigen values of the pre-optimized design which is made of copper. Figure 2(a) shows the comb drive with a frequency of 13,586 Hz; Figure 2(b) shows the device with a frequency of 93,348 Hz; Figure 2(c) shows it with a frequency of 2.6938E5 Hz. The figures exhibit different displacements of the device at these three eigen frequencies. In Figure 2(a), the left part of the comb drive moves parallelly to the right with no shift or vibration in other directions; in Figure 2(b), the suspension spring has some deformation in the z direction; in Figure 2(c), the fingers of the comb drive are vibrating vertically. In our study, we only take the first eigen mode where the left part of the
 (a)
(a)
 (b)
(b)
 (c)
(c)
Figure 2. (a) 13586 Hz; (b) 93348 Hz; (c) 2.6938E5 Hz.
comb drive moves parallelly to the right into account. Since the first eigenfrequency of the pre-optimized design is now 13,586 Hz, it should decrease to approach 10,000 Hz.
Since the application of this comb drive accelerator is for rocket chamber measurement, the objective operation frequency should be as close as 10,000 Hz. When other variables are all fixed, we change the material to reach the objective. We use optimization to find out the most suitable material.
The optimization method is Nelder-Mead, which is a commonly applied numerical method used to find the minimum or maximum of an objective function in a multidimensional space. The objective function is f = (freq − 1e4[Hz])2 in order to minimize the difference between the calculated eigenmode and the objective frequency. Since the square-form objective function should be as small as possible in order to approach 10,000 Hz, we set the type of optimization to be minimization. The setting is changed so that only the first eigenfrequency, at which the comb drive has uniform displacement in x direction, is taken into account.
The first eigenfrequency of the pre-optimized device is expected to decrease to approach 10,000 Hz. The density and Young’s Modulus of the device are allowed to vary in a certain range to find a more suitable material which contributes to a smaller value of the objective function.
Table 1 describes the first optimization process. The pre-optimized device is made of copper. We set the range of its density to be from 8000 kg/m3 to 9500 kg/m3, and its Young’s Modulus to be from 8 × 10¹⁰ Pa to 1.6 × 10¹¹ Pa. We observe that through the process of optimization, density moves from 8960 kg/m3 to 9500 kg/m3 while Young’s Modulus changes from 1.2 × 10¹¹ Pa to 8 × 10¹⁰ Pa. Therefore, a conclusion can be drawn that a new material with a higher density and a lower Young’s Modulus than copper has a first eigenfrequency closer to 10,000 Hz.

Table 1. 1st optimization processable.
Besides the constrains of density and Young’s Modulus, the new material must also satisfy the following conditions: its electrical conductivity should be similar to copper’s; it should be common, applicable, and affordable in MEMS. Table 2 shows some common metals in MEMS and their properties of density, Young’s Modulus, and electrical conductivity. According to the information and the optimization result, gold is the most suitable material for building the device till now.
Figures 3(a)-(c) present the first three eigenfrequencies of the first-optimized design which is made of gold. Figure 3(a) shows a frequency of 7081.7 Hz; Figure 3(b) shows a frequency of 48,618 Hz; Figure 3(c) shows a frequency of 1.404E5 Hz. The patterns of displacements of the first-optimized device showed in the figures above are similar to those of the pre-optimized one. The first eigenfrequency of the comb drive has decreased as we expected, but it becomes smaller than 10,000 Hz. As a result, the first eigenfrequency does not move significantly closer to the objective (how to describe clearly). Under this circumstance, we find it necessary to run optimization again.
Table 3 describes the second optimization process. We set the range of the material’s density to be from 18,500 kg/m3 to 20,000 kg/m3, and its Young’s Modulus to be from 30E9 Pa to 110E9 Pa. We observe that through the process of optimization its density moves from 19,300 kg/m3 to 18,500 kg/m3, while its Young’s Modulus changes from 7 × 10¹⁰ Pa to 1.1 × 10¹¹ Pa. Therefore, a new
Table 2. Common metals for building comb drives.
Table 3. 2nd optimization process―Au.
 (a)
(a) (b)
(b)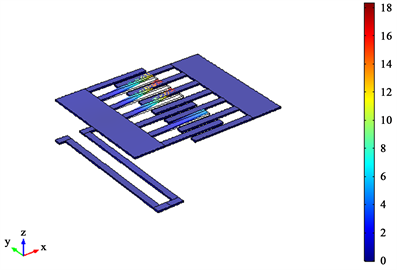 (c)
(c)
Figure 3. (a) 7081.7 Hz; (b) 48618 Hz; (c) 1.404E5 Hz.
material with a lower density and a higher Young’s Modulus than gold will be closer to the objective. The result of this optimization is the opposite of the former one because the first eigenfrequency of gold-made comb drive is smaller than 10,000 Hz, while that of the copper-made one is greater than the objective.
Figures 4(a)-(c) present the first three eigen values of the second-optimized design which is made of silver. Figure 4(a) shows a frequency of 10,442 Hz;
 (a)
(a)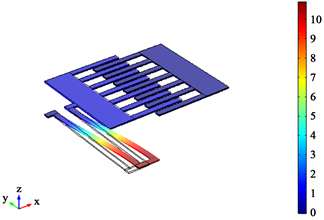 (b)
(b)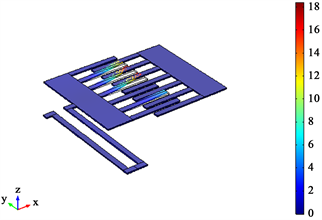 (c)
(c)
Figure 4. (a) 10442 Hz; (b) 71729 Hz; (c) 2.0703E5 Hz.
Figure 4(b) shows a frequency of 71,729 Hz; Figure 4(c) shows a frequency of 2.0703E5 Hz. The patterns of displacements of the second-optimized device showed in the figures above are similar to those of the previous two. The first eigenfrequency of the silver-made comb drive is much closer to 10,000 Hz than those of the former two designs. Since we are not able to find another materi- al―in terms of density, Young’s Modulus, electrical conductivity, prevalence, and cost―that better satisfies our requirements, we consider silver to be the most suitable one for building our model.
3.2. Electric Response
After finding out the most suitable material―silver―through optimization, we observe the reaction of the device by applying force and putting it in frequency domain to collect some data about its behavior. At first, we compare the displacements in the range of 2000 Hz and 5000 Hz of the pre-optimized device and the optimized one in frequency domain.
Figure 5 shows the displacement of the comb drive as a function of frequency. The black line represents the optimized design made of silver, and the yellow one represents the pre-optimized one made of copper. The functions of two designs show a similar pattern, but the optimized one shows a more significant change in displacement, which means that its electric response of frequency change can be more acute and evident.
Figure 6 shows the relationship between the capacitance and the length of overlap of the optimized design. Between 2000 Hz and 5000 Hz, its displacement changes from 6.37 um to 7.97 um, thus lover ranges from 33.63 um to 32.03 um.
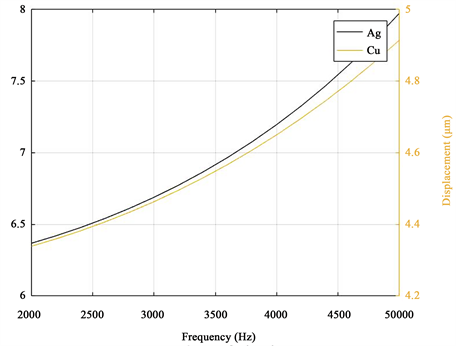
Figure 5. Displacement-frequency relation comparison between the pre-optimized device and the optimized device.

Figure 6. Capacitance-lover relation of the optimized device made of Ag.
We change domain probe to calculate the capacitance of the comb drive, and then use parametric sweep in static study to plot the capacitance as a function of lover. The parametric sweep works by calculating the corresponding capacitance at each value of lover, which is chosen by setting the upper and lower bound and the interval between each two.
Figure 7 shows the relationship between the capacitance and the length of overlap of the pre-optimized design. Between 2000 Hz and 5000 Hz, its displacement changes from 4.34 um to 4.91 um, thus lover ranges from 35.66 um to 35.09 um. We then use parametric sweep in static study to plot the capacitance as a function of lover.
By comparing the graph of the optimized device with the pre-optimized one, we can conclude that capacitance generally declines as lover increases. This result can be explained by analyzing that as lover increases, displacement of the comb drive decreases, thus the areas between each neighboring two fingers contract, resulting in a decline in capacitance which is proportionally related to area.
Differences between the optimized device and the pre-optimized one are also shown by these two graphs. The variance of lover is greater in the first graph than the second one, illustrating the enhanced sensitivity of frequency change.
Figure 8 shows the relationship between the change of capacitance and the frequency of the optimized device. We use the data sets when generating the graph of displacement-frequency relation, then change the value of lover and run static study to generate corresponding capacitance value. The capacitance change can be easily obtained by subtracting the changed capacitance by the one with the original lover.
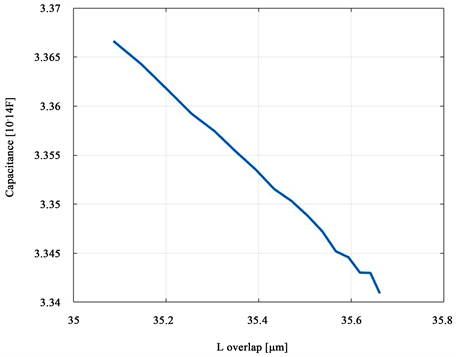
Figure 7. Capacitance-lover relation of the pre-optimized device made of Cu.
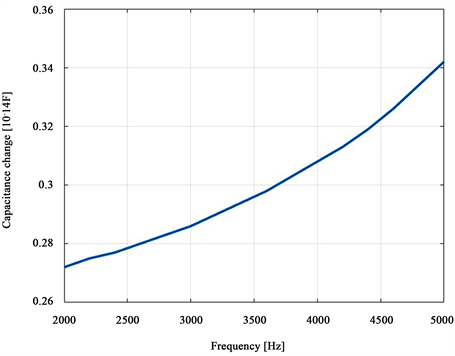
Figure 8. Capacitance change-frequency relation of the optimized device made of Ag.
Figure 9 shows the relationship between the change of capacitance and the frequency of the pre-optimized device. The method of obtaining the data is the same as the one used to plot the graph of the optimized device.
By comparing the graphs of the optimized device and the pre-optimized one, we can draw the conclusion that the capacitance change has a general tendency
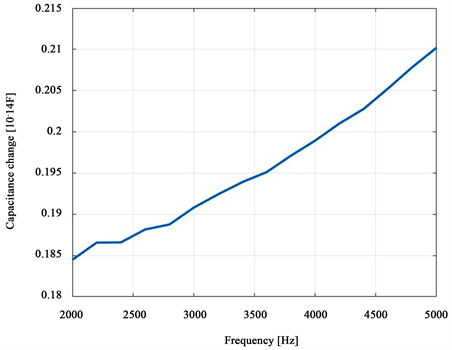
Figure 9. Capacitance change-frequency relation of the optimized device made of Cu.
of increment as the frequency increases. The optimized device has a larger increment per unit of frequency change than the pre-optimized one, showing that an eigenfrequency within the rocket chamber resonance range provides a more evident electric response.
3.3. Discussion
The advantages of this model are its visualization, convenience and preciseness. By simulating the behaviors of the comb drive in COMSOL Multiphysics, we can clearly and easily observe its performance in images. The preciseness of the simulation is improved by setting the mesh size to be “finer” and re-meshing the device after each status change by modifying its lover. In this study, optimization is used to find the optimal material. Besides, both frequency domain and static study are taken into research when deciding the electric responses of the pre-optimized design and the optimized one.
Improvements can still be made to further develop the model. The optimization of the comb drive’s geometry could also be included into the study. Moreover, if feasible, the method of moving mesh should be applied to make the numerical calculation process more convenient and speedy.
4. Conclusions
In this project, we develop a finite element code to simulate the dynamics of the comb drive using COMSOL Multiphysics, which ensures an accurate revivification of the device’s behaviors. We set the mesh size to be finer and re-mesh the model after every change of state. In this way, the preciseness of our data is greatly improved.
We find out that different materials can induce different voltages where the mechanical and electric properties were significantly different. According to the optimization process by COMSOL, silver is the most suitable material to build the comb drive, since the device made of this metal has its first eigenfrequency closest to 10,000 Hz, which is within the range of rocket chamber resonance. The optimization result is obtained by solving the local minima of the fitting curve.
The electric responses of both the optimized and the pre-optimized device have been thoroughly analyzed. In frequency domain, the devices both show a positive linear relationship between their body displacement and frequency. New capacitances of the devices corresponding to each frequency value are determined by changing lover. The capacitance change is positively related to frequency in a linear manner. By comparing the performances of the optimized design and the pre-optimized one, we observe that the optimized device has a larger increment of both displacement and capacitance per unit of frequency change than the pre-optimized one, showing that an eigenfrequency within the rocket chamber resonance range provides a more acute and evident electric response.
Future work includes optimization for the device’s geometry, searching for more suitable materials such as alloys, finding other applications for comb drive, etc.
Cite this paper
Zhao, X.Y. (2017) Numerical Simulation on the Comb Drive Micro-Accelerometer. Modern Mechanical Engineering, 7, 113-126. https://doi.org/10.4236/mme.2017.74008
References
- 1. Dai, H.L. and Wang, L. (2017) Size-Dependent Pull-In Voltage and Nonlinear Dynamics of Electrically Actuated Microcantilever-Based MEMS: A Full Nonlinear Analysis. Communications in Nonlinear Science & Numerical Simulation.
- 2. del Corro, P.G., Imboden, M., Bishop, D.J. and Pastoriza, H. (2016) Comb Drive Designs with Minimized Levitation. Journal of Microelectromechanical System.
- 3. Xue, G.P., Toda, M., Ono, T. and Comb-Drive, X.Y.Z. (2016) Microstage with Large Displacements Based on Chip-Level Micro Assembly. Journal of Microelectromechanical Systems.
- 4. Hirano, T., Furuhata, T., Gabriel, K.J. and Fujita, H. (1992) Design, Fabrication, and Operation of Submicron Gap Comb-Drive Microactuators. Journal of Microelectromechanical Systems.