Modern Mechanical Engineering
Vol.4 No.2(2014), Article ID:45837,17 pages DOI:10.4236/mme.2014.42008
Experimental Verification of Fault Predictions in High Pressure Hydraulic Systems
P. Athanasatos, D. Koulocheris, Th. Costopoulos*, V. Spitas
Mechanical Engineering Department, National Technical University of Athens, Zografos Campus, Athens, Greece
Email: *cost@central.ntua.gr
Copyright © 2014 by authors and Scientific Research Publishing Inc.
This work is licensed under the Creative Commons Attribution International License (CC BY).
http://creativecommons.org/licenses/by/4.0/


Received 3 January 2014; revised 16 February 2014; accepted 4 March 2014
ABSTRACT
In this paper a model of a high pressure hydraulic system was developed to simulate the effect of increased internal leakages inside the hydraulic cylinder and the 4/2 way directional control valve and to calculate the main parameters of the hydraulic system under various loads through the use of leakage-simulating throttle valves. After the completion of modeling, the throttle valves that simulate the internal leakages were calibrated and a number of test runs were performed for the cases of normal operation and the operation with increased internal leakages. The theoretical predictions were compared against the experimental results from an actual hydraulic test platform installed in the laboratory. In all cases, modeling and experimental data curves correlate very well in form, magnitude and response times for all the system’s main parameters. This proves that the present modeling can be used to accurately predict various faults in hydraulic systems, and can thus be used for proactive fault finding in many cases, especially when the defective component is not easily detected and obvious at first sight.
Keywords:Hydraulic Systems, Cylinder, Directional Control Valve, Fault Prediction, Internal Leakage

1. Introduction
The bond graph method is used to create the model of a high pressure hydraulic system and to simulate various degrees of internal leakage in its 4/2 way directional control valve and hydraulic cylinder under various loads. After the model was created a series of test runs, simulating normal operation and increased internal leakage for the cylinder and the 4/2 way directional control valve, were conducted and their results were compared with the measurements from an actual high pressure hydraulic system with the same degrees of internal leakage. The goal is to experimentally verify whether bond graph modeling can be used as a tool for proactive fault finding in high pressure hydraulic systems, by accurately simulating various operating conditions of the system. In this paper, the model is compared to the actual system during operation when there is a gradually increasing internal leakage inside the cylinder and the 4/2 way directional control valve.
A useful insight into the scope, operation and components of high pressure hydraulic systems can be found in Kaliafetis and Costopoulos [1] , Hehn [2] , Meritt [3] , Mitchell and Pippenger [4] , and Rabie [5] , whereas Totten et al. [6] deal with the troubleshooting principles of hydraulic systems.
For the modeling of hydraulic systems through the bond graph method an in depth research has been done by Athanasatos and Costopoulos [7] , Athanasatos et al. [8] , Barnard and Dransfield [9] , Barnard [10] , Dransfield [11] , and Dransfield and Steki [12] .
2. Hydraulic System Modeling
2.1. Description of Hydraulic System
The line diagram of the hydraulic system used as the test platform can be seen in Figure 1 and its main components and measuring instruments are explained in Table 1. The system can be used to simulate a variety of operating conditions. In this paper though, we will focus exclusively in the internal leakage of the hydraulic cylinder (26) and the 4/2 way directional control valve (11) under various loads. The internal leakage on the hydraulic cylinder is simulated via throttle valve (H) which, when open, allows some amount of flow to bypass the
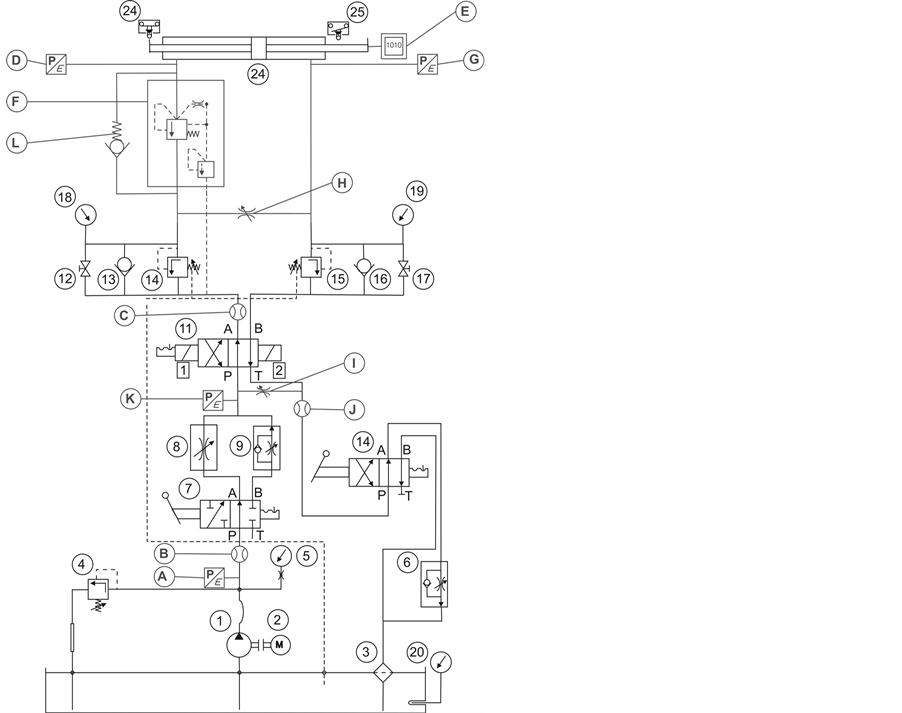
Figure 1. Line diagram of the hydraulic system to be modeled.

Table 1. Components of hydraulic system.
cylinder. Similarly, the internal leakage in the 4/2 way valve is simulated via throttle valve (I) which, when open, allows some flow directly from port “P” of the valve to port “T”.
2.2. Modeling Procedure of the Hydraulic System
To ease the modeling procedure, each main component of the system, was modeled separately. Due to the focus on the hydraulic cylinder and the directional control valve more detailed models are used for these two components and simpler ones were used for the rest of the components, in order to avoid creating an overly complex model.
2.3. Symbol Nomenclature
The main symbols that appear in the bond graph components and the resulting equations are the following:
ω = Angular velocity of electric motor and pump shaft Qp = Flow rate at pump outlet Vp = Geometric displacement per radian rotation of the pump Tp = Torque at electric motor shaft Pp = Pressure at pump outlet Cp = Hydraulic capacitance in pump outlet Qlp = Flow loss due to pump internal leakage Rlp = Hydraulic resistance coefficient in the pump internal leakage flow path Qrv = Flow rate through pressure relief valve Rrv = Hydraulic resistance coefficient in the main relief valve flow path Pset = Main relief valve opening pressure Qi = Input flow Qo = Output flow Pi = Input pressure Po = Output pressure PRpv = Pressure drop from pump outlet to 4/2 valve inlet QA = Flow rate from 4/2 way valve “A” port QB = Flow rate from 4/2 way valve “B” port QP = Flow rate from 4/2 way valve “P” port QT = Flow rate from 4/2 way valve “T” port QPA = Flow rate through P- > A flow path QPB = Flow rate through P- > B flow path QAT = Flow rate through A- > T flow path QBT = Flow rate through B- > T flow path PA = Pressure in 4/2 way valve “A” port PB = Pressure in 4/2 way valve “B” port PP = Pressure in 4/2 way valve “P” port PT = Pressure in 4/2 way valve “T” port QPA = Flow through the P- > A path in 4/2 way direction control valve QPB = Flow through the P- > B path in 4/2 way direction control valve QAT = Flow through the A- > T path in 4/2 way direction control valve QBT = Flow through the B- > T path in 4/2 way direction control valve Qlv = 4/2 way valve internal leakage flow rate RPA = Hydraulic resistance coefficient in the P- > A flow path in 4/2 way direction control valve RPB = Hydraulic resistance coefficient in the P- > B flow path in 4/2 way direction control valve RAT = Hydraulic resistance coefficient in the A- > T flow path in 4/2 way direction control valve RBT = Hydraulic resistance coefficient in the B- > T flow path in 4/2 way direction control valve KPA = Flow coefficient of P- > A path in 4/2 way direction control valve KPB = Flow coefficient of P- > B path in 4/2 way direction control valve KAT = Flow coefficient of A- > T path in 4/2 way direction control valve KBT = Flow coefficient of B- > T path in 4/2 way direction control valve N = Valve spool displacement to maximum valve spool displacement ratio Xi = Valve spool displacement (Xi > 0 when flow paths P- > A and B- > T are enabled)
W = Maximum valve spool displacement Dv = 4/2 way valve spool diameter cv = Radial clearance between 4/2 valve spool and body
μ = Absolute fluid viscosity PRvt = Pressure drop between 4/2 valve T port and tank x = Hydraulic cylinder piston displacement
![]() = Hydraulic cylinder piston velocity Q1 = Flow rate entering the hydraulic cylinder right chamber Q2 = Flow rate entering the hydraulic cylinder left chamber A1 = Hydraulic cylinder piston surface (right side)
= Hydraulic cylinder piston velocity Q1 = Flow rate entering the hydraulic cylinder right chamber Q2 = Flow rate entering the hydraulic cylinder left chamber A1 = Hydraulic cylinder piston surface (right side)
A2 = Hydraulic cylinder piston surface (left side)
Ffc = Friction force during the motion of the hydraulic cylinder piston Fmc = Force due to mass inertia in the hydraulic cylinder moving parts SFload = Equivalent load t = Elapsed time mc = Mass of cylinder moving parts P1 = Pressure in hydraulic cylinder right chamber P2 = Pressure in hydraulic cylinder left chamber F = Force exerted in hydraulic cylinder piston Cc1 = Hydraulic capacitance in cylinder right chamber Cc2 = Hydraulic capacitance in cylinder left chamber Qlc = Internal leakage through hydraulic cylinder piston Dc = Hydraulic cylinder piston diameter L = Length of hydraulic cylinder piston Fu = Coulomb friction force Kf = Viscosity coefficient PRcv = Pressure drop through check valve “L”
2.4. Hydraulic System Bond Graph Model
From the models of the individual components, the entire hydraulic system bond graph model is created. In Figure 2 we see the bond graph model of the system during the motion of the hydraulic cylinder piston to the left, while in Figure 3 we see the bond graph model of the system during the motion of the piston to the right.
2.5. Hydraulic System Bond Graph Model Equation Layout
The equations for the components of the bond graph are the following:
Electric motor, pump and main relief valve
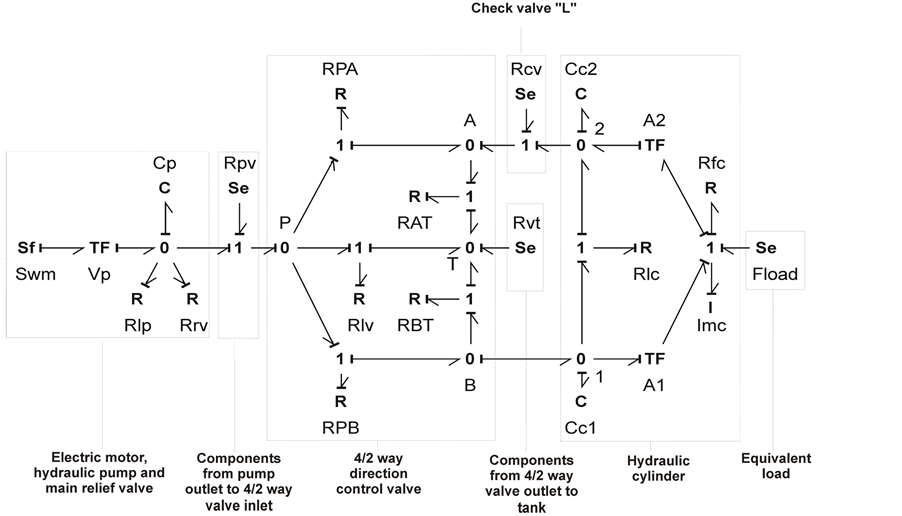
Figure 2. Hydraulic system bond graph model for the motion of the piston to the left.
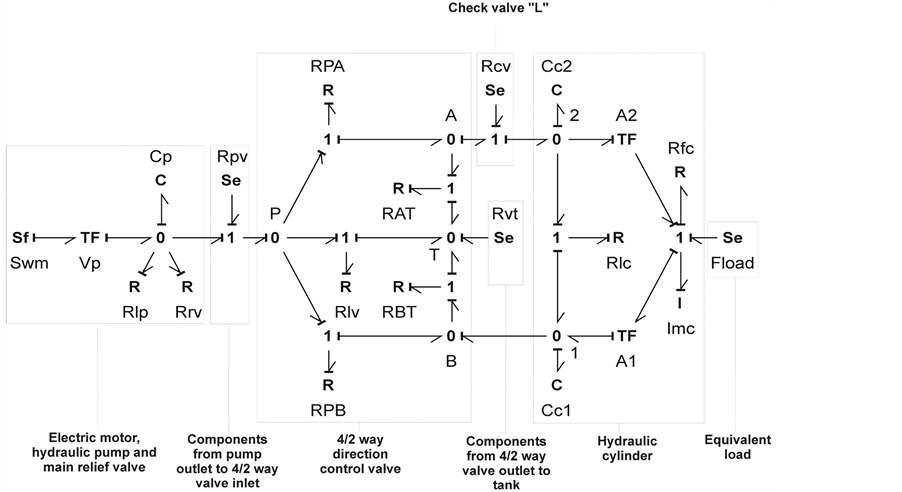
Figure 3. Hydraulic system bond graph model for the motion of the piston to the right.
Swm: (1)
(1)
TFVp:
 (2)
(2)
 (3)
(3)
Cp:
 (4)
(4)
Rlp:
 (5)
(5)
Rrv: 
 (6)
(6)
0-junction: (7)
(7)
Section from pump outlet to 4/2 way valve inlet
Rpv:
 (8)
(8)
1-junction: (9)
(9)
4/2 way direction control valve 0-junctions
 (10)
(10)
 (11)
(11)
 (12)
(12)
 (13)
(13)
1-junctions
 (14)
(14)
 (15)
(15)
 (16)
(16)
 (17)
(17)
 (18)
(18)
RPA: 
 (19)
(19)

RPB:

 (20)
(20)

RAT: 
 (21)
(21)

RBT: 
 (22)
(22)

Rlv:
 (23)
(23)
Section from valve outlet to tank
Se:
 (24)
(24)
Hydraulic cylinder and equivalent load
Α) Piston movement to the left 0-junctions
 (25)
(25)
 (26)
(26)
1-junctions
 (27)
(27)
 (28)
(28)
Α1 transformer
 (29)
(29)
 (30)
(30)
Α2 transformer
 (31)
(31)
 (32)
(32)
Cc1 capacitance
 (33)
(33)
Cc2 capacitance
 (34)
(34)
Imc inertia phenomenon
 (35)
(35)
Rlc resistance
 (36)
(36)
Rfc resistance
 (37)
(37)
SeFload
 (38)
(38)
Β) Piston movement to the right 0-junctions
 (39)
(39)
 (40)
(40)
1-junctions
 (41)
(41)
 (42)
(42)
Α2 transformer
 (43)
(43)
 (44)
(44)
Α1 transformer
 (45)
(45)
 (46)
(46)
Cc1 capacitance
 (47)
(47)
Cc2 capacitance
 (48)
(48)
Imc inertial phenomenon
 (49)
(49)
Rlc resistance
 (50)
(50)
Rfc resistance
 (51)
(51)
SeFload:
 (52)
(52)
- Check valve “L”
1-junction:
 (53)
(53)
SeRcv:

 (54)
(54)
2.6. Constants and Initial Conditions Definition
Based on manufacturer data and measurements performed, the following constants and initial conditions were determined.


2.7. Calibration of Throttle Valves “H” and “I” with Calculation of “Equivalent Clearances” for Increased Internal Leakage in Hydraulic Cylinder and 4/2 Way Valve
To calibrate throttle valves “H” and “I” that control flow bypass through the cylinder and valve and thus simulate internal leakage, the “equivalent clearances” for the hydraulic cylinder and 4/2 way valve corresponding to various opening degrees of the throttle valves were calculated. The “equivalent clearance” is defined as the internal clearance between the hydraulic cylinder piston and body (the same goes for the internal clearance of the 4/2 way valve spool and body) that would cause the same amount of flow to bypass the cylinder (or the 4/2 way valve) as the flow bypassing it due to the gradual opening of the respective throttle valve plus the flow already bypassing it due to the existing clearance. To calculate the “equivalent clearances” of the hydraulic cylinder, firstly, the total flow rate exiting the cylinder during the working phase was measured by flow meter “C”. Then, the actual “motion flow rate” used to move the cylinder piston was calculated from the piston velocity. Then, the “motion flow rate” was subtracted from the total flow rate in order to calculate the “equivalent internal leakage” flow rate bypassing the cylinder. Finally, Equation (36) was solved for clearance cc by using analytical methods, in order to calculate the equivalent clearances. In total, 4 tests were performed, each by gradually opening throttle valve “H” by half a turn. The equivalent leakages calculated can be seen in Table 2, where the initial mea
Table 2. Equivalent clearances of hydraulic cylinder according to opening of throttle valve “H”.
surement with the throttle valve completely shut corresponds to the existing internal clearance between the piston and the cylinder body.
In the same manner, the “equivalent clearances” of the 4/2 way valve were calculated. The total flow rate that is headed to the valve is measured by flow meter “B”, while the flow that actually goes through the valve ports is measured by flow meter “C”. By subtracting the flow rate measured from flow meter “C” from the flow rate measured by flow meter “B”, we calculate the “equivalent internal leakage” flow rate bypassing the valve. Finally, Equation (23) was solved for clearance cv in order to calculate the equivalent clearances. In total, 4 tests were performed, each by gradually opening throttle valve “I” by half a turn. The equivalent leakages calculated can be seen in Table 3, where the initial measurement with the throttle valve completely shut corresponds to the existing internal clearance between the spool and the valve body. All measurements were performed with the load control valve set to create a backpressure of 10 bar, equivalent to a 2.1 kN load.
3. Experimental Verification of Fault Predictions
Using throttle valves “H” and “I”, a number of test runs was performed in the high pressure hydraulic system simulating internal leakage in the hydraulic cylinder and 4/2 way valve respectively. These test runs were replicated in the bond graph model of the system using the “equivalent clearances” of the cylinder and valve calculated in paragraph 2.7. The results of the system and the model were compared and the comparison results are discussed in the following paragraphs.
3.1. Comparison of Model and System during Operation with Increased Internal Leakage of the Hydraulic Cylinder
In total, 3 test runs were conducted, with the load control valve being set to create a backpressure of 10, 20 and 30 bars, which correspond to 2.1 kN, 4.2 kN and 6.3 kN of equivalent load respectively. Each test run started with throttle valve “H” completely shut off, and when one operating cycle was completed, it was gradually opened by half a turn at a time. The results of the model were compared to the ones of the actual system in terms of the equivalent internal leakage flow rate in the working phase and the ratio of the average speed in the working phase to the average speed in the return phase. The results are shown in the following figures. In Figure 4, the comparison of equivalent internal leakage values of the model and the actual system for an equivalent load of 2.1 kN is shown. As seen, there is a very good correlation between the experimental and the measurement data, with the correlation coefficient being r = 0.994. Also, the regression curves for both the experimental (continuous line) and the model data (dashed line) have the form of a 3rd degree polynomial equation, as expected by Equation (36). In Figure 5, we see the comparison of equivalent internal leakage values of the model and the actual system for an equivalent load of 4.2 kN. Again, the correlation of experimental and model data is very high (r = 0.998) and the regression curves for both the experimental (continuous line) and the model data (dashed line) have the form of a 3rd degree polynomial equation. Finally, the same goes for Figure 6, where the comparison of equivalent internal leakage values for the model and the actual system for an equivalent load of 6.3 kN is shown. The correlation coefficient of experimental and model data is r = 0.995, with the regression curves for both the experimental (continuous line) and the model data (dashed line) again having the form of a 3rd degree polynomial equation.
In Figure 7, the comparison of working phase to return phase piston velocity ratio values of the model and the actual system for an equivalent load of 2.1 kN is shown. The correlation coefficient is r = 0.997 and the re
Table 3. Equivalent clearances of 4/2 way valve according to opening of throttle valve “I”.
Equivalent Internal Leakage Flow Rate for Fload = 2.1 kN
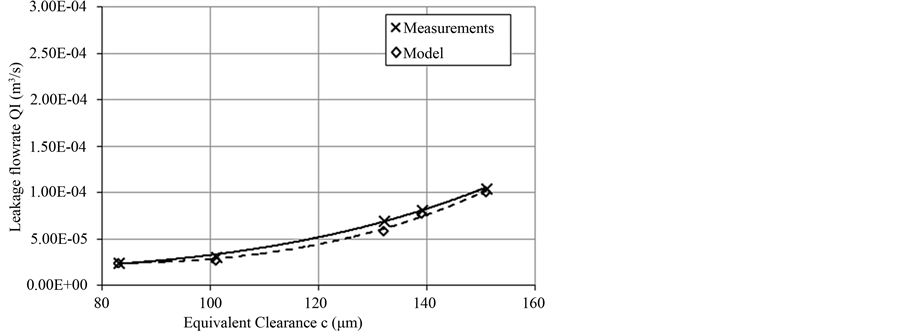
Figure 4. Comparison of equivalent leakage flow rate between experimental and model data for Fload = 2.1 kN.
Equivalent Internal Leakage Flow Rate for Fload = 4.2 kN
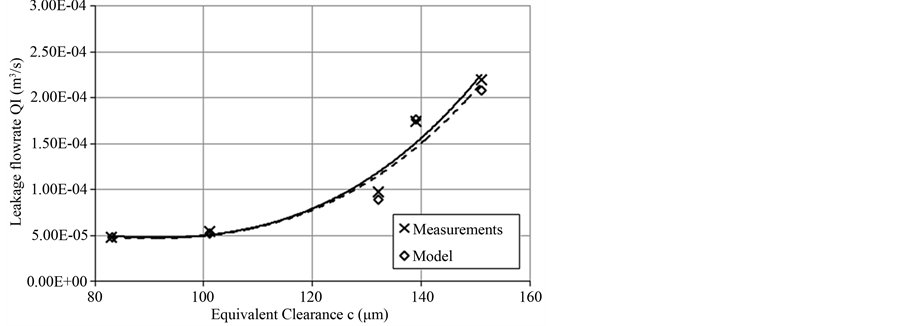
Figure 5. Comparison of equivalent leakage flow rate between experimental and model data for Fload = 4.2 kN.
Equivalent Internal Leakage Flow Rate for Fload = 6.3 kN
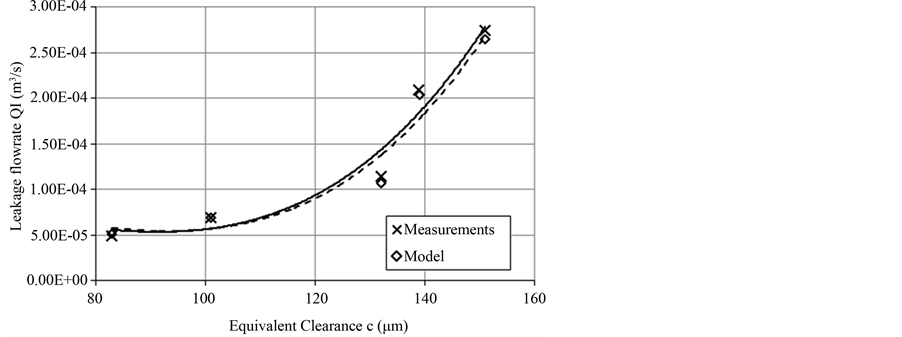
Figure 6. Comparison of equivalent leakage flow rate between experimental and model data for Fload = 6.3 kN.
Working to Return phase piston velocity ratio for Fload = 2.1 kN
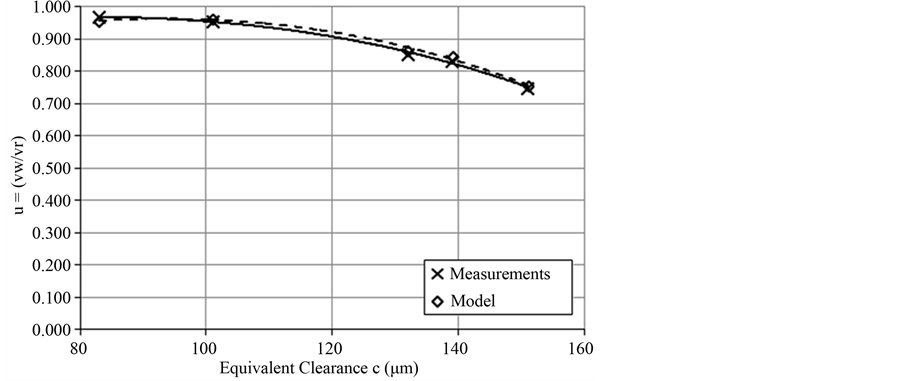
Figure 7. Comparison of working to return piston velocity ratio between experimental and model data for Fload = 2.1 kN.
gression curves for both the experimental (continuous line) and the model data (dashed line) have the form of a 3rd degree polynomial equation. Similarly, in Figure 8 we see the same values for the test run with an equivalent load of 4.2 kN. The correlation coefficient between the experimental and the model data is r = 0.999 and again regression curves for both the experimental and the model data have the form of a 3rd degree polynomial equation, as expected. Finally, the same goes for Figure 9, where the comparison of working phase to return phase piston velocity ratio values for the model and the actual system for an equivalent load of 6.3 kN is shown. Here, the correlation coefficient between the experimental and the model data is r = 0.996, and the regression curves retain the form of a 3rd degree polynomial equation.
3.2. Comparison of Model and System during Operation with Increased Internal Leakage of the 4/2 Way Direction Control Valve
Again, the values of equivalent clearances for the 4/2 way valve calculated in Paragraph 2.7 were used in the model and its results were compared with the ones of the actual system. In Figure 10, the comparison of equivalent internal leakage values in the working phase of the model and the actual system for an equivalent load of 2.1 kN is shown. There is very good correlation between the experimental and the measurement data, with the correlation coefficient being r = 0.997. Also, the regression curves for both the experimental (continuous line) and the model data (dashed line) have the form of a 3rd degree polynomial equation, as expected by Equation (23).
In Figure 11, we see the comparison of equivalent internal leakage values of the model and the actual system for an equivalent load of 4.2 kN. Again, the correlation of experimental and model data is very high (r = 0.999) and the regression curves for both the experimental (continuous line) and the model data (dashed line) have the form of a 3rd degree polynomial equation. Finally, the same goes for Figure 12, where the comparison of equivalent internal leakage values for the model and the actual system for an equivalent load of 6.3 kN is shown. The correlation coefficient of experimental and model data is again very high (r = 0.998), with the regression curves for both the experimental (continuous line) and the model data (dashed line) having the form of a 3rd degree polynomial equation.
In Figure 13, the comparison of working phase to return phase piston velocity ratio values of the model and the actual system for an equivalent load of 2.1 kN is shown. The correlation coefficient is r = 0.997 and the regression curves for both the experimental (continuous line) and the model data (dashed line) have the form of a 3rd degree polynomial equation. Similarly, in Figure 14 we see the same values for the test run with an equivalent load of 4.2 kN. The correlation coefficient between the experimental and the model data is r = 0.999 and again regression curves for both the experimental and the model data have the form of a 3rd degree polynomial equation, as expected. Finally, the same goes for Figure 15, where the comparison of working phase to return Working to Return phase piston velocity ratio for Fload = 4.2 kN
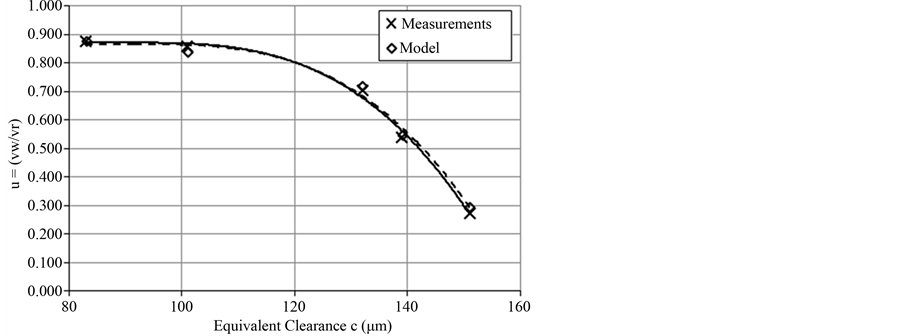
Figure 8. Comparison of working to return piston velocity ratio between experimental and model data for Fload = 4.2 kN.
Working to Return phase piston velocity ratio for Fload = 6.3 kN
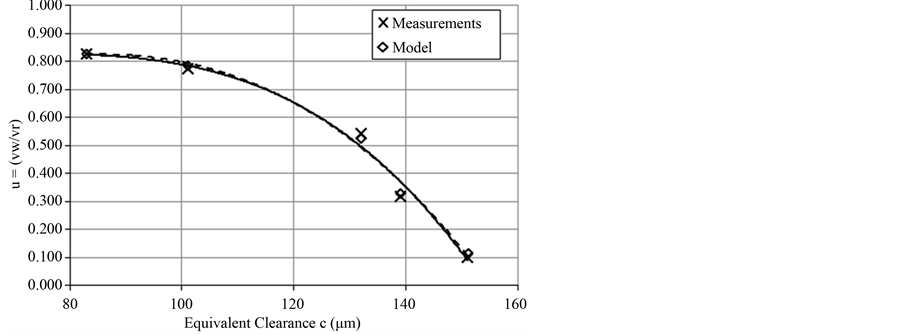
Figure 9. Comparison of working to return piston velocity ratio between experimental and model data for Fload = 6.3 kN.
Equivalent Internal Leakage Flow Rate for Fload = 2.1 kN
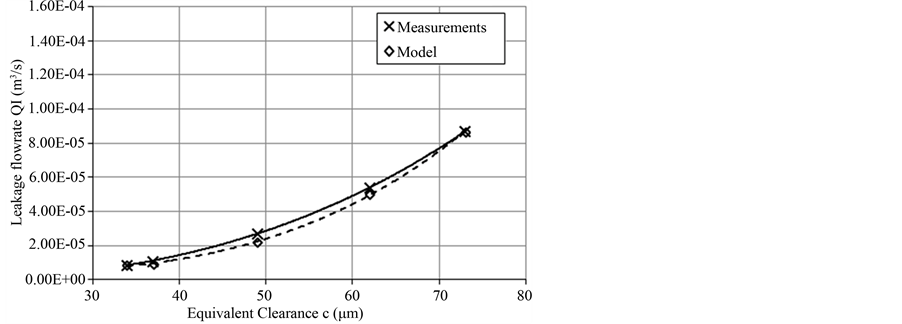
Figure 10. Comparison of equivalent leakage flow rate between experimental and model data for Fload = 2.1 kN.
Equivalent Internal Leakage Flow Rate for Fload = 4.2 kN
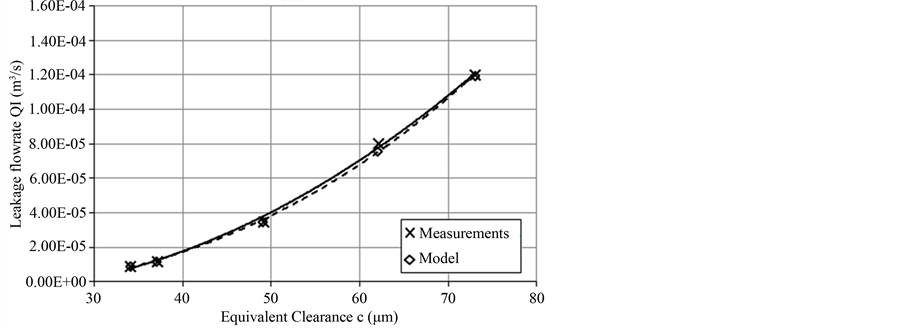
Figure 11. Comparison of equivalent leakage flow rate between experimental and model data for Fload = 4.2 kN.
Equivalent Internal Leakage Flow Rate for Fload = 6.3 kN
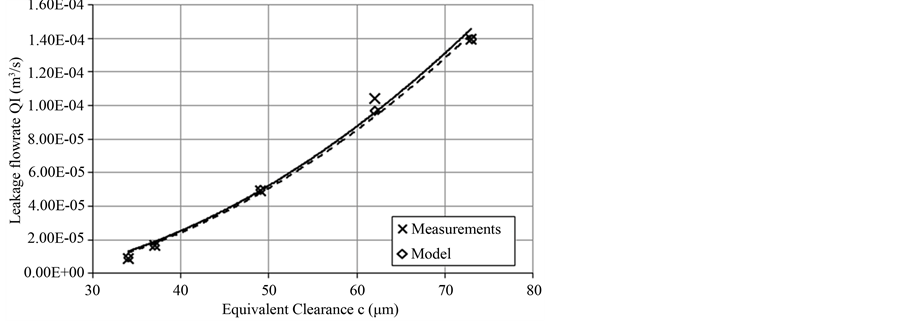
Figure 12. Comparison of equivalent leakage flow rate between experimental and model data for Fload = 6.3 kN.
Working to Return phase piston velocity ratio for Fload = 2.1 kN
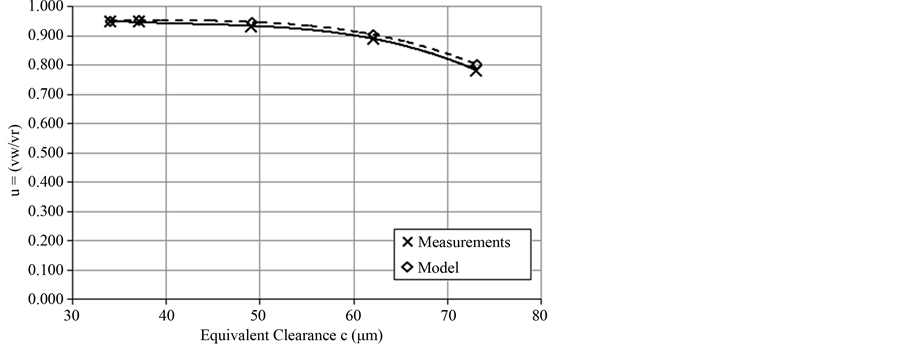
Figure 13. Comparison of working to return piston velocity ratio between experimental and model data for Fload = 2.1 kN.
Working to Return phase piston velocity ratio for Fload = 4.2 kN
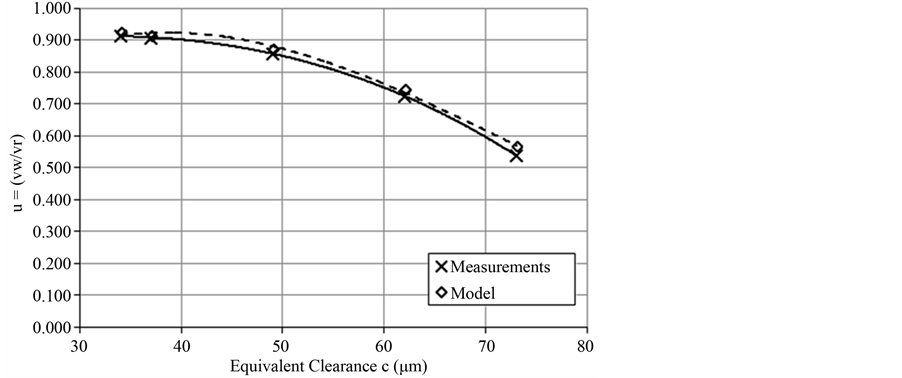
Figure 14. Comparison of working to return piston velocity ratio between experimental and model data for Fload = 4.2 kN.
Working to Return phase piston velocity ratio for Fload = 6.3 kN
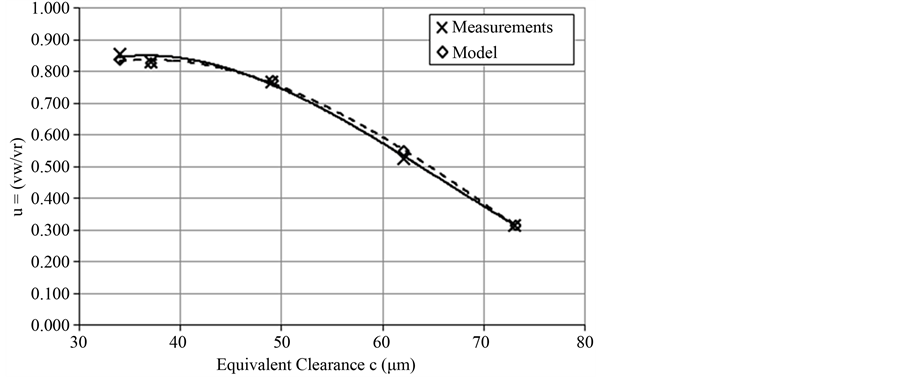
Figure 15. Comparison of working to return piston velocity ratio between experimental and model data for Fload = 6.3 kN.
phase piston velocity ratio values for the model and the actual system for an equivalent load of 6.3 kN is shown. Here, the correlation coefficient between the experimental and the model data is r = 0.998, and the regression curves retain the form of a 3rd degree polynomial equation.
4. Conclusion
In this paper, the fault predictions of a model of an actual high pressure hydraulic system were verified by comparison with the results of an actual hydraulic system. The results of the model were compared to the results provided by an actual hydraulic system, modified in order to simulate various loads and degrees of internal leakage in the hydraulic cylinder and the 4/2 way valve. Comparisons were made during simulation of increased internal leakage in the cylinder and the valve. In all cases, the results of the model correlate very well to the data provided by the actual system both in shape and in minima and maxima of the curves. The equivalent internal leakage in the hydraulic cylinder and the 4/2 way valve is a function of the equivalent internal clearance that has the form of a 3rd degree polynomial equation, as evidenced by the regression curves in both the experimental and modeling data. Additionally, the ratio of the average velocity of the cylinder piston in the working phase to the average velocity in the return phase is also a function of the equivalent internal clearance of the hydraulic cylinder and the 4/2 way valve in the form of a 3rd degree polynomial equation. This also means that this ratio can be used as an index for the assessment of the internal clearance of the cylinder and the valve, given that it is fairly easy to calculate, unlike the more complex procedure and instrumentation required to measure the internal leakage. This could prove useful in real life applications of high pressure hydraulic systems where it is obvious that a problem exists, but the source of it cannot be easily traced. In similar situations the application of this modeling technique could also help the troubleshooting procedure even further, by allowing the simulation of “fault scenarios” in various components of the system, in order to locate the source of the problem.
References
- Kaliafetis, P. and Costopoulos, Th. (1994) Modelling and Simulation of an Axial Piston Variable Displacement Pump with Pressure Control. Mechanism and Machine Theory, 30, 599-612. http://dx.doi.org/10.1016/0094-114X(94)00057-R
- Hehn, A.H. (1994) Fluid Power Troubleshooting: Second Edition, Revised and Expanded. CRC Press, Boca Raton.
- Meritt, H.E. (1967) Hydraulic Control Systems. John Wiley and Sons, Inc., Hoboken.
- Mitchell, R.J. and Pippenger, J.J. (1997) Fluid Power Maintenance Basics and Troubleshooting. Marcel Dekker Inc., New York.
- Rabie, G.M. (2009) Fluid Power Engineering. McGraw-Hill, New York.
- Totten, G.E., Wills, D.K. and Feldmann, D.K. (2001) Hydraulic Failure Analysis: Fluids, Components and System Effects. ASTM. http://dx.doi.org/10.1520/STP1339-EB
- Athanasatos, P. and Costopoulos, T. (2011) Proactive Fault Finding in a 4/3-Way Direction Control Valve of a High Pressure Hydraulic System Using the Bond Graph Method with Digital Simulation. Mechanism and Machine Theory, 50, 64-89. http://dx.doi.org/10.1016/j.mechmachtheory.2011.11.018
- Athanasatos, P., Koulocheris, D., Costopoulos, T. and Raptis, K. (2013) Operational Fault Diagnosis in Industrial Hydraulic Systems through Modeling the Internal Leakage of Its Components. American Journal of Applied Sciences, 10, 1648-1659. http://dx.doi.org/10.3844/ajassp.2013.1648.1659
- Barnard, B.W. and Dransfield, P. (1977) Predicting Response of a Proposed Hydraulic Control System Using Bond Graphs. Journal of Dynamic Systems, Measurement, and Control, 99, 1-8. http://dx.doi.org/10.1115/1.3427068
- Barnard, B.W. (1973) Predicting the Dynamic Response of a Hydraulic System Using Power Bond Graphs. M.Sc Thesis in Mechanical Engineering, Monash University, Melbourne (Unpublished).
- Dransfield, P. (1981) Hydraulic Control Systems—Design and Analysis of Their Dynamics. Lecture Notes in Control and Information Sciences. Springer-Verlag, Berlin. http://dx.doi.org/10.1007/BFb0005627
NOTES

*Corresponding author.