Open Journal of Biophysics
Vol.04 No.04(2014), Article ID:49956,6 pages
10.4236/ojbiphy.2014.44013
Magnetic Field Configurations Corresponding to Electric Field Patterns That Evoke Long-Term Potentiation Shift Power Spectra of Light Emissions from Microtubules from Non-Neural Cells
Blake T. Dotta, David A. E. Vares, Carly A. Buckner, Robert M. Lafrenie, Michael A. Persinger
Biomolecular Sciences and Behavioural Neuroscience Programs, Laurentian University, Sudbury, Canada
Email: mpersinger@laurentian.ca
Copyright © 2014 by authors and Scientific Research Publishing Inc.
This work is licensed under the Creative Commons Attribution International License (CC BY).
http://creativecommons.org/licenses/by/4.0/


Received 13 July 2014; revised 12 August 2014; accepted 11 September 2014
ABSTRACT
Photon counts were measured every 15 ms for 75 s from microtubule-enriched preparations (and nuclei) from mouse melanoma cells during baseline and after 2 min exposures to 1 μT magnetic fields. The magnetic fields were generated from a circular array of solenoids and presented with accelerating or decelerating rotation velocities. The range of photon radiant flux density was in the order of 10−12 W·m−2. Microtubules preparations that had been exposed for only 2 min to a magnetic field configuration corresponding to the electric field pattern that induced long-term potentiation in neural tissue when applied as electric current displayed peaks of spectral power densities within 7 - 8 Hz, 9.5 Hz, 14 - 15 Hz, and 22 Hz bands. The major peak (9.4 Hz) bandwidth was approximately 0.1 Hz. While microtubule preparations exposed for 2 min to a 7 Hz sine-wave or in the absence of a field emitted an overall similar level of spectral power density, the peaks in power density were not present. Treatment with the LTP patterned fields, compared to the baseline or sine-wave fields primarily altered the frequency band in which the amplitude of the photon field was expressed. These results suggest that the photon emissions from microtubule preparations have the capacity to respond to specifically-patterned or geometric shapes of magnetic fields by altering spectral configurations rather than the absolute numbers of photons.
Keywords:
Microtubules, Photon Emissions, Spectral Density Shifts, Physiologically-Patterned Magnetic Fields

1. Introduction
Whereas the functions of the molecular components of the cell respond to spatial structures of atoms, the electromagnetic functions of the cell appear to respond to temporal patterns of energy. Long-Term Potentiation (LTP) is a powerful process [1] within neuronal aggregates within the hippocampus and other brain regions by which representations of stimuli (experience) are facilitated to form spatial representations within the spine patterns of dendrites [2] . The consequence of this process is that less energy is required to evoke the complimentary representation when a similar stimulus pattern is presented again.
Within the molecular domain, a phosphorylation of a single site (serine831) in the subunit (glutamate R1) of the alpha-amino-3-hydroxy-5-methyl-4-isoxazolepropionic (AMPAR) receptor followed LTP while dephosphorylation of a single (serine845) site followed Long Term Depression [3] . In other words, a single reaction involving a quantum of energy in the order of 10−20 J [4] per molecule was associated with a long-term shift in the state of responsiveness of the cell. Rose and his colleagues [5] found that a temporal pattern of electric current associated with a single priming pulse followed 150 ms later by four rapid pulses (equivalent to ~100 Hz) resulted in significant LTP when applied to hippocampal slices. When this pattern was transformed to weak magnetic fields in the order of 1 μT and applied to the entire animal before learning a spatial task, the disruption of the memory was as powerful as complete depolarization of the hippocampal region by direct current [6] .
The molecular bases to the changes in neuronal activity that are coupled to memory and to even higher functions such as consciousness [7] have focused upon the changes of energy as inferred from photon properties within microtubules. The multifunctional microtubules affect intracellular transport of molecules and organize the relative positions of membrane-enclosed organelles. Tubulin, the subunits of these hollowed cylindrical structures that extend across the cell, contains an alpha- and beta-tubulin for which the individual monomers exhibit either a bound GTP molecule or an exchangeable GTP or GDP molecule. Such potent molecular arrangements allow the possibility for discrete release of energy as photons as monomers organize or “disorganize”.
In several experiments, we found that mouse melanoma cells in culture when they were removed from standard incubation emitted copious photons as measured by photomultiplier units. We have inferred that a large proportion originated from the plasma cell membrane [8] . The flux density of the photon emissions (~10−11 W·m−2) responded systematically and non-linearly to the optimal intensity of an applied, physiologically-patterned magnetic field [9] and suggested that the dynamics within the plasma cell membrane exhibited a type of “membrane magnetic moment”. We reasoned that considering the proportion of tubulin within cells and the rate of the sequestering of the monomers forming tubulin the dynamics within these structures might be a source of photon emissions with which weak, physiologically-patterned magnetic fields might interact.
In order to test if the photon emissions of even non-neural cells would respond to physiologically-patterned, weak magnetic fields, we tested the effects of the temporal structure known to induce LTP in hippocampal slices to preparations of microtubule preparations (and nuclei) from melanoma cells. We employed a specific exposure protocol, involving initial durations of 20 ms magnetic fields that were rotated through a circularly array of eight solenoids because of its demonstrated efficacy for producing maintained photon emissions from chemo luminescent reactions [10] . Here we demonstrate that brief exposures to LTP patterned fields produce a conspicuous shift in the peak spectral power density of photon emissions from aggregates of microtubules.
2. Materials and Methods
2.1. Microtubule Preparations
B16-BL6 murine melanoma cells were maintained in Dulbeco’s Modified Essential Medium (DMEM, Hyclone) supplemented with 10% fetal bovine serum (Hyclone), 100 ug/ml of streptomycin, and 100 U/ml of penicillin and incubated at 37 deg C in 5% CO2. Cells were plated on 60 mm × 15 mm tissue culture dishes at a density of approximately 106 cells per dish. To remove the plasma membrane and cytoplasm, cell monolayers were washed with 0.01% Triton (in PBS, pH 7.4) solution for approximately 2 min. The Triton solution was removed and the microtubule- and nuclei-enriched preparations were rinsed once with PBS. They were then covered with 1 mL of PBS pH 7.4.
2.2. Circular Array of Solenoids and Exposure Equipment
A single plate of the preparation of microtubules and nuclei was placed in the center of a circular array (circumference 60 cm) of 8 pairs of solenoids (Figure 1). The solenoids were SPST-5VDC reed switches purchased from Radio Shack. The coil resistance was 250 ohms and the voltage and nominal current were 5 VDC and 20 mA. Pairs of solenoids were contained in plastic film canisters such that one was “north” and one was “south”. Consequently the magnetic field was “focused” similar to that of a small “horseshoe” magnet.
Special software allowed a programmable pattern to be generated through each pair of solenoids. The Complex software developed by Professor Stanley A. Koren was constructed such that a number between 0 and 255 could be transformed to between −5 and +5 V (128 = 0 V) by a custom constructed digital-to-analogue converter. Consequently a column of numbers with each value between 0 and 255 would be transformed into a voltage. The duration each voltage was generated, the point duration, was also programmable.
The second component of the program determined the duration each pattern was presented at each of the eight solenoid pairs. Based upon previous research [10] , we selected a pattern composed of 142 units, called the 7LTP40 pattern. It was the fast-frequency component of that employed by Rose et al. [4] to produce LTP in hippocampal slices when it was applied as electric current. The pattern is composed of a column of 142 numbers between 128 and 255 (positive polarity, PP). The point duration of each number (voltage) was 1 ms. The repeated sequence was 62 ms (no polarity or voltage, NV), 10 ms PP, 25 ms NV, 11 ms PP, 25 ms NV, and 9 ms PP. The fast frequency bursts were equivalent to 90 to 110 Hz; the average interval was 24 ms. To control for simply the presentation of the magnetic field a second pattern, designed to generate a smooth 7 Hz sine wave was developed. It was composed of a row of 334 numbers with gradually increasing and decreasing values (7 times per s) between 0 and 255. To match for intensity of the average field strength, the point duration was 3 ms.
The third component of the programmable software determined the duration the continuously generated pattern was rotated through each solenoid pair. The 20 + 2 ms (accelerating angular velocity) program indicated that the first solenoid pair generated a pattern for 20 ms while the second solenoid generated the pattern for 18 ms until the 8th solenoid generated the field for 6 ms. This was followed by the 20 − 2 ms (decelerating angular velocity) program where 2 ms was added to the duration of each successive solenoid such that the duration of the field at the 8th solenoid pair was 34 ms. The time required for the completion of one rotation for the 20 + 2 and 20 − 2 ms configurations was 104 ms and 216 ms or 9.6 Hz and 4.6 Hz, respectively.
2.3. Exposure and Measurement Procedure
In four separate experiments over several weeks aggregates of microtubule preparations in cell dishes (plates) were placed over a digital photomultiplier sensor (SENS-Tech DM0009C). The width of the sensor was 2 cm such that about 40% of the area of the plate was within the area of the aperture. The distance between the sensor and microtubules on the bottom of the plastic plate was about 1 mm. The stabilized unit was housed within a blackened box that was covered with several layers of thick, black terry cloth towels in a very dark room.
For each experiment a plate containing the microtubule preparations was first placed over the PM sensor in the dark box. The numbers of photon counts were sampled at 66.66 Hz (15 ms), the upper limit of reliability of the software program, for 75 s, resulting in 5000 measurements. The plate was then removed and placed in the middle of the array of solenoids. The plate was exposed to the LTP 20 + 2 ms accelerating angular velocity configuration for 60 s. Within 30 s, the LTP 20 − 2 ms decelerating field was applied for 60 s. The plate was removed

Figure 1. Schematic of the exposure equipment. The dishes of microtubules (gray circle) were placed within the circular array of solenoids (rectangles). The rate of acceleration or deceleration of the rotation as well as the shape of the applied magnetic field was controlled by the computer and its software (CPU).
and placed (within 30 s) over the PM sensor for 75 s. The accelerating followed by the decelerating procedure has produced the most optimal effects [10] .
After that measure, the plate was returned to the array of solenoids and exposed to the 7 Hz sine wave pattern applied with angular acceleration (20 + 2) for 60 s and then 30 s later applied with the negatively accelerating configuration (20 − 2 ms). The plate was returned to the PM sensor and measured for 75 s. For air measurements a tissue culture plate only was placed over the PM sensor for 75 ms. In Experiment 4 the sine-wave exposure was presented first before the LTP exposure. The average strengths of the magnetic fields within the culture dishes containing the microtubules within the center of the array of solenoids as measured by a power meter was ~1 μT.
2.4. Statistical Analyses
The 16 rows of 5000 measurements for each of the 4 experiments containing data for the baseline (no field), LTP, 7 Hz sine wave, and air measurements were transported from Spreadsheet to SPSS 16 software. Means and standard deviations for the numbers of photon counts (per 15 ms) were obtained. We assumed repeated measures within an experiment. Because we are interested in larger effects that can be discerned by small samples we employed Friedman’s Test, a non-parametric within subject procedure.
The major component of the study involved spectral analyses. The correlation between the total numbers of photons measured for 5000, 15 ms increments and the total spectral power density (SPD) for the 16 cases was 0.95. The ratio of the SPD to the photon counts ranged from 50 to 300 SPD units per 0.02 Hz.
In order to allow direct comparison between trials, z-scores were obtained for baseline, LTP-exposed, and sine-wave exposed samples. Spectral density data were saved for these z-score transformations. The mean spectral densities (2500, increments, each ∆f ~0.02 Hz) for each condition were calculated. Scattergrams for the mean spectral densities for the conditions across the 33 Hz of increments were completed to ensure no effects were obscured.
3. Results
The means and standard deviations (in parentheses) for the numbers of photon counts per 15 ms (sampling rate) were 0.6 (0.1) for the air, 10.6 (10.2) for the baseline (microtubule preparations before magnetic field exposure), 7.4 (5.2) for microtubule preparations after the modified LTP pattern, and 5.1 (2.9) after the 7 Hz sine wave exposure. Assuming a mid-energy quantum of 5 × 10⁻¹⁹ J per photon, an aperture area of 3.14 × 10⁻⁴ m−2, this radiant flux density was in the order of 10−12 W·m−2 when the microtubules were present and ~10−13 W·m−2 for air, i.e., the typical background level for cosmic ray incidence [11] .
Because of the large coefficient of variations, our selection of the non-parametric repeated measures (Friedman Test) was particularly appropriate. There was a significant difference (chi-squared (3) = 9.30, p < 0.05) between the treatments. The major source of the difference was between the photon counts for the air vs. other (microtubule) conditions. Pairs of Friedman comparisons for each of the treatments indicated that the diminished photon emissions after the sine-pattern exposure was significantly different from the LTP magnetic field exposure (chi-squared (1) = 4.0, p < 0.05). No other paired comparisons were statistically significant.
The mean standardized power densities for the photon emissions from microtubule preparations after exposure to the LTP-patterned magnetic field for the range between 5 and 30 Hz and 7 to 10 Hz increments for more precise viewing are shown in Figure 2. Values above the horizontal dotted red line indicated the values were more than 2 SD above the mean. Microtubules that had been exposed to the modified LTP accelerating and decelerating magnetic field for 60 s each showed significant elevations in photon power density within the 7 to 8 Hz band, 9.4 Hz, 14 to 15 Hz, 23 Hz, and 24.5 to 25 Hz. The 7.1 Hz and 9.4 Hz peaks are more evident in the lower panel of Figure 2.
When all three conditions (baseline, LTP, and 7 Hz sine wave) are compared in Figure 3, the conspicuous nature of the effect is clear. The protracted significant elevation of power densities over 5 successive 0.02 Hz increments between 9.4 and 9.5 Hz is indicated in red. For comparison the power densities for the baseline (black) measurements and those following the 7 Hz sine-wave (dotted) line are shown.
4. Discussion
The results of these experiments indicated that only two minutes of exposure to counterclockwise angular
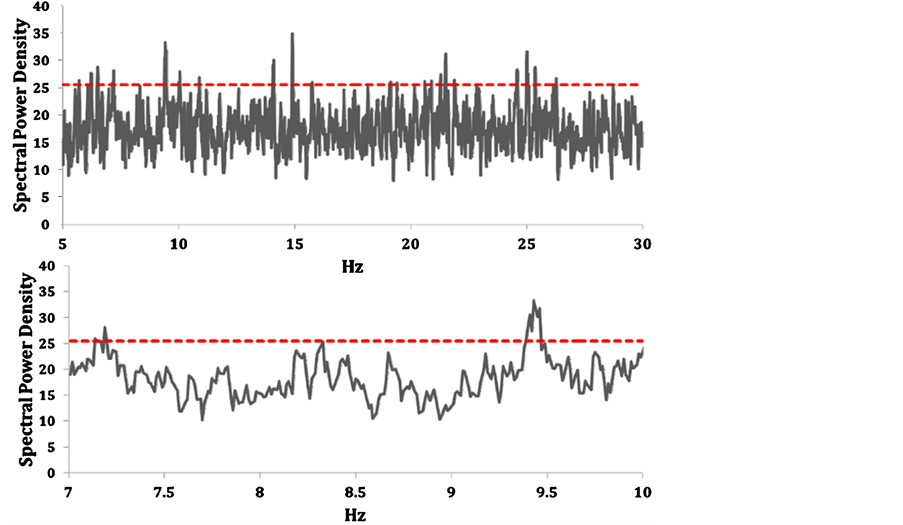
Figure 2. Average normalized spectral power density for photon emissions from microtubules as a function of frequency during the subsequent approximately 2 min following 2 min exposure to the modified LTP magnetic field configuration. Values above the red dotted line indicated greater than 2 standard deviations above the interval mean.
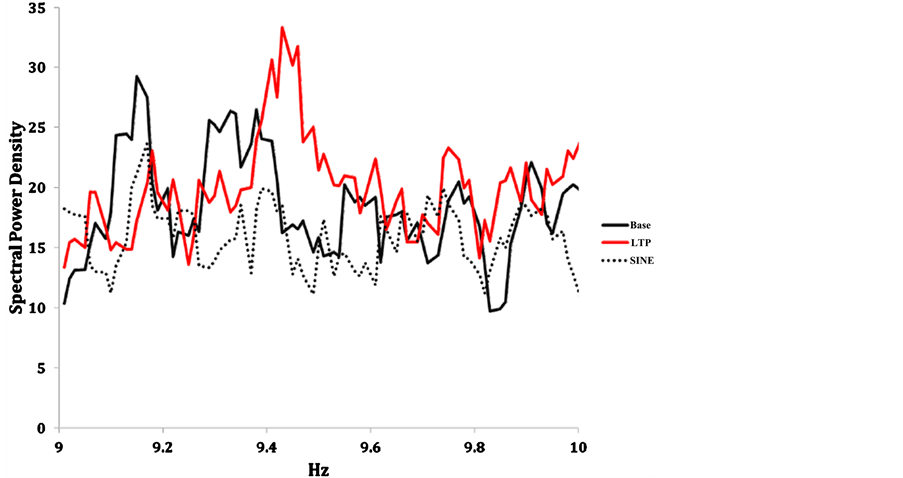
Figure 3. Averaged normalized spectral power densities for photon emissions from microtubule preparations as a function of frequency (increments of 0.02 Hz) between 9 and 10 Hz for baseline measures and after exposure to modified LTP-patterned and 7 Hz sine-wave magnetic fields.
accelerating and decelerating magnetic fields around a circular array of sources produced a shift in the spectral power density of photon emissions from aggregates of microtubules (and nuclei). The shift in the power density compared to baseline conditions was conspicuous for the fast-frequency component of the magnetic field pattern that when applied as current produces long-term potentiation in hippocampal slices. A second magnetic field pattern, a “pure” 7 Hz sine wave, did not produce this shift.
We selected the specific characteristics of this modified LTP pattern and microtubule preparations to be studied together in the present experiments because of their essential role in theories concerning “consciousness” involved with the collapse of the wave function and memory [7] . An approximately 20 to 25 ms average “repetition” rate for the recursive, dynamic reconstructions of cerebral electromagnetic fields moving in a rostral-to- caudal direction may be considered an intrinsic property. Although these microtubule preparations were obtained from mouse melanoma cells, we assumed that the ubiquitous microtubules should not exhibit substantial differences in their physical properties from either normal neurons or malignant melanoma cells. That only the LTP magnetic field pattern produced the most conspicuous effects compared to the 7 Hz sine-wave magnetic field indicates that the phenomenon was specific to the temporal pattern of the field. Other experiments involving learning in rodents have found that LTP-patterned magnetic fields are more effective than intensity-balanced sine-wave fields [12] .
There was a marginally statistically significant difference in the flux density of the photons emitted from microtubule preparations after exposure to the LTP or sine wave fields. It was not likely to have been an artifact of time since the microtubules were removed from incubation. During the experiment where the sine-wave exposure occurred first there were still more photon counts after the LTP exposure. However this was not as impressive as the shift of the frequency in peak power spectra density.
The primary effect upon the shift of the spectra power density of the photon emissions following the modified LTP magnetic field exposure suggests that the temporal geometry of the applied field interacts with the temporal pattern of the photon emissions. Pattern is often associated with information and does not require significant addition or subtraction of energy from the system. As succinctly summarized by Cifra et al. [13] , a shift in the rate of temporal patterns by which energy is emitted rather than induced by the applied magnetic fields minimizes the counterargument that their intensities are too small to overcome the kT values associated with intrinsic thermal oscillations.
There was quantitative convergence with results consistent with other studies. The average (10.6) photons during baseline per 15 ms is the equivalent of 7.1 × 10² photons·s−1. Assuming 5 × 10⁻¹⁹ J per average photon, the energy is 3.5 × 10⁻¹⁶ J·s−1 or W. With an aperture area of 3.1 × 10⁻⁴ m2, the equivalent flux density would be ~1 × 10⁻¹² W·m−2. This is within the range of photon flux density measured during theta activity from hippocampal slices by other researchers [14] .
The value of 3.5 × 10⁻¹⁶ J (per s) would have originated from the equivalent of about 2 × 10⁵ cells (considering that only about 50% of the cell cytoskeletons were removed during the microtubule preparation and about 40% of the plate containing the material was within the aperture of the PMT sensor), which is about 1.8 × 10⁻²¹ J per cell per s equivalent. This quantity is within the range of energy lost (or gained) for one bit of information or when two operations converge according to the Landauer Limit of ln2·kT where k is the Boltzmann constant and T is the temperature of the preparation.
This quantity of energy per cell per second would be analogous, assuming a unit charge of 1.6 × 10⁻¹⁹ A·s, to ~11.2 mV. It may be relevant that this increment of voltage is within the upper range of the persistent ~8 Hz oscillation found in cells within layer two of the entorhinal cortices [15] which is the major input to and recipient of output from the hippocampal formation before the information is distributed through the cerebral cortices. Shifts or phase-modulations of voltages within the 7 to 9 Hz range might be considered a discrete band through which this area of the brain affects its volume. Superimposed upon the theta patterns emerging from the hippocampal formation are much smaller amplitude “40 Hz” ripples, or 20 to 25 ms fluctuations, that intercalate activity within the parahippocampal volume with the entire cerebral cortices.
The close correspondence between the intrinsic rotational frequency (9.6 Hz) of the angular accelerating magnetic fields and the 9.4 to 9.5 Hz conspicuous peaks in power density of photon emissions from the microtubules several minutes after removal from the field may suggest a transient “representation” or “memory” of this second derivative, rotational frequency within these aggregates that was later expressed within the photon emissions. The results of these experiments indicate that the strength of the applied magnetic field is not required, as also argued by Cifra et al. [13] , to exceed the threshold to compensate for thermal agitation. The temporal structure of the applied magnetic field, particularly when it simulates intrinsic biological or biochemical processes, may be more important than previously considered.
Acknowledgements
We thank Dr. W. E. Bosarge, Jr., CEO, Capital Technologies, Inc. for his support for this research. Special thanks are given to Professor Stanley A. Koren for his ingenuity and persistence over the decades.
References
- Malenka, R.C. and Bear, M.F. (2004) LTP and LTD: An Embarrassment of Riches. Neuron, 44, 5-21. http://dx.doi.org/10.1016/j.neuron.2004.09.012
- Moser, M.-B., Tommald, M. and Andersen, P. (1994) An Increase of Dendritic Spine Density on Hippocampal CA1 Pyramidal Cells Following Spatial Learning In Adult Rats Suggests The Formation of New Synapses. Proceedings for the National Academy of Sciences, U.S.A., 91, 12673-12675.
- Whitlock, J.R., Heynen, A.J., Shuler, M.G. and Bear, M.F. (2006) Learning Induces Long-Term Potentiation in the Hippocampus. Science, 313, 1093-1097. http://dx.doi.org/10.1126/science.1128134
- Persinger, M.A. (2010) 10−20 Joules as a Neuromolecular Quantum in Medicinal Chemistry: An Alterative Approach to the Myriad of Molecular Pathways. Current Medicinal Chemistry, 17, 3094-3098. http://dx.doi.org/10.2174/092986710791959701
- Rose, G.M., Diamond, D.M., Pang, K. and Dunwiddie, T.V. (1988) Primed Burst Potentiation: Lasting Synaptic Plasticity Invoked by Physiologically Patterned Stimulation. In: Hass, H. and Buzaski, G., Eds., Synaptic Plasticity in the Hippocampus, Springer-Verlag, Berlin, 96-98. http://dx.doi.org/10.1007/978-3-642-73202-7_28
- Mach, Q.-H. and Persinger, M.A. (2009) Behavioral Changes with Brief Exposures to Weak Magnetic Fields Patterned to Simulate Long-Term Potentation. Brain Research, 1261, 45-53. http://dx.doi.org/10.1016/j.brainres.2009.01.002
- Hameroff, S. and Penrose, S. (2014) Consciousness in the Universe: A Review of the “Orch OR” Theory. Physics of Life Reviews, 11, 39-78. http://dx.doi.org/10.1016/j.plrev.2013.08.002
- Dotta, B.T., Buckner, C.A., Cameron, D., Lafrenie, R.F. and Persinger, M.A. (2011) Biophoton Emission from Cell Cultures: Biochemical Evidence for the Plasma Cell Membrane as the Primary Source. General Physiology and Biophysics, 30, 301-309. http://dx.doi.org/10.4149/gpb_2013066
- Dotta, B.T., Lafrenie, R.M., Karbowski, L.M. and Persinger, M.A. (2014) Photon Emission from Melanoma Cells during Brief Stimulation by Patterned Magnetic Fields: Is the Source Coupled to Rotational Diffusion within the Membrane? General Physiology and Biophysics, 33, 63-73.
- Dotta, B.T. and Persinger, M.A. (2012) “Doubling” of Local Photon Emissions When Two Simultaneous, Spatially Separated, Chemiluminescent Reactions Share the Same Magnetic Field Configurations. Journal of Biophysical Chemistry, 3, 72-80. http://dx.doi.org/10.4236/jbpc.2012.31009
- Konig, H.L., Krueger, A.P., Lang, S. and Sonning, W. (1981) Biological Effects of Environmental Electromagnetism, Springer-Verlag, New York. http://dx.doi.org/10.1007/978-1-4612-5859-9
- McKay, B.E., Persinger, M.A. and Koren, S.A. (2000) Exposure to a Theta-Burst Magnetic Field Impairs Memory Acquisition and Consolidation for Contextual but Not Discrete Conditioned Fear in Rats. Neuroscience Letters, 292, 99-102. http://dx.doi.org/10.1016/S0304-3940(00)01437-3
- Cifra, M., Fields, J.Z. and Farhadi, A. (2011) Electromagnetic Cellular Interactions. Progress in Biophysics and Molecular Biology, 105, 223-246. http://dx.doi.org/10.1016/j.pbiomolbio.2010.07.003
- Isojima, Y., Isoshima, T., Nagai, K., Kikuchi, K. and Nakagawa, H. (1995) Ultraweak Biochemiluminescence Detected from Rat Hippocampal Slices. NeuroReport, 6, 658-660. http://dx.doi.org/10.1097/00001756-199503000-00018
- Alonso, A. and Klink, R. (1993) Differential Electroresponsiveness of Stellate and Pyramidal-Like Cells of Medial Entorhinal Cortex Layer II. Journal of Neurophysiology, 70, 128-143.