Open Journal of Inorganic Non-metallic Materials
Vol.2 No.3(2012), Article ID:21158,21 pages DOI:10.4236/ojinm.2012.23004
Experimental Characterization by Fluorescence of Capillary Flows in the Fiber Tows of Engineering Fabrics
Department of Mechanical Engineering, École Polytechnique de Montréal, Montréal, Canada
Email: trochu@polymtl.ca
Received April 8, 2012; revised June 1, 2012; accepted June 20, 2012
Keywords: Liquid Composite Molding; Wicking; Fiber Tow; Lucas-Washburn Model; Permeability; Sizing
ABSTRACT
Liquid Composite Molding (LCM) is an increasingly used class of processes to manufacture high performance composites. In LCM, the fibrous reinforcement is first laid in a mold cavity. After closure of the mold or covering of reinforcement with a plastic bag, a polymer resin is either injected or infused under vacuum through the fiber bed. The engineering fabrics commonly used in LCM possess generally dual scale architecture in terms of porosity: microscopic pores exist between the filaments in the fiber tows, while macroscopic pores appear between the tows as a result of the stitching/weaving fabrication process. On a microscopic scale, capillary flows in fiber tows play a major role on the quality of composites made by resin injection through fibrous reinforcements. In order to better understand the mechanisms that govern the impregnation of fibrous reinforcements in LCM, a study of wicking behavior is carried out in fiber tows. The experimental approach is based on capillary rise experiments, which are less expensive and time-consuming than other more standard characterization techniques often used in porous media. In addition, it allows gathering representative data on the wicking properties of fiber tows as a function of their morphological characteristics such as micro-porosity, total cross-section area, specific surface area, filament diameter and packing configuration. The morphological properties of the fiber tows will also be characterized by other standard experimental methods in order to compare with the results obtained by capillary rise experiments. These standard methods include gravimetry for the micro-porosity and fiber mass density, microscopic analysis to measure the filament diameter, cross-section area and packing configuration of the filaments and capillary flow porometry to evaluate the equivalent pore diameter. The capillary rise method has already been used not only in Soil Mechanics, but also to characterize engineering textiles used in high performance composites. Such experiments are not easy to perform, because of technical difficulties such as textile geometrical alteration during testing, changes in fluid properties due to solvent evaporation and inaccurate observation of the progression of the capillary front (fading). To circumvent these problems, a monitoring technique based on fluorescent dye penetration inspection (DPI) and CCD image acquisition is proposed in this investigation. Visual monitoring of the capillary front is coupled with real-time fluid mass acquisition using a high resolution balance. Experimental observations on the height of the capillary front and the fluid mass absorbed by the fiber tows can be analyzed by four imbibition models. These models consider the evolution of the capillary height with (model I) or without gravity (model II) and of the fluid mass absorbed by capillary effect with (model III) or without gravity (model IV). The models without gravity will be used on short imbibition distances to derive the microscopic properties of fiber tows from the experimentally observed evolutions of the capillary height and the fluid mass absorbed by capillarity. After describing the new capillary rise setup devised for the fiber tow experiments, a set of experiments is carried out to characterize the properties of the fiber tows and investigate the wicking phenomena along the warp and weft directions. The consistency of this approach is compared with more standard methods. At the same time, the impact of fiber sizing on the tow wicking behavior is investigated. Note that experimental evaluations of tow permeability can also be derived from this approach. The results compare well with permeability predictions based on Blake-Kozeny-Carman models. In the future, it will be possible to apply the same experimental approach to engineering fabrics. Indeed, a comprehensive wicking characterization of fibrous reinforcements is expected to provide useful information in order to evaluate the optimal processing conditions of high performance composites fabricated by Liquid Composite Molding.
1. Introduction
In processes such as Resin Transfer Molding (RTM), Compression Resin Transfer Molding (CRTM) and Vacuum Assisted Resin Infusion (VARI), a reactive liquid resin is injected or infused inside a mold cavity containing a dry fibrous reinforcement. In order to produce high performance composites, the fibers must be completely saturated prior to resin gelation [1,2]. Indeed, impregnation defects have a detrimental impact on the mechanical properties of composite parts such as the maximum compression, flexural and shear inter-laminar strengths [3-6]. It has also a substantial effect on crack initiation and fatigue life, on moisture absorption and surface finish [7,8]. Hence developing practical strategies to produce high quality composite parts becomes a critical industrial goal [9,10].
In order to better understand fabric impregnation mechanisms at the microscopic level and minimize void formation in dual scale fibrous reinforcements, the study of capillary flows inside fiber tows is becoming critical for high performance LCM applications. Over the last decades, the capillary rise approach has been used to characterize the permeability, the architecture of porous media and the capillary pressure at equilibrium in different soils. Researchers have also studied by this method the microscopic and macroscopic properties of fibrous reinforcements used in high performance composites [11,12] . However, for composite materials, this characterization technique suffered from a lack of precision, repeatability and robustness. These limitations arise from three main problems: 1) textile alterations during capillary rise tests may result either from fiber tow encasing, packing and fraying or from tension during the liquid uptake; 2) significant changes in the properties of the infiltration fluids often occur because of solvent evaporation; 3) the progression of the capillary front during long wicking tests cannot be followed accurately because of front fading in time, even with dyes [12-17] .
To circumvent these technical limitations, a monitoring technique based on fluorescent Dye Penetration InSpection (DPI) and CCD image acquisition has been developed. This visual monitoring of the capillary front by fluorescence is coupled with a method based on realtime fluid mass acquisition with a high resolution balance. This coupled approach allows gathering automatically and simultaneously the capillary front position and uptake fluid mass in time with a high degree of accuracy and repeatability. The consistency of this experimental investigation is discussed and demonstrated on fiber tows taken from a new E-glass non-crimp fabric by comparing the results obtained with those of other standard characterization methods such as microscopy, B.E.T. analysis and porometry by liquid expulsion. A good match was observed for fiber tow porosity, cross-section area, specific surface area and equivalent hydraulic diameter. Moreover, the robustness of this approach is also established by looking at the wicking results from two additional capillary rise tests on fiber tows. A good repeatability was obtained.
The paper starts by a short bibliographical review on fiber tow characterization by capillary rise. In order to carry out a comprehensive characterization and modeling of capillary flows through fiber tows, mechanistic imbibition models need to be implemented. In this regard, four imbibition models are introduced by considering the evolutions of the capillary height with (model I) or without gravity (model II) and of the uptake fluid mass with (model III) or without gravity (model IV). Models II and IV without gravity (also called Lucas-Washburn models) are selected to complete the characterization procedure of tow wicking properties. The new capillary rise setup based on fluorescence visualization is first presented, then validated by comparison with results from other standard characterization methods. Wicking characterization is carried out on the warp and weft tows of a non-crimp fabric. This experimental approach allows characterizing the microscopic porosity, axial permeability, capillary pressure at equilibrium and global saturation of the fiber tows. A good match is obtained with permeability predictions by the analytical Blake-KozenyCarman model. This characterization method allows also investigating the impact of fiber sizing on tow wicking. The success of this new experimental approach for fiber tows sets the stage for a comprehensive wicking characterization of engineering fabrics.
2. Bibliography
Over the last decades, several experimental studies have been carried out on capillary flows in fiber tows based on the capillary rise method. In this regard, Batch et al., Bayramli and Powell, Chwastiak, Scher as well as Pillai and Advani have all characterized wicking in fiber tows by measuring the uptake fluid mass [11,16,18-20] . Batch et al. carried out a review on the uptake fluid mass monitoring technique to characterize the wicking behaveior of compacted powders, soils and other solid porous media [11]. Bayramli and Powell, Chwastiak and Scher have also used this technique to characterize the wicking behavior along carbon fiber tows encased in PTFE tubes or held between adhesive tapes [16,18-19] . This strategy based on the uptake fluid mass was well suited for carbon fiber tows because of the difficulty in monitoring visually the transparent capillary front between opaque filaments. Indeed, these authors used transparent infiltration fluids such as alkanes. Note that alkanes are usually considered to be totally wetting fluids with respect to different kinds of surface chemistry, which allow perfect liquid spreading over the fiber surface. However, some of these alkanes are volatile. This can lead to ambiguous interpretations of the uptake fluid mass due to mass losses by evaporation and capillary condensation [19]. In this respect, pure hexadecane was the infiltration fluid selected to carry out the current wicking investigation because of its totally wetting behavior, its low volatility and non-hygroscopic behavior.
In the work of Pillai and Advani, glass fiber tows were encased between polycarbonate plates whereas, in the work of Batch et al., they were held in PTFE tubes, in order to characterize their transversal and axial wicking behavior by measuring the uptake fluid mass [11,20] . The infiltration fluids used for these capillary rise tests were several kinds of industrial fluids. Among these liquids, some are more prone to natural ageing such as corn syrup; others are not of high purity, such as motor oil. Thus, caution must be paid to the liquid quality; fluids with stable properties over time should be selected. In particular, fluid or dye particulates that could clog the tow microscopic pores must be avoided. The dye selected in this study was highly soluble in alkanes. In addition, the uptake fluid mass monitoring allows only a rough estimation of the capillary front position, because the filament packing is rarely uniform and no plug-like flows without saturation gradient take place in industrial fibers [16].
Williams et al. was among the first to monitor visually the capillary front rise in fiber tows [21]. This author studied the capillary progression of many oils and polymers along glass fiber tows at various temperatures. The tows were encased in glass tubes to control the fiber volume content. This visual procedure was carried out successfully, because the porous medium studied was transparent, such as the E-glass fiber tows of the current investigation. Indeed, the infiltration fluids provided sufficient visual contrast with glass fiber tows, thus allowing a proper monitoring of the capillary front on short wicking distances. However, the visual monitoring procedure developed by Williams was carried out manually, unlike in the previous work of Hamdaoui et al. or in the current wicking study based on automated tracking of the capillary front with a digital camera and by image analysis [21,22] . This latter approach is less prone to the experimental subjectivity of the operator and therefore can be considered as more robust. In addition, the new approach proposed here of fluorescence visualization offers a better contrast between the infiltration fluids and the fiber tows. It also avoids the problem of flow front fading over time reported by Amico and Lekakou [12,14] . Accordingly, this approach provides a greater resolution in positioning the capillary front, even in long wicking tests. Note that this visualization method with a fluorescent dye added to organic liquids with an appropriate wavelength light (black light) was also applied successfully by Kamath et al. to follow the wicking front in polymer fiber tows [23]. Using these dyes does not have any measurable effects on the wicking test results [24]. Before describing the capillary rise setup used in this investigation, the capillary flow models that will be implemented in the wicking analysis will first be presented.
3. Modeling of Capillary Flows in Fiber Tows
In order to analyze the progression of the capillary front in fiber tows, four imbibition models are presented and detailed in this section. These models give the evolutions of the capillary rise including gravity (model I) or without gravity (model II), and of the uptake capillary mass with or without gravity (model III, IV respectively).
3.1. Wetting and Wicking
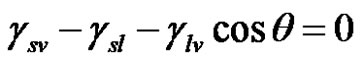
Surface tension g characterizes the effect of interfacial forces as a result of intermolecular cohesion within each phase in contact. As a result of the balance of interfacial forces, the liquid tends to form drops of spherical shape on a solid surface. On the other hand, the imbalance of interfacial forces leads the liquid molecules to spread over this solid surface. This relative ability of solids to attract (wetting) or to repel (non wetting) liquids at some degree is called wettability and is characterized by the equilibrium contact angle q of the liquid with the solid surface [25]. For example, for a perfectly wetting fluid, q = 0˚. The wetting phenomenon can occur on different solid geometries such as a capillary tube. The relationship between interfacial forces follows Young’s Equation (1):
 (1)
(1)
where q is the contact angle where the liquid-vapor and solid-liquid interfaces meet and glv, gsv, gsl are the liquidvapour, solid-vapour and solid-liquid interfacial tensions.
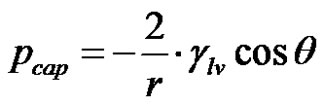
The adhesion tension, defined as glvcosq, promotes the liquid rise through capillary pores in a porous medium. This capillary phenomenon in porous media is also called the “wicking”. Considering the geometry of the pores, the driving force of the capillary flow in a tube of radius r can be described by a capillary pressure pcap evaluated by the standard Young-Laplace’s law across the liquid interface as follows:
 (2)
(2)
3.2. Jurin’s Law
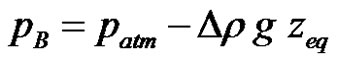
The capillary rise in a tube tends asymptotically towards an equilibrium height zeq, for which the capillary and gravitational forces are in static equilibrium. The equilibrium height zeq is such that the liquid pressure pB under the meniscus is given by Pascal’s law:
 (3)
(3)
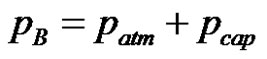
where patm, g and Dr denote respectively the atmospheric pressure, the gravity and the difference in mass density between the liquid and the vapour/gas. Usually, the vapor mass density is neglected and the mass density difference Dr is replaced by the liquid mass density r. The liquid pressure pB at equilibrium obeys the following balance:
 (4)
(4)
where pcap denotes the pressure that drives the capillary rise. Equations (3) and (4) together with Equation (2) give the capillary height zeq (also noted zJurin) in static equilibrium:
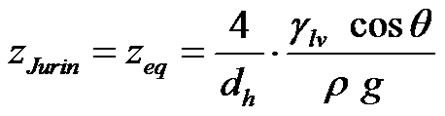 (5)
(5)
where dh is the equivalent hydraulic diameter of the capillary canal. Equation (5) is called the Jurin’s law. If A and P denote respectively the cross-sectional area of the capillary canal and its wetted perimeter, the hydraulic diameter of a cylindrical tube is defined as follows:
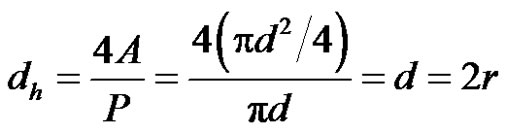 (6)
(6)
In a porous medium, the equivalent hydraulic diameter is defined by Equation (6) after evaluating the average cross-sectional area A of the pores and their wetted perimeter P.
Below a characteristic capillary length denoted lcap and generally of the order of a few millimetres, the deformation of the spherical-shaped meniscus as a result of gravity is not significant. This length can be estimated by comparing Young-Laplace’s capillary pressure pcap defined by Equation (2), in which the equivalent hydraulic diameter dh of the capillary canal is equal to lcap, to the hydrostatic pressure rglcap at a depth lcap in a liquid of density ρ. Equation (2) becomes then:
 (7)
(7)
The above Young-Laplace’s pressure is balanced by the hydrostatic pressure at equilibrium. Hence the capillary length lcap can be defined as follows for a perfectly wetting fluid, namely when the wetting angle q is zero [25]:
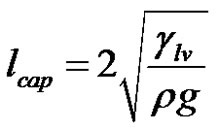 (8)
(8)
The impact of gravity can be neglected for capillary canal sizes of equivalent hydraulic diameter dh < lcap. This is validated through a dimensionless number called Bond number and defined as follows:
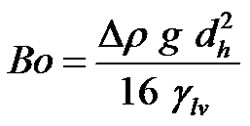 (9)
(9)
when, the Bond number is high, dh > lcap and the impact of gravity cannot be neglected.
3.3. Modified Jurin’s Law
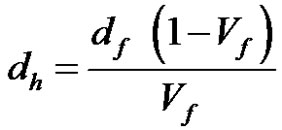
Woven fibrous reinforcements (see Figure 1(a) are porous media composed of oriented fiber bundles (see Figure 1(b)). Such materials can be modeled as a statistical set of cylindrical capillary tubes parallel and tortuous [26]. The equivalent hydraulic diameters of these capillary tubes inside the fiber bundles are defined by the ratio between the cross-sectional area of the flow canals and the wetted perimeter. If Vf denotes the fiber volume content of the fiber bundle and df is the average filament diameter, the theory of porous media gives the following expression for the equivalent hydraulic diameter: [21]
 (10)
(10)
From this definition, a modified expression of Jurin’s law (5) can be proposed in fiber tows:
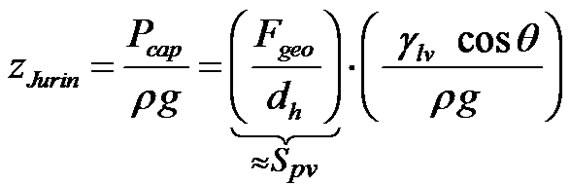 (11)
(11)
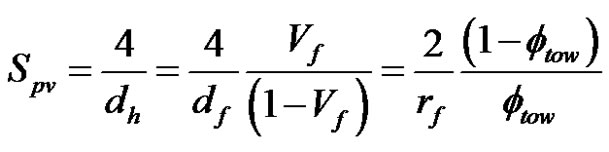
where Fgeo is a constant depending on the pore size distribution and the flow direction with respect to the capillary medium [27]. In this regard, the traction and the twist of the fiber bundles can have a significant impact on its pore size distribution, thus on Fgeo and other structural parameters of the fiber tows [28]. The first right term in the modified Jurin’s law (11) can be estimated by the theoretical specific surface area Spv of the fiber bundles per unit pore volume by assuming the fibers to be smooth parallel cylinders in a regular array [29]. This latter property of the fiber bundles can be evaluated from their fiber volume content and their specific surface area per unit mass Sm. In a porous medium, this parameter Sm represents the ratio of the total surface of the pores to the solid mass and can be characterized experimentally by
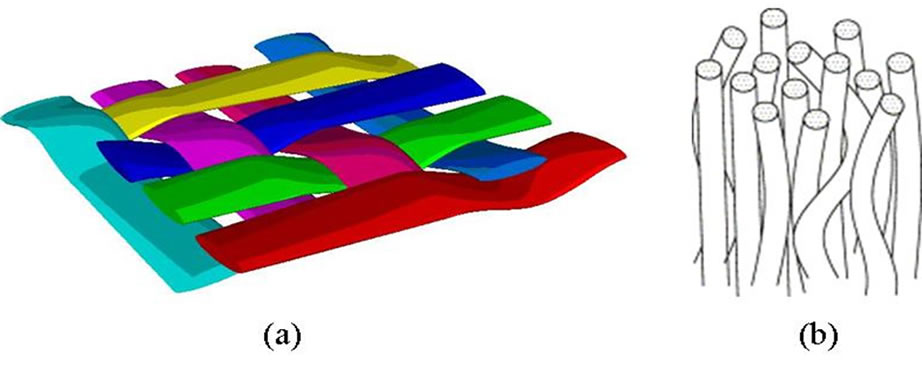
Figure 1. Origin of the tortuosity of fiber bundles and filaments in fibrous reinforcements; (a) woven pattern of a 2D reinforcement; (b) intra-bundle tortuosity.
Brunauer-Emmett-Teller (B.E.T.) analysis technique, a method based on the multilayer adsorption of gas molecules on solid surfaces [30].
The tow specific surface area per unit mass Sm can be also estimated from the filament diameter and the glass mass density rglass by assuming the filaments to be smooth cylinders packed in a regular array (although it is rarely the case for real tow filaments):
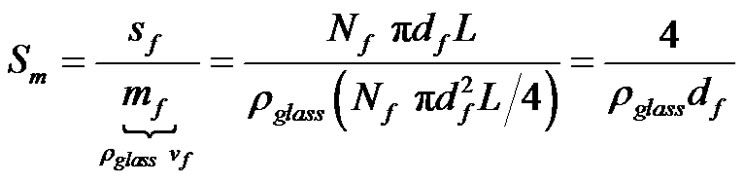 (12)
(12)
where sf, mf and vf are respectively the surface, mass and volume of all the filaments of the fiber tow, L is the length of the fiber tow and Nf is the number of filaments per tow. Sf is the specific surface area of a fiber tow per unit fiber volume defined as follows:
 (13)
(13)
If the microscopic pore volume vpore in a fiber tow is given by:
 (14)
(14)
The specific surface area Spv per unit of pore volume can be estimated from the filament diameter and the tow fiber volume content as follows:
 (15)
(15)
Knowing Spv, Jurin’s capillary height can thus be evaluated by Equation (11). According to the global curvature of the meniscus, default values for Fgeo are respectively 4 and 2 for capillary-driven flows parallel and perpendicular to the fiber tows [12]. However, capillary flows in fiber tows are rather complex and tridimensional interactions occur between the axial and perpendicular flows. Thus these geometrical factors Fgeo have been generalized in tensorial form by Ahn et al. [27]. A value of the geometrical parameter Fgeo between 2 and 4 is usually obtained by non linear fitting of the capillary height evolution in time for long wicking tests [27]. In order to separate explicitly the geometrical parameter Fgeo from the specific surface area Spv in Equation (11), a new expression of Jurin’s height in fiber bundles may be introduced as follows:
 (16)
(16)
where the constant fgeo, 0 ≤ fgeo ≤ 1, is a linear scale factor of Fgeo. This parameter depends on the pore size distribution and the flow direction with respect to the fiber tows.
Furthermore, as defined by Bear, another concept called tortuosity must be introduced to take into account the non rectilinear path of the fiber bundles and filaments in woven fabrics resulting from the woven architecture of the fabric (see Figure 1(a)) and from the twisting of fiber bundles (see Figure 1(b)) [29]. Tortuosity represents the ratio between the real distance Le(t) covered by the fluid during imbibition and the equivalent distance L(t) or z(t) if measured along a straight line:
 (17)
(17)
In summary, the fiber bundles in a woven fabric can be modeled by a porous system of parallel capillary channels of hydraulic diameter dh and tortuosity t [13].
4. Capillary Creeping Flow and Imbibition Models
During isothermal capillary rise experiments in immobile, non stretchable and tortuous fiber tows, the fluids used are considered incompressible and Newtonian. In this respect, Figure 2 shows the typical capillary height evolution in time of such a liquid through a porous medium. The progression of the capillary front tends asymptotically towards an equilibrium height zeq, for which the capillary and gravitational forces balance each other in static equilibrium. Figure 2 highlights also the linear flow regime of Lucas-Washburn for which the gravity contribution can be neglected at the beginning of the capillary rise. In that situation, capillary forces are balanced only by viscous forces.
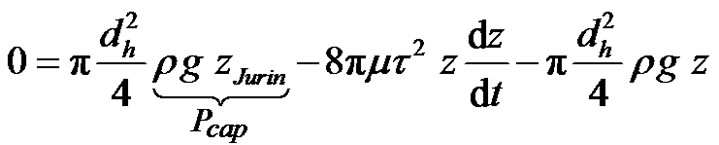
By summing up along the z direction the forces driving a Hagen-Poiseuille flow in a tortuous fiber bundle, the balance of capillary, gravity and viscous forces gives [26]:
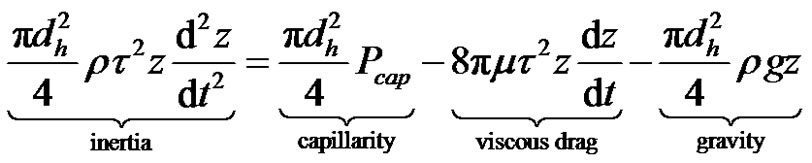 (18)
(18)
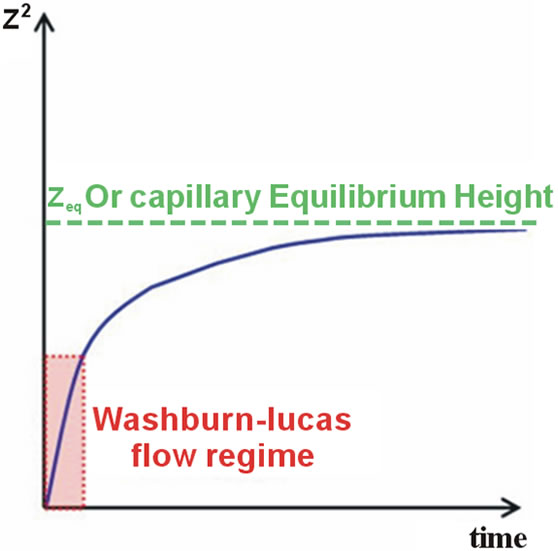
Figure 2. Schematic view of the flow front evolution during a typical capillary rise through a porous medium.
where m, Pcap, dh and t denote respectively the fluid dynamic viscosity, the capillary pressure in the fiber tow, the equivalent hydraulic diameter (10) and the tortuosity of the fiber bundle. The inertia term and the transient wettability term are relevant only during the first micrseconds of imbibition through the largest pores ( ) and for low viscosity liquids such as low molecular weight alkanes [31]. Neglecting inertia and using the modified Jurin’s law of Equation (11) to express the capillary pressure, Equation (18) becomes:
 (19)
(19)
4.1. Lucas-Washburn Imbibition Models
4.1.1. Imbibition Model I
By rearranging and simplifying Equation (19), an ordinary differential equation (ODE) describing the axial progression in time of the capillary height in fiber tows is obtained:
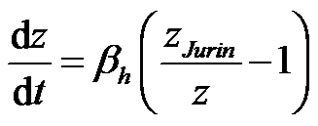 (20)
(20)
where
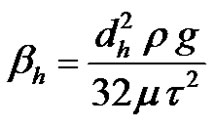 (21)
(21)
As a result, a first imbibition model (model I) arises from the space-time integration of Equation (20) as follows:
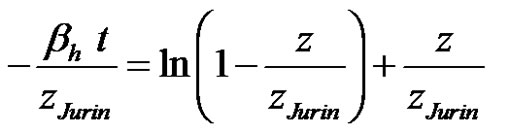 (22)
(22)
4.1.2. Imbibition Model II
If the gravity contribution is neglected, i.e., for short imbibition distances ( ), the previous ODE (20) reduces to the following evolution model of velocity:
 (23)
(23)
The integration of this ODE results in imbibition model II, known as the classical Lucas-Washburn law of capillary height evolution for short imbibition distances [32]:
 (24)
(24)
where
 (25)
(25)
Parameter Bh represents the Lucas-Washburn (LW) slope of the square of the capillary height evolution during the linear Lucas-Washburn flow regime (see Figure 2). It was also referred as a diffusion or capillary rate coefficient (m2/s) [22]. This parameter Bh can be obtained by linear regression on the evolution of the square of the capillary front height in time.
4.1.3. Imbibition Model III
On the other hand, the evolution of the capillary uptake fluid mass m(t) can also be considered for short imbibetion distances through immobile tortuous fiber bundles of constant cross-section. Under the hypothesis of constant saturation, the following expression can be used to evaluate the fluid mass absorbed by capillary effects:
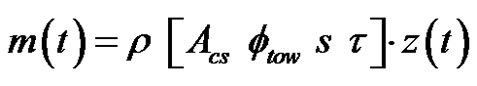 (26)
(26)
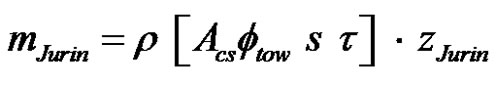
where Acs denotes the effective tow cross-sectional area normal to the flow direction, ftow is the fiber tow porosity and s, 0 £ s £ 1, is the global level of tow saturation. The fiber tow porosity can be evaluated as follows:
![]() (27)
(27)
The following equation can be obtained for the capillary height:
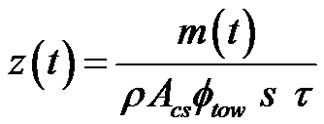 (28)
(28)
By substituting Equation (28) into the ODE of the first imbibition model (20), in case of significant gravity the uptake wicking mass can be modeled by the following ODE:
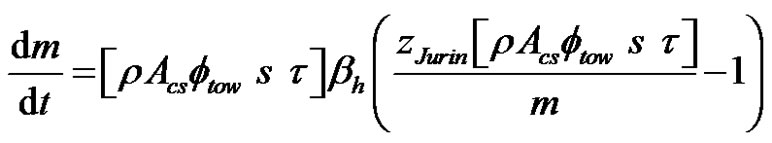 (29)
(29)
The integration of this ODE results in a new model describing the evolution in time of the capillary mass (imbibition model III):
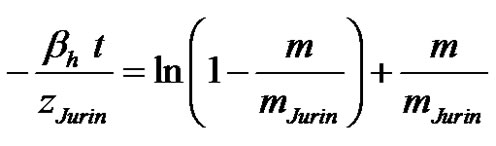 (30)
(30)
where
 (31)
(31)
4.1.4. Imbibition Model IV
However, if gravity can be neglected, a simpler imbibition model is derived from the previous one by substituting Equation (28) into the ODE (23) of imbibition model II:
 (32)
(32)
where
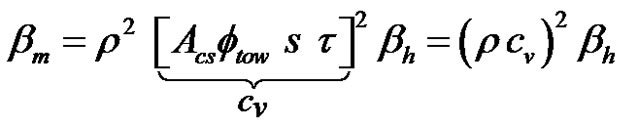 (33)
(33)
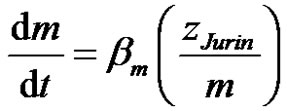
Parameter cv in the above equation is referred to as the volumetric fluid-holding capacity per unit length (m3/m) of the fiber tow [28]. It depends only on the architecture of the fiber bundles. The integration of this ODE results in the new imbibition model IV, which describes the evolution in time of the uptake fluid mass for short imbibition distances (without gravity):
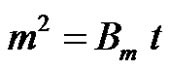 (34)
(34)
where
 (35)
(35)
Parameter Bm is the LW slope for the square of the capillary mass evolution during the linear Lucas-Washburn flow regime (see Figure 2). It can be obtained by linear regression on the evolution of the square uptake wicking mass in time for short imbibition distances.
4.1.5. Capillary Rise Measurement
Special caution must be given to the interpretation of the uptake fluid mass measured in the standard capillary rise method. Firstly, significant saturation gradients can develop along the fiber bundles as a result of the pore size distribution such that the constant saturation flow hypothesis may become questionable. Secondly, the meniscus and buoyancy forces participate also in the evolution of the total measured mass mtotal. Indeed, when a fiber bundle is dipped into a liquid, an interfacial force Fmeniscus develops at the meniscus contact line along the wetted perimeter Pw of the bundle. According to the balance of interfacial forces along the contact line described by Equation (1), the dipped fiber bundle can be pulled or pushed off by the liquid. Moreover, according to Archimedes’ principle, a buoyancy force Fbuoyancy develops along the submerged part of the dipped bundle. The mass offset from these two forces must be taken into account as follows in order to evaluate the net uptake fluid mass m(t) [20]:
 (36)
(36)
where mmeniscus and mbuoyancy denote respectively the meniscus and buoyancy mass contributions. This offset explains the discontinuity observed in the total measured mass when the fiber bundle comes in contact with the liquid. The buoyancy force can be minimized by limiting the dipping depth of the fiber tow under the liquid surface. This can be achieved by slowly approaching the fiber bundle on to the liquid surface and by automatically stopping the displacement when contact is detected between the fiber bundle and the liquid.
By selecting a characterized probe fluid with a totally wetting behavior to conduct the wicking tests, the contribution of the fabric micro-structure geometry to imbibition can be isolated and quantified [13]. For instance, if the initial bundle mass and all the properties of the infiltration fluid are known, it is possible to evaluate the tow porosity ftow from the final uptake fluid mass after the capillary rise experiment (mass at the end of wicking test):
 (37)
(37)
Furthermore, as mentioned in the work of Hsieh and Yu, the apparent contact angle  of the meniscus can be deduced from the initial or the final mass jump and from the fluid and tow characteristics [15]. If Fmeniscus denotes the force necessary to expel a fiber bundle out of a liquid, the corresponding final mass jump mmeniscus observed when the fluid looses contact with the fiber bundle is given by:
 (38)
(38)
where Pw and glv are respectively the wetted perimeter (contact line) and the liquid-vapor interfacial tension. The contact angle is obtained readily from Equation (38) as follows:
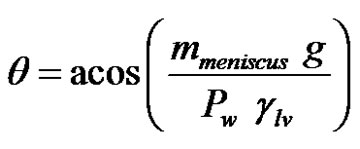 (39)
(39)
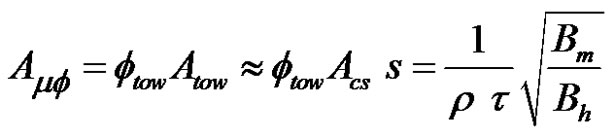
4.2. Global Tow Saturation
The global tow saturation  can be evaluated from the slopes of the height (25) and mass (35) evolutions as computed by Lucas-Washburn laws (24) and (34) ADDIN EN.CITE ADDIN EN.CITE.DATA [12, 14] . Indeed, dividing Bm by Bh and substituting the coresponding expression of cv defined in Equation (33), the tow saturation
  can be computed as follows:
 (40)
(40)
where Acs denotes the effective tow cross-section area in a normal direction to the flow. The instantaneous tow saturation s(t) can also be evaluated from the evolutions of the capillary height and weight as follows:
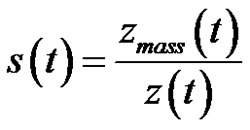 (41)
(41)
where z(t) and zmass(t) denote respectively the measured height of capillary rise and the height of capillary front interpolated as follows from the evolution of the wicking mass:
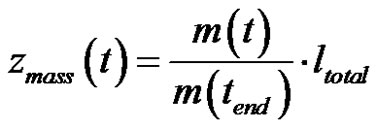 (42)
(42)
In the above equation, ltotal is the total length of the fiber tow, while m(t), m(tend), denote respectively the current wicking mass and the final uptake fluid mass. This estimation approach of the saturation in a porous medium with significant polydispersivity of its pore size distribution was already considered in the work of Bico and Quéré [33].
Equation (40) can be modified to provide a rough approximation (underestimation) of the total cross-sectional area of microscopic pores Amf normal to the flow direction:
 (43)
(43)
where Atow is the total cross-section area of the fiber tow. This leads to the following estimation of the anisotropy ratio  of the microscopic pore areas between the two fiber tow directions (with the same stitching/weaving pattern, and thus the same tortuosity):
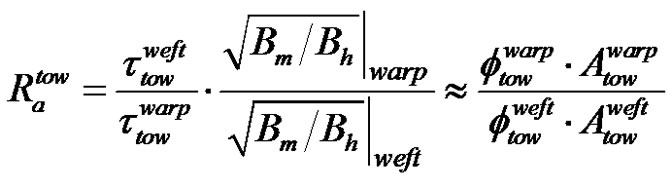 (44)
(44)
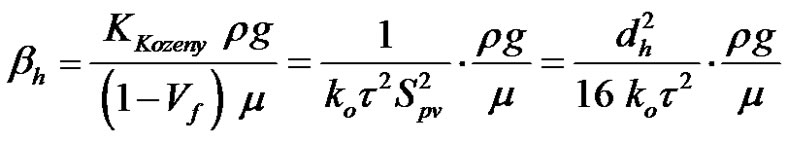
4.3. Axial Permeability of the Fiber Tows
The permeability of a porous medium can usually be approximated by analytical models such as BlakeKozeny-Carman Equation [29]. This model has often been used to predict the axial permeability of aligned unidirectional fiber tows with a reasonable consistency with experimental values [34]. Let  denote the radius of the tow filaments. Equation (20) can be rewritten as an unidirectional Darcy’s law using BlakeKozeny Carman model [21,34] . This yields the following analytical expression of the axial permeability of the fiber tow:
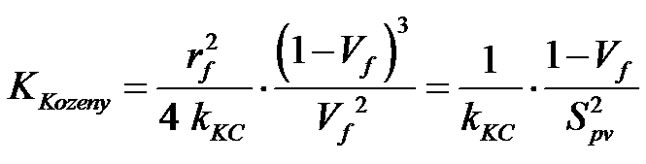 (45)
(45)
where
 (46)
(46)
and Kozeny constant kKC defined as follows as a function Kozeny geometrical constant ko: [29]
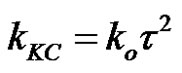 (47)
(47)
Using Equations (45) and (47), Equation (21) becomes:
 (48)
(48)
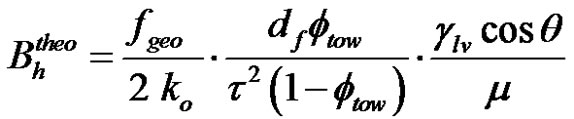
Thus, substituting Equations (16), (46) and (48) in Equation (25) gives a new theoretical prediction of the LW slope  as follows:
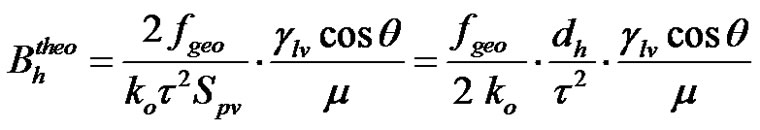 (49)
(49)
or
 (50)
(50)
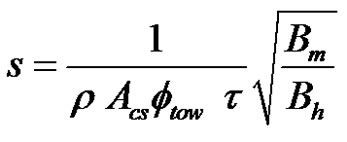
The experimental axial permeability of fiber tows can be deduced by substituting Equations (11) and (48) into Equation (25) and by isolating the permeability term as follows:
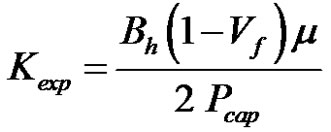 (51)
(51)
The experimental permeability given by Equation (51) can be compared to the analytical permeability derived from Equation (45). This comparison allows estimating the experimental Kozeny constant  as follows:
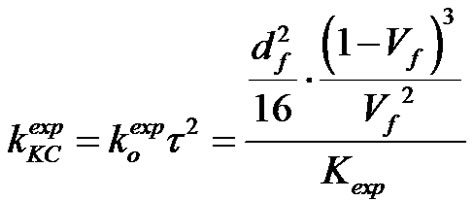 (52)
(52)
In order to evaluate the experimental permeability, the capillary pressure Pcap at equilibrium in a fiber tow needs to be characterized. This issue is addressed in the next section.
4.4. Capillary Pressure at Equilibrium
The capillary equilibrium height zeq or the capillary pressure Pcap at equilibrium can be predicted from the mass and height data acquired during capillary rise tests [12]. As shown in Figure 2, the capillary rise is a very slow asymptotic phenomenon. Thus capillary tests must last a significant time, otherwise the evaluation of the equilibrium capillary height or pressure is underestimated [14]. Indeed, in very long tests, it was observed that the experimental values of the equilibrium capillary height converge asymptotically to the theoretical value. Therefore, imbibition models would be more reliable if the equilibrium capillary height or pressure were computed from the properties of the fiber tow, of the fluid and of the fiber fluid interface that would be derived experimentally from other characterization tests. The equilibrium capillary pressure in the fiber tows can be evaluated by the modified Young-Laplace’s law of Equation (16) as follows [11]:
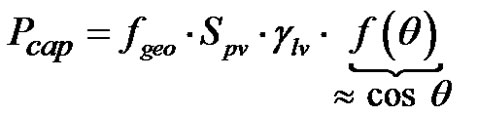 (53)
(53)
Both nonlinear imbibition models I and III are put aside for further wicking analysis because the slow asymptotic behavior of the capillary rise leads to a systematic underestimation of the equilibrium capillary height zJurin and of the capillary pressure Pcap at equilibrium. Therefore imbibition models II and IV are combined with modified Young-Laplace’s law (53) to characterize wicking flows in fiber tows, evaluate their axial permeability and global saturation.
5. Material Characterization
5.1. Fiber Tow Characterization
In order to validate the morphological and wicking characterization of fiber tows by capillary rise, tests were carried out with a non crimp fabric and hexadecane as infiltration fluid. Fiber tows taken from a bidirectional non crimp fabric (NCF) were tested in this investigation (see Figure 3(a)). This fibrous reinforcement is made of VetrotexÔ glass warp (735 tex) and weft (275 tex) tows by JB Martin® (TG15N60A/#3028) stitched together by polyester binder filaments (17 tex). The polyester filaments hold the untwisted glass strands together as shown in figure 3(b). This unbalanced fabric has 45% of glass filaments along the warp and 55% along the weft direction. The results of the fabric characterization are summed up in Tables 1 and 2. Note that the information provided by the fabric supplier appear in parenthesis in both tables.
5.1.1. Microscopic Image Analysis
In order to prepare fiber tows for microscopic analysis, laminates were made by capillary impregnation with D.E.R.383 epoxy resin mixed with 30 PHR of amine hardener in order to cure at room temperature with low shrinkage. After the resin is fully cured, samples were cut out with a diamond saw, cast in epoxy and polished with sanding papers (60, 120, 240, 400 - 15 mm grains) as well as polishing pastes (9 mm and 1 mm grains). The samples were analyzed by a JEOL JSM840 scanning electron microscope (SEM), an optical microscope from Nikon
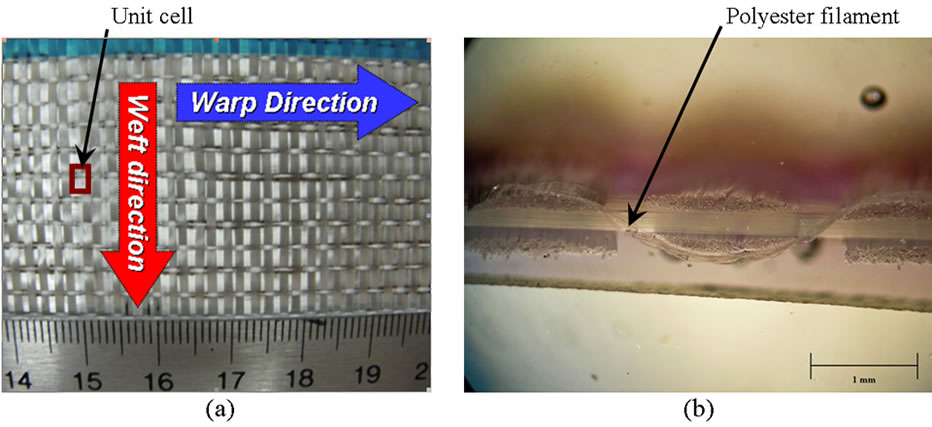
Figure 3. Pictures of the TG15N60A E-glass NCF from JB MartinÒ: (a) picture showing the warp and weft directions and fabric unit cell; (b) binocular microscopic image along the weft showing a polyester binding filament.
Japan LU1176C-Clemex and an Olympus SZ61 binocular microscope. The filament diameters and the total crosssectional areas of the fiber tows were measured by boundary detection and ellipse fitting algorithms available in Matlab. The mean diameters of the warp and weft filaments turned out to be about 14.9 mm and 13.1 mm respectively. The average cross-sectional areas of the warp and weft tows of elliptical shape were found to be respectively 0.54 mm2 (2.20 mm ×0.32 mm) and 0.178 mm2 (1.347 mm × 0.168 mm).
The filament tow packing, tow porosity and the number of filaments per tow were also evaluated from the microscopic images (see Figure 4(a)). From this analysis, the warp and weft tows turn out to possess around 1660 and 780 filaments respectively. The filament tow packing follows more a square rather than hexagonal configuration. Local tow porosities showed significant variability in the microscopic images. Indeed, the warp and weft tows gave approximate values of porosity around 49% and 50% respectively with 20% relative variability. Thus, it would be more convenient to characterize the wicking properties of fiber tows and get the LW slopes (25) and (35) from the imbibition of a significant number of fiber tows. It was observed that for the same tow porosity, two experiments can give different rates of impregnation if they exhibit different levels of heterogeneity in pore size distribution [16].
5.1.2. Thermogravimetry Analysis
A Q500 thermogravimetric analyzer (TGA) from TA Instruments was used to measure the degradation temperature Tsizing of the sizing and the sizing mass fraction. Rsizing in the fiber tows. As shown in Table 1, the fabric starts to degrade at 245˚C due to the presence of this fiber sizing. A pyrolytic oven was used to evaluate the sizing mass fraction of the fiber tows, which turned out to be around 0.4%.
5.1.3. Analysis of the Final Uptake Fluid Mass
The final uptake fluid mass in the fiber tows was characterized from the capillary rise experiments using a CP225D Sartorius micro-balance (10 mg resolution) and
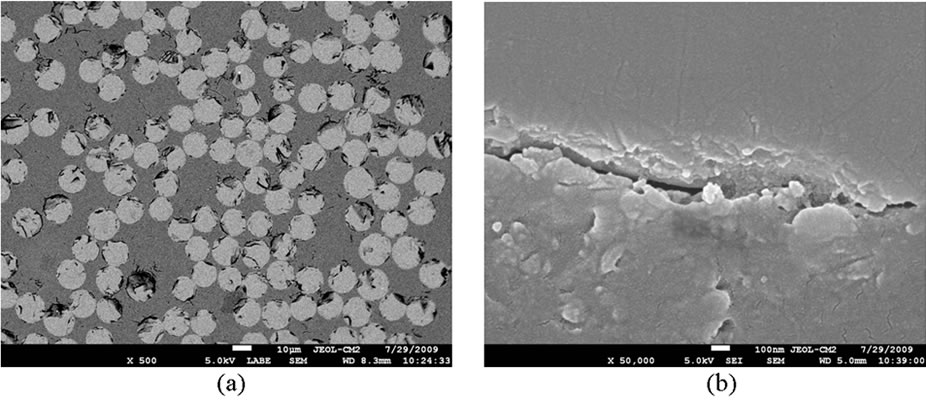
Figure 4. Microscopic (SEM) image of fiberglass tow: (a) showing the filament distribution; (b) SEM image of the resin-fiber interface.
a totally wetting fluid of low volatility (Sigma-Aldrich® 99% pure hexadecane). The tow porosity was calculated from the known fiber volume of the tow samples and the total volume of fluid absorbed by capillarity. The final uptake fluid mass measured after capillary rise experiments gave values of the warp and weft tow porosity around 45% and 44% respectively. These analyses showed to have a lower variability than the 2D microscopy analyses. Finally, the mass density of glass rglass measured by buoyancy principle was of 2.57 g/cm3, which is close to the value of 2.6 g/cm3 given by the manufacturer.
5.1.4. Specific Surface Area of the Fiber Tows
The specific surface areas of the weft and warp tows were measured with an Autosorb-1 B.E.T. characterization apparatus from Quantachrome®. As mentioned previously, the B.E.T. characterization method is based on the multilayer adsorption theory of gas molecules on a solid surface. This technique can be used to measure the specific surface area Sm per unit mass of porous materials by evaluating the molar volume of adsorbed gas on the surface of the porous material [25]. Nitrogen was used in the current surface analysis. Unfortunately, the specific surface areas of the current glass tows were too low to be accurately characterized with nitrogen. For this range of specific surface areas, krypton would have been more appropriate than nitrogen, but this gas was not available to conduct the analysis [35].
Table 2 gives the tow specific surface areas, which confirmed the already high variability of tow properties
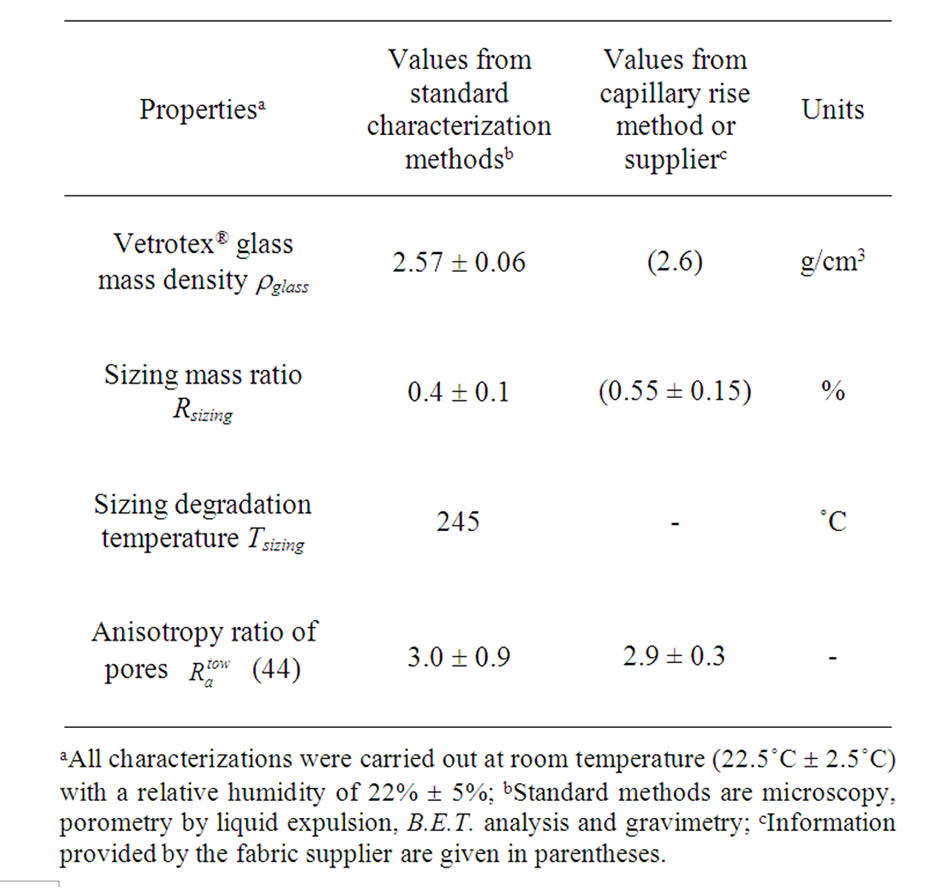
Table 1. Properties of the JB Martin TG15N60A non-crimp fabric.
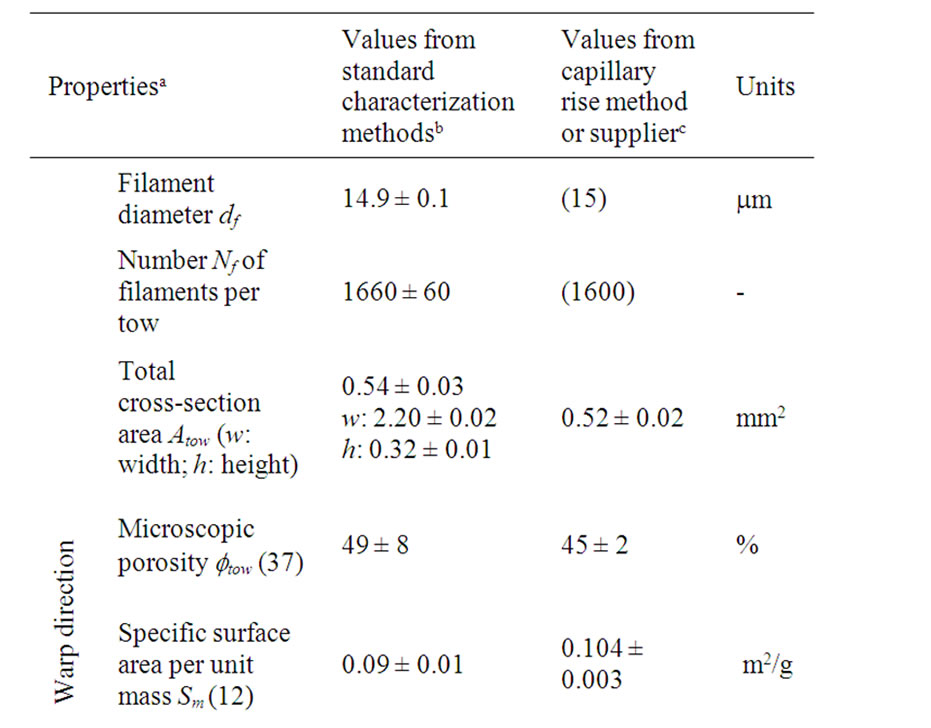

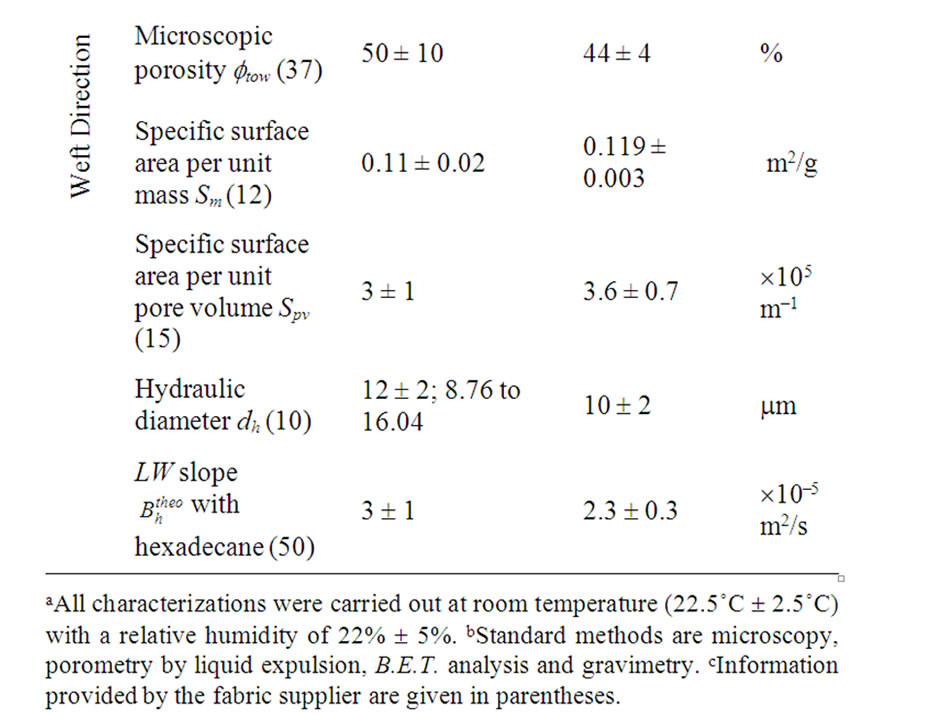
Table 2. Properties of fiber tows of the JB Martin TG15N60A non-crimp fabric.
observed by visual and microscopic image analysis. Indeed, the warp and weft tow specific surface areas Sm per unit mass were found to be around 0.09 m2/g and 0.11 m2/g with a relative variability of 20%. Moreover, assuming the fibers to be smooth cylinders packed in a regular array, the tow specific surface areas Sm per unit mass can be estimated by Equation (12). The estimated values confirmed those obtained by B.E.T. characterization. As reported in Table 2, the specific areas Sm calculated by Equation (12) for the warp and weft tows were 0.104 m2/g and 0.119 m2/g respectively. Finally, the values of the specific surface area Spv per unit of pore volume estimated by Equation (15) overlapped once again in the warp and weft directions as reported in Table 2. Indeed, the calculation of Spv based on 2D microscopic characterization of the tow porosity and filament diameter gave 2.8 ×10⁵ m–1 and 3 × 10⁵ m–1 for the warp and weft tows respectively. Furthermore, the calculation of Spv based on 3D B.E.T. tow characterization was consistent with a lower variability with the analysis of the final uptake fluid mass in the warp and weft tows. According to this 3D characterization, Spv values of the warp and weft tows were found to be 2.8 × 10⁵ m–1 and 3.6 ×10⁵ m–1 respectively.
5.1.5. Porometry Analysis
The range of the hydraulic diameters of the weft and warp tows was investigated on samples of fabric ply with a Porometer 3 Gzh from Quantachrome. Pore size measurements were carried out by in-plane capillary flow porometry by expulsion of a totally wetting liquid (Porofil™ from Beckman Coulter Corp). This method gives the microscopic pore size distribution of the fabric. As reported in Table 2, a wide range of pore sizes between 8.76 mm and 16.04 mm with an average value of 12 mm was obtained. This result is consistent qualitatively with microscopic observations. Applying Equation (10) to the tow microscopic porosity and filament diameter gives equivalent hydraulic diameters of 12 mm and 10 mm for the warp and weft tows respectively.
5.1.6. Discussion
The results of Table 2 show also that the total cross-sectional areas of the warp and weft tows evaluated by microscopic image are consistent with the values obtained by tow imbibition and gravimetric measurements. Indeed, in both directions and for both characterization strategies, the tow cross-sectional areas overlap. According to the microscopic analysis, the warp tow area was approximately three times (3.0 ± 0.9) larger than the weft tow area. This is consistent with the experimental results of Table 1 obtained from total tow imbibition experiment (2.9 ± 0.3). Note that the tortuosity t of the fiber tows is considered to be close to unity, because of the noncrimp structure of the current fabric. Finally, the nearly quadratic filament packing implies that Kozeny geometrical constant ko should be around 57/32 [34]. Note that the warp and weft tows have similar specific surface areas and tow porosity. Thus the experimental values of fiber tow permeability derived from further wicking characterization should be close. It is worth recalling that the information that appears in parentheses in Tables 1 and 2 are provided by the fabric supplier.
5.2. Characterization of the Infiltration Fluid
A probe liquid with fluorescent tracer has been selected to carry out the capillary rise tests on fiber tows. These experiments allow investigating the wicking properties of the fiber tows. A 99% pure hexadecane from SigmaAdrich® was used in this work as infiltration fluid. This fluid was chosen because of its totally wetting behavior, its low volatility (low vapor pressure) and its non-hygroscopic behavior. This liquid was blended with a fluorescent tracer (0.1 g/liter) to improve the impregnation traceability. This increased the contrast between the capillary front and the glass fibers and prevented the fading of the flow front in time. The UV-excited Pyrromethene 567A from Exciton® was chosen for its high solubility in the fluid. This visual monitoring approach is based on a non destructive testing method called the Dye Penetration Inspection (DPI).
All the properties were characterized at room temperature (22.5˚C ± 2.5˚C) at a relative humidity (RH) of 22% ± 5%. The mass density was measured with a 25 ml pycnometer from Fisher Scientific® and a CP225D balance from Sartorius®. The dynamic viscosity was measured with a double Couette geometry, at a constant shear rate of 10 s–1, by a MCR-501 rheometer from Anton-Paar®. The surface tension was evaluated with a K14 force tensiometer from Krüss® and a platinum-iridium Wilhelmy’s plate of known wetted perimeter.
Based on Equation (38), the same tensiometer allowed measuring the dynamic contact angle and the wetted perimeter on glass filaments. For this purpose, the measurement speed was set to 3 mm/min in order to minimize the viscous and inertial effects and remain close to the range of capillary flow velocity. Moreover, segments only 3 to 4 mm long were used to ensure the rigidity of the filaments during the measurement [15]. Tensiometry was preferred over optical goniometric measurements, because the curved surface of the filaments makes it more difficult to evaluate the contact angle by an optical method [19]. The dynamic contact angle of hexadecane on glass filaments was estimated to zero degree, thus exhibiting totally wetting behavior for a typical range of spontaneous imbibition velocity.
Tensiometric measurements were also used to evaluate the apparent contact angle between the fiber bundles of the fibrous reinforcement and the probe fluid. Indeed, Equation (39) gives the contact angle from the mass jump during the initial contact between the fibers and pure hexadecane. Warp tows were chosen for their significantly larger wetted perimeter than weft tows, thus the corresponding mass jump reading was higher, which improves the relative resolution of the micro-balance measurement.
The characterization setup was first used in conjunction with a reference fluid of known properties such as a 99% pure hexane to evaluate the average wetted perimeter of warp tows, and then with the infiltrating hexadecane to measure by Equation (39) the contact angle with warp tows. Finally, for comparison purpose, a static contact angle analysis between a reference surface of clean glass and the hexadecane probe fluid was also conducted with a NRL-100 optical goniometer from Ramé-Hart®. The measured physical properties are reported in Table 3. Both measurements of apparent static contact angle between hexadecane and fiber tows or a clean glass surface gave zero degree, thus confirming the totally wetting behavior of the probe fluid. Finally, it is worth noting that all the properties of the probe fluid characterized here and reported in Table 3 were consistent with data from hexadecane supplier (Sigma-Aldrich®) and with the scientific literature [36].
5.3. Characterization of the Fiber Tow Variability
It is important to point out that the perimeter of the filaments and interfacial properties such as the advancing and static contact angles (which depend also on the fiber characteristics) exhibit a significant variability. This arises from variations in the filament size, local morphological heterogeneity of the filaments and irregular surface roughness generated by abrasion from the spinning and weaving fabrication process. A wetted perimeter analysis by force tensiometry with 99% pure hexane yielded warp and weft filament diameters of (15 ± 2) mm and (13 ± 6) mm respectively.
An additional variability stems from the chemical heterogeneity resulting from surface contamination of the filaments during manual handling of the fiber tows and from the high speed surface coating process (2 - 4 km/min) [19,37] . Indeed, during the treatment in the sizing bath, all the filaments are not coated in the same fashion. Actually, they are not treated one by one, but rather in bundles. Consequently, two types of filaments arise from this process. Firstly, outer filaments are covered by sizing and have been grafted to atmospheric contaminants that decrease their surface energy [38]. On the other hand, inner filaments are held together by the film forming agent. When pulled out of the bundle, their surfaces exhibit patches of higher surface energy. This variation in sizing distribution on the fiber surface results in inhomogeneous wicking, preferential wetting, and thus microscopic void formation inside the fiber bundles [37]. This non uniform flow has been noticed in long-run wicking tests, during which the capillary front exhibits a parabolic shape inside the fiber tows (see Figure 7(a) for an example of such a capillary front in a fiber bundle).
For these reasons, the characterization of morphological and interfacial properties from single filament analysis can become cumbersome and non representative of the fabric-polymer interactions [19]. It is more appropriate and efficient to characterize this kind of properties on a bundle of filaments by the capillary rise method [15]. In this respect, the LW slopes Bh of the capillary rise of hexadecane in warp and weft tows can be estimated by Equation (49) or by Equation (50), considering the tow tortuosity equal to unity. These values of LW slopes were calculated with the fiber tow properties of Tables 1 and 2 together with the hexadecane properties of Table 3. These values were computed either from the mass density of glass rglass, the tow specific surface area Sm and the tow microscopic porosity f obtained by image analysis or rather from the filament diameter and the tow microscopic porosity f obtained by analysis of the final uptake fluid mass. The Bh slope values are reported in Table 2. The slope predictions for the warp and weft tows were respectively 4 × 10⁻⁵ m2/s and 3 × 10⁻⁵ m2/s with the first strategy and 2.7 × 10⁻⁵ m2/s and 2.3 × 10⁻⁵ m2/s with the second one. These values were calculated for sake of comparison with the capillary rise results of the next section.
6. Experimental Setup
An experimental setup based on uptake fluid mass monitoring coupled with fluorescence visualization of the capillary front was developed to study the microscopic impregnation inside fiber tows by the capillary rise method. Although this approach was already used to study colloid transport in granular porous media, fluorescence visualization is used here for the first time with
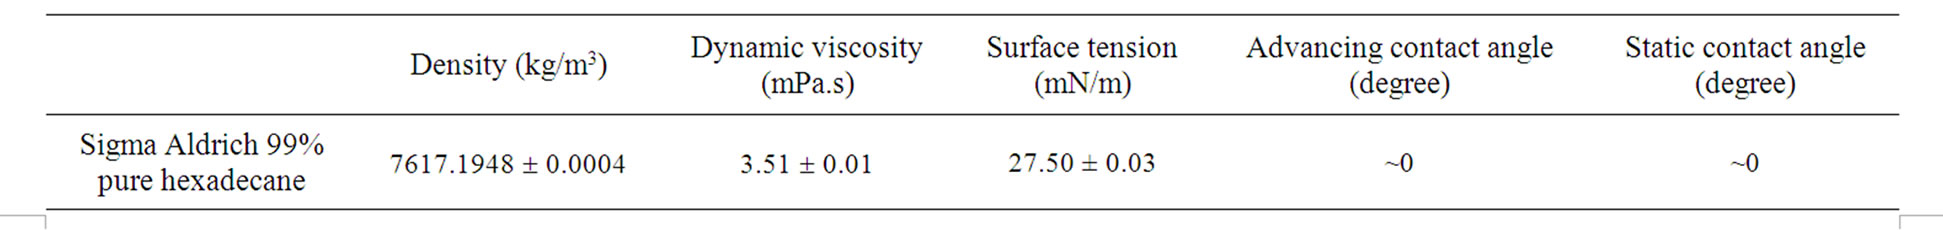
Table 3. Probe fluid and interfacial properties.
engineering fabrics. After describing the experimental setup, examples of capillary front analysis by image processing are presented.
6.1. Capillary Rise Experimental Setup
A capillary rise setup has been developed to monitor simultaneously the flow front position and the uptake fluid mass by spontaneous imbibition during 24 hours. It is composed of a 14.7 megapixels Powershot G10 digital camera from Canon® and a high resolution scale CP225D from Sartorius®. The digital camera was remotely controlled via the GB Timelapse software from Granite Bay Software® and each capture of the capillary rise progression was taken at a specific rate of 1 image per 5 seconds. The liquid containers used here were standard rheometer capsules of 63.0 mm in diameter by 9.6 mm deep. The high surface area of the liquid containers with respect to the total fluid uptake volume absorbed by the fiber tows allows minimizing buoyancy force variations during wicking tests as a result of a decrease in the liquid level.
In order to control the fiber tow velocity when it comes in contact with the liquid surface, a motorized linear stage from Newport® moves the liquid container as shown in Figure 5. The model of motorized stage chosen was the UTM100CC with a minimal velocity of 0.1 µm/s, which is in the order of magnitude of commercial tensiometers. A control software was developed to stop the motor once the fiber tow touches the liquid surface, which translates in a mass jump on the scale reading. The aluminum frame of the YDK01 Sartorius® density kit was used to perform the capillary rise tests on fiber bundles as shown in Figure 6. The fiber tows were characterized in their natural state without any glass sleeve or mass preloading by weight attachment to avoid tow fraying or edge effect possibly caused by fiber tow alterations [17]. One of the fiber tow tips was sandwiched between two small stripes of adhesive tape. This modified tip of the fiber tow was then installed on the support ring of the balance frame in order to maintain the fiber bundle vertically during the capillary rise tests. At the end of each imbibition test, the length of the fiber tows was measured by image analysis on the last pictures recorded. Two 15 Watts UV-black light bulbs from Phillips® were used to follow the progression of the fluids blended with the fluorescent dye. The complete setup was installed in a darkroom to facilitate the recording of the capillary rise.
6.2. Image Post-Treatment
After a capillary rise test, the images recorded at constant time step are post-processed by a Matlab program devised as follows:
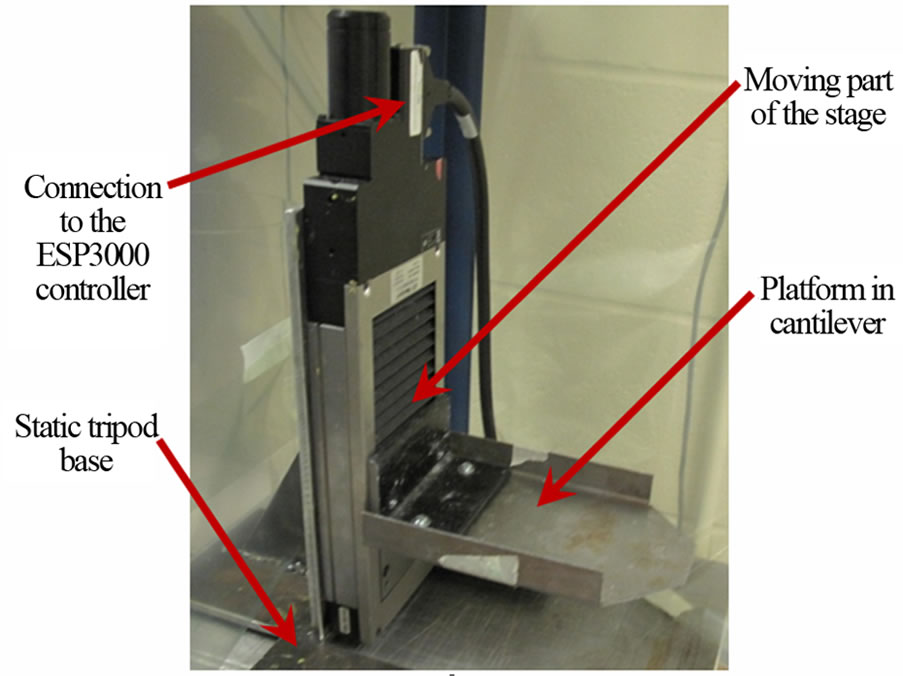
Figure 5. Newport® motorized stage with a rigid platform in cantilever configuration bolted on its moving part.
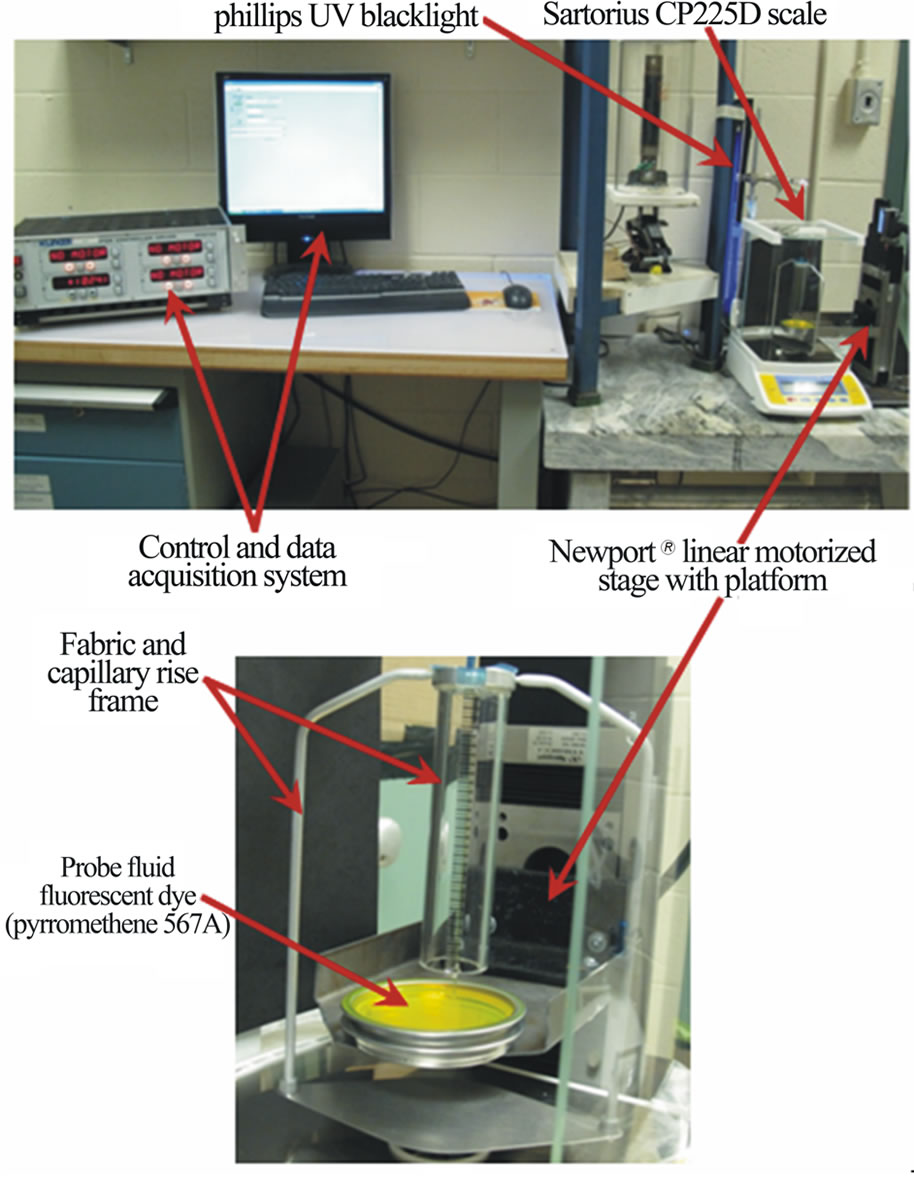
Figure 6. Capillary rise setup devised to follow the capillary front positions and the total uptake UV-dyed fluid mass.
1. Fluorescent-coloured pictures are converted into gray levels by Hue-Saturation-Intensity (HIS) algorithm.
2. In order to track the capillary front, the program performs a binary conversion using Otsu’s thresholding algorithm [39].
3. Finally, edge filtering is applied on binary pictures in order to discard noisy pixels. The pixels are removed on each pixel column except the pixel of maximum height.
This automated strategy was found to be robust and efficient to track the capillary front despite the variable brightness of the images recorded. Two factors contributed to this variable brightness: 1) the variable shutter speeds of the semi-automatic camera; and 2) the total increase in brightness resulting from the use of fluorescent liquids. Figure 7 illustrates the tracking process on images of the capillary front. Figure 7(a) shows a typical raw image recorded by the remote control software. Figure 7(b) gives the successive capillary front positions evaluated by Otsu’s algorithm and edge filtering. The average flow front positions and standard deviations were computed at each time step from the pixel images.
7. Experimental Results
7.1. Verification of Basic Assumptions
The capillary rise experiments were conducted at room temperatures (22.5˚C ± 2.5˚C and 22% ± 5% relative humidity) and atmospheric pressure (95 kPa ± 6 kPa) on warp and weft fiber tows with fluorescent hexadecane. From these wicking tests, the Young-Laplace’s Equation (2) was validated by comparing the characteristic capillary length lcap defined by Equation (8) with the equivalent hydraulic diameters dh in both fiber directions reported in Table 2. Note that lcap was estimated from the properties of hexadecane of Table 3. Accordingly, the characteristic capillary length was found to be around 4 mm, which is significantly larger than the hydraulic diameters of the warp and weft tows estimated respectively around 12 μm and 10 μm (see Table 2). The liquid columns in both fiber tow directions exhibit also Bond numbers that can be estimated by Equation (9) to be about 10–6, thus the capillary effect dominates over gravity.
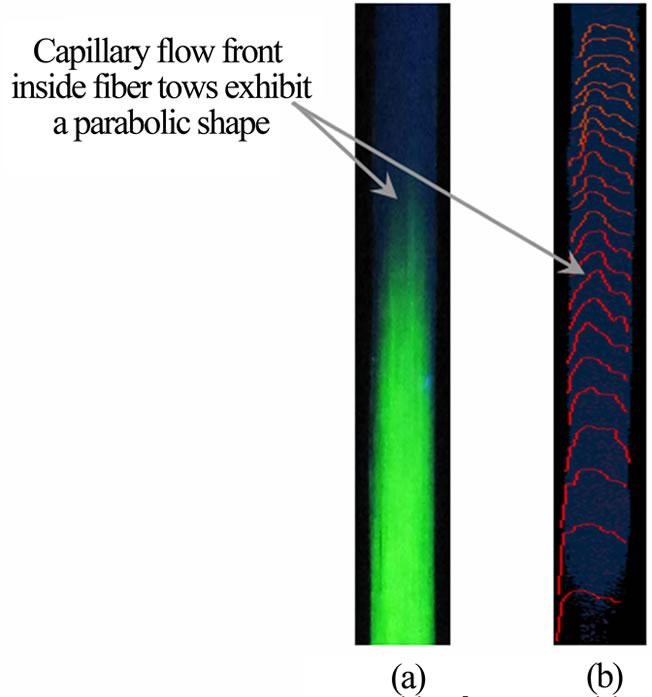
Figure 7. Capillary flow front tracking inside a fiber bundle with Otsu’s algorithm: (a) raw picture of capillary flow without image post-treatment; (b) successive flow front positions inside a fiber bundle plotted by Matlab.
Besides, the experimental Reynolds number Re of the current capillary flows inside fiber tows was evaluated to verify the hypothesis of creeping flow modeled by Darcy’s law. Indeed, they were evaluated using a length scale equal to the hydraulic diameter of fiber tows, the mass density and the dynamic viscosity of hexadecane and a characteristic velocity v evaluated for a penetration distance equal to a capillary length lcap of 4 mm. Note that v was obtained by differentiation of Lucas-Washburn model of capillary front evolution in Equation (24). The range of experimental Re defined by:
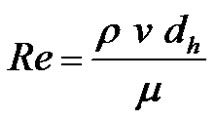 (54)
(54)
was evaluated from the following expression of the characteristic velocity v:
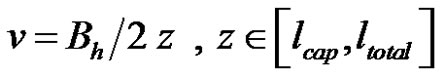 (55)
(55)
As reported in Table 4, the capillary flows inside fiber tows gave experimental Reynolds numbers below 10–2. Accordingly, Darcy’s law can be applied to these creeping flows, i.e., inertial effects can be neglected [29]. Finally, as shown in Figure 8 , the capillary rise setup has allowed investigating and covering a wide spectrum of capillary numbers, as reported in Table 4. This dimen sionless number is defined as follows:
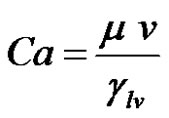 (56)
(56)
where the characteristic velocity v is still given by Equation (55). Two orders of magnitude of capillary numbers are covered by this setup, starting from around 10–3 down to about 10–5, which is considered close to the equilibrium state [27]. For this range of capillary numbers, the viscous drag is expected to affect only slightly the contact angle [19,27]. Thus, the dynamic wettability term can be neglected.
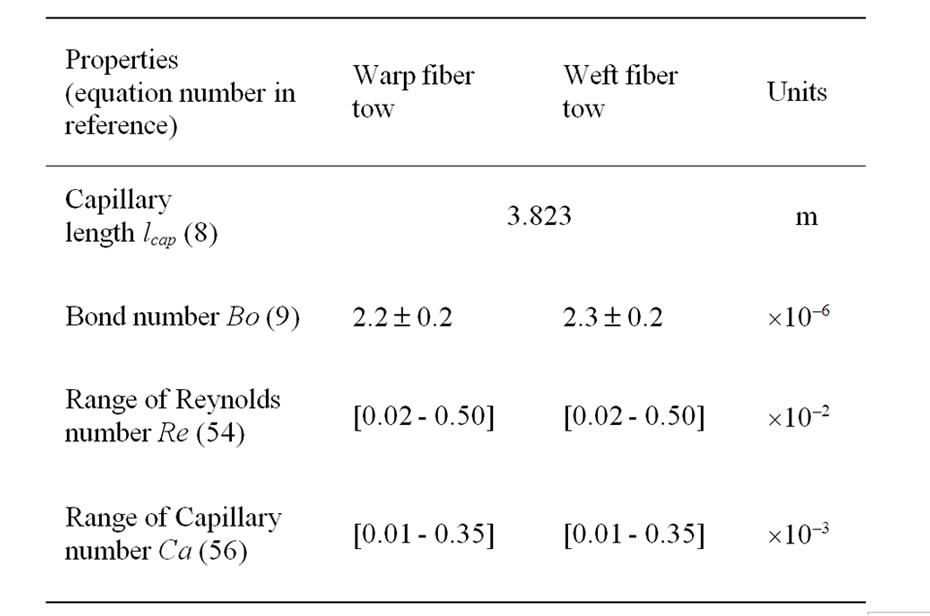
Table 4. Dimensionless numbers in warp and weft imbibition tests with hexadecane.
7.2. Wicking along Fiber Tows with Sizing
As presented in Figure 9, the evolution of the wicking mass was monitored and used to compute the total uptake fluid volumes into the fiber warp and weft tows. These values in conjunction with Equation (37) give the average microscopic porosity of the warp and weft tows of 43% and 47% respectively (see Table 5). In Figure 9, the warp tow has sucked up more fluid than the weft tow, because its average effective cross-section for capillary flow is larger than the weft one. Indeed, as reported in Tables 1 and 2, each warp tow features more microscopic flow openings than the weft tow. Hence, the capillary channels in the warp direction have larger hydraulic diameters than along the weft.
Furthermore, the theoretical warp and weft specific surface areas Spv per unit pore volume have been evaluated by Equation (15). These theoretical values of specific surface area for the warp and weft tows were calculated from data on tow filament diameter and tow. Microscopic porosity reported respectively in Tables 2 and 5. The theoretical values for the warp and weft tows were found to be respectively (3.45 ± 0.09) × 105 m–1 and (3.52 ± 0.06) × 105 m–1. The latter values are overlapping and will be used in the sequel to estimate the capillary pressure at equilibrium by Young-Laplace’s Equation (53) and Jurin’s height by the modified Jurin’s law (11).
Figures 10 and 11 show the wicking mass and height evolutions along the warp and weft fiber bundles with sizing, which follow closely the linear model of LucasWashburn (LW) for capillary flows. The LW height (25) and weight (35) slopes and the fiber tow properties evaluated from these wicking tests are reported in Table 5. These LW slopes were obtained by fitting the imbibetion models of capillary height and uptake fluid mass experimental data by a least-square regression algorithm. Despite their distinctive microscopic architectural properties, the warp and weft tows with sizing exhibit a similar wicking behavior as reported in Table 5. First, the height imbibition rates Bh (25) of the warp and weft tows were around 2.14 × 10⁻⁵ m2/s and 1.95 × 10⁻⁵ m2/s respectively. The relative difference between both values is less than the typical experimental error of 10%. Furthermore, these experimental results are consistent with previous analytical predictions of height imbibition rates  carried out in the material characterization section and reported in Table 2. Indeed, the predictions of height imbibition rates for the warp and weft tows were respectively (2.7 ± 0.3) × 10–5 m2/s and (2.3 ± 0.3) × 10–5 m2/s. Given their respective uncertainties, the analytical and experimental values of LW slopes almost overlapped.
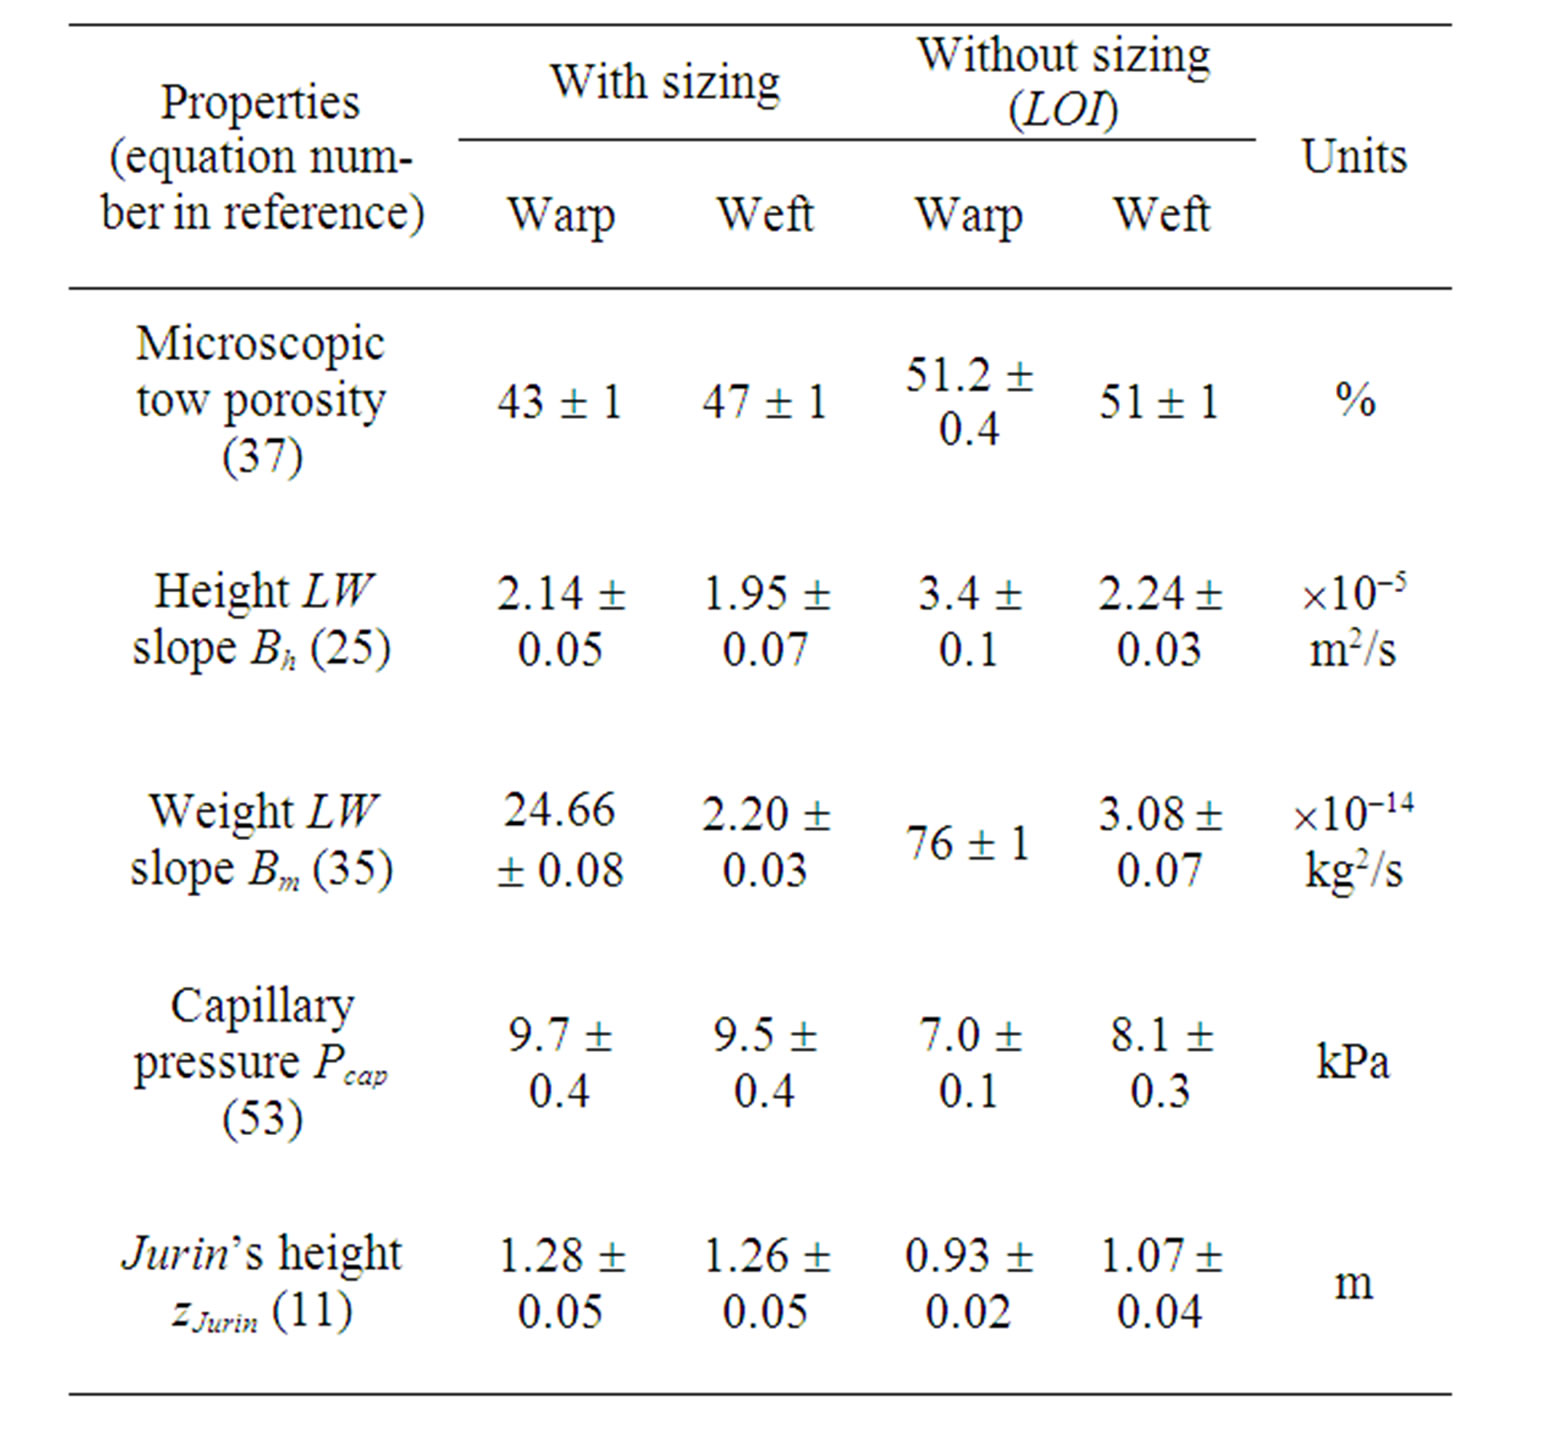
Table 5. Results extracted directly from warp and weft imbibition tests with hexadecane.
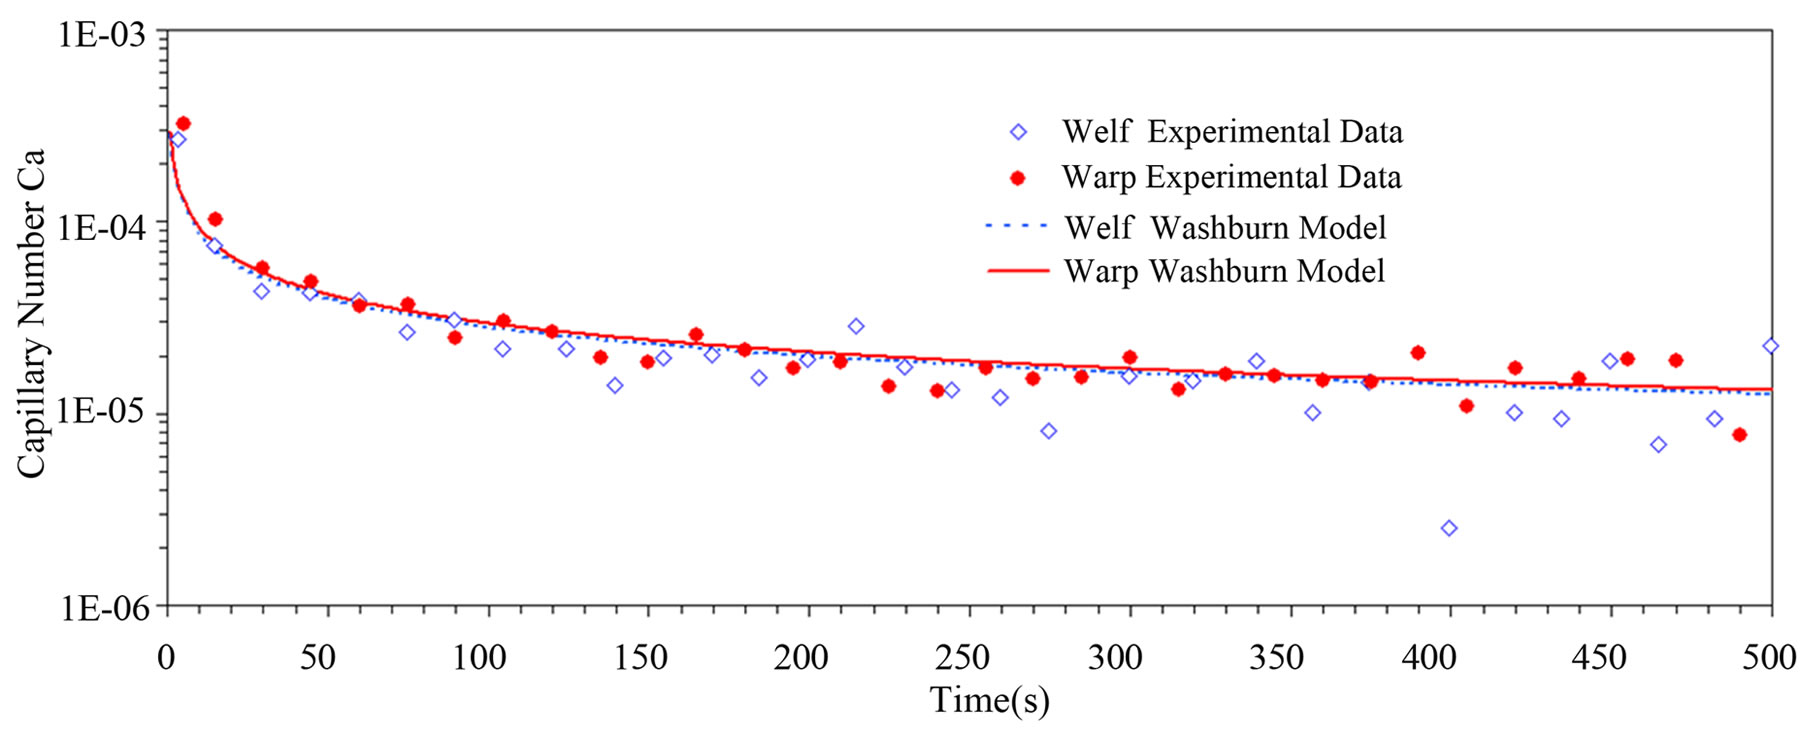
Figure 8. Evolution of the capillary number during capillary rise tests in fiber tows.
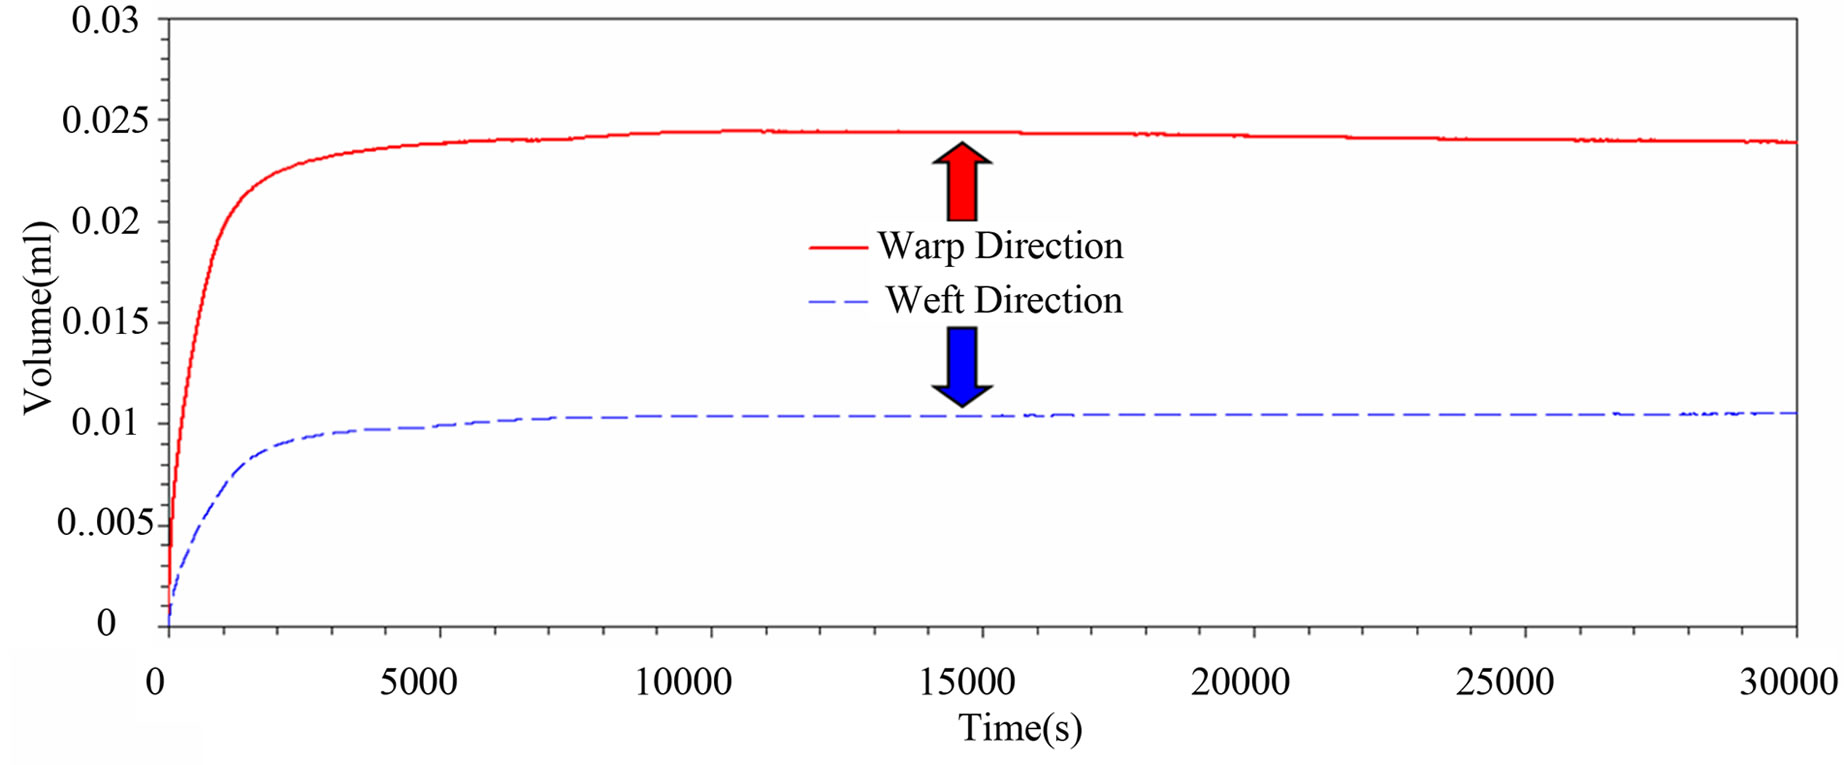
Figure 9. Imbibition volume evolution in time during capillary rise tests with hexadecane on fiber tows along the warp and weft directions.
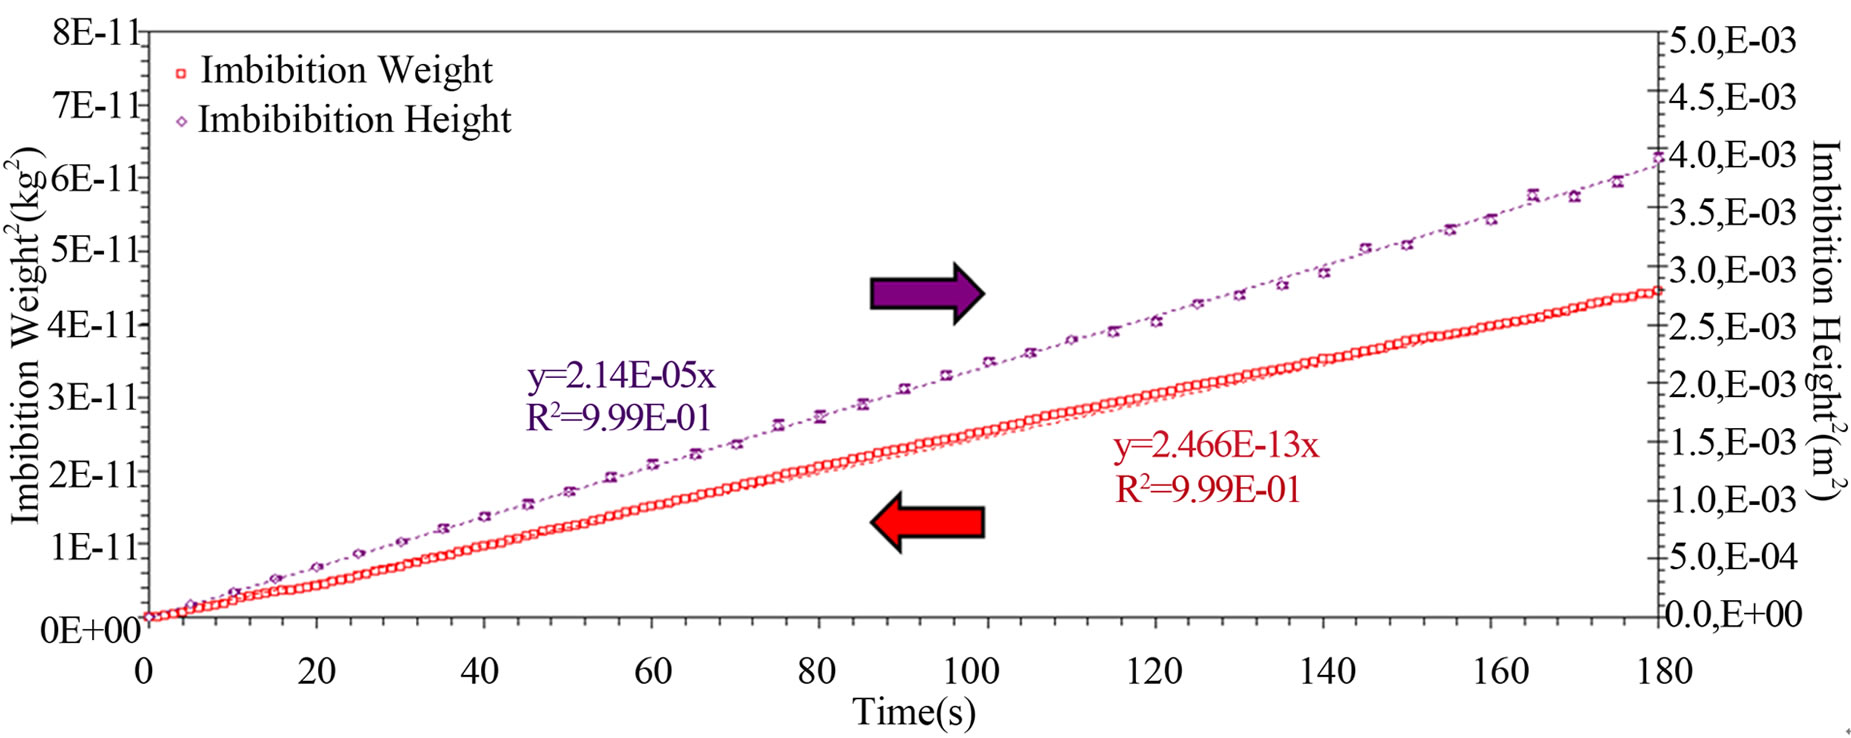
Figure 10. Lucas-Washburn fits on height and mass evolutions of hexadecane in warp fiber tows.
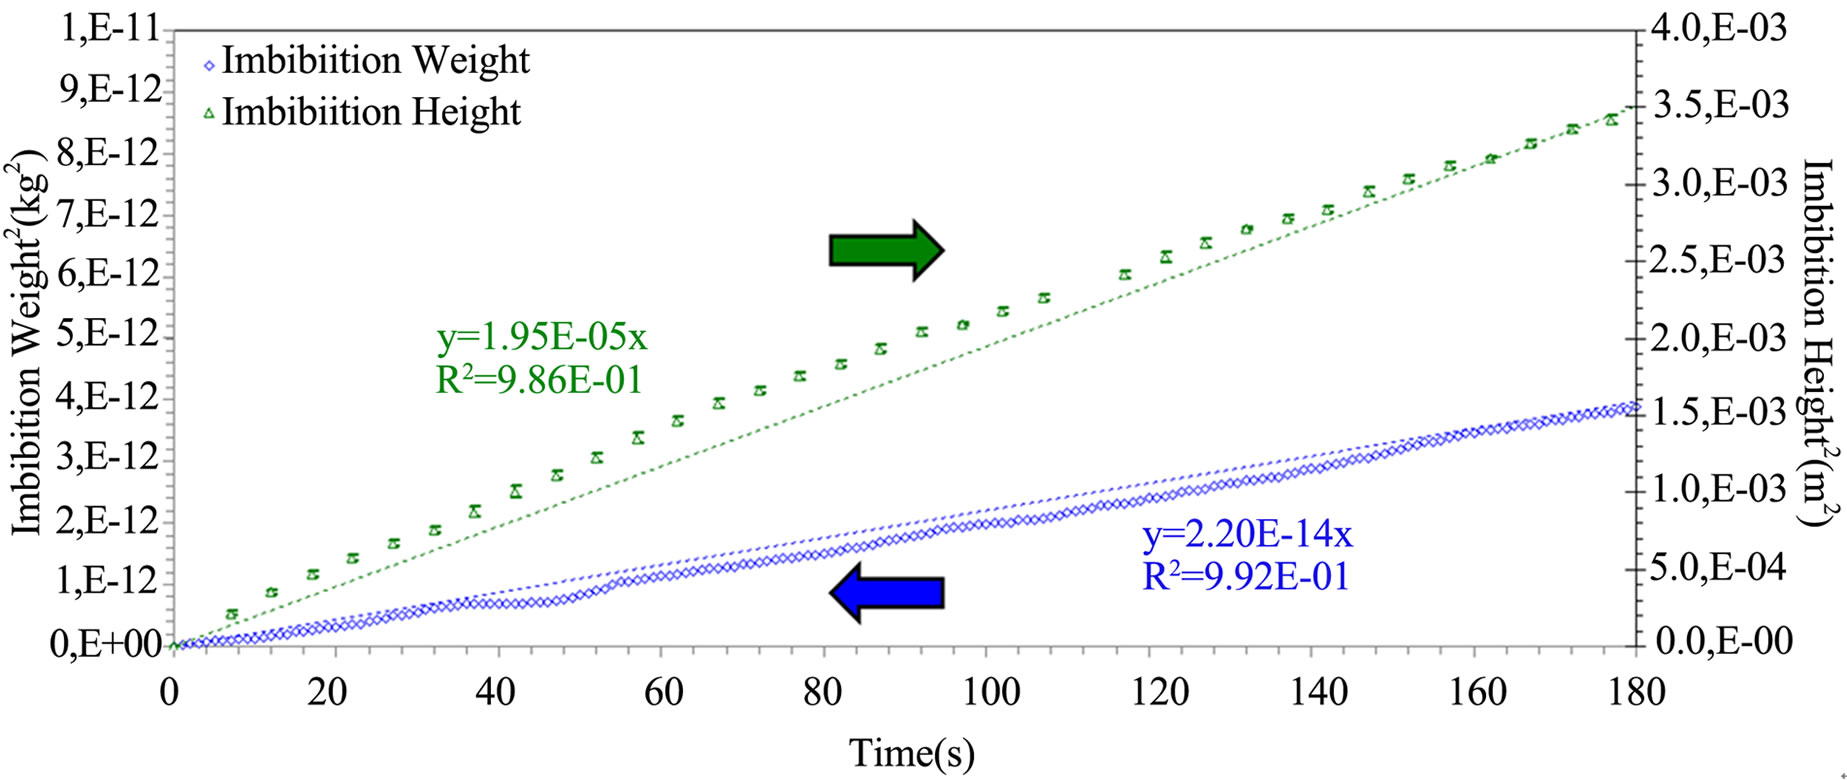
Figure 11. Lucas-Washburn fits on height and mass evolutions of hexadecane in weft fiber tows.
Two additional capillary rise tests were carried out on fiber tows with sizing to check the measurement repeatability of the LW slopes along the warp and weft directions. The new LW slopes of the capillary height evolution for warp and weft tows were found to be (2.21 ± 0.04) × 10–5 m2/s and (1.9 ± 0.1) × 10–5 m2/s respectively, which is very close than the previous result. Moreover, the new LW slopes of uptake fluid mass evolution for the warp and weft tows were respectively (24.6 ± 0.1) × 10–14 kg2/s and (2.22 ± 0.04) × 10–14 kg2/s. Based on the final uptake fluid mass after imbibition, the microscopic porosity of the warp and weft tows was found to be 44% ± 1% and 48% ± 1% respectively.
This second set of experimental values overlaps the first set of experimental microscopic porosity and LW slopes Bh and Bm reported in Table 5. Thus, a good repeatability of the experimental LW slopes was obtained, which confirms the robustness of the fluorescence approach to characterize wicking flows in fiber tows by capillary rise experiments. Note that a repeatability error below 5% on tow wicking rates was reported by Scher in a previous investigation [19].
The warp and weft tows exhibit values similar to the theoretical capillary pressure as computed by Equation (53). Indeed, their respective values were 9.7 kPa and 9.5 kPa, and thus overlap. The same kind of result is observed for Jurin heights (11) in the warp and weft tows that are respectively 1.28 m and 1.26 m. These results confirm the conclusion of the previous section showing a similar wicking behavior along the warp and weft tows.
Finally, the Jurin heights computed in Table 5 confirm a consequence of Lucas-Washburn law (24), which states that imbibition heights are much lower than equilibrium heights.
By assuming the tortuosity of the fiber tows in both directions to be equal to unity, the warp to weft anisotropy ratio  of microscopic pore area Amf can be computed from Equation (44) as follows:
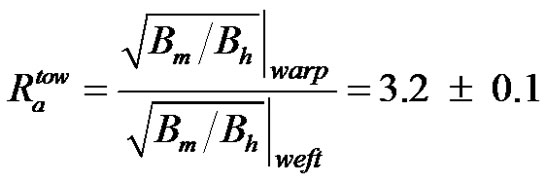 (57)
(57)
The warp to weft ratio of the microscopic pore area is consistent with the value of (3.0 ± 0.9) obtained from image analysis (previously presented in Table 1) and (2.9 ± 0.3) derived from the capillary rise experiments. In addition, Table 6 displays similarities between the axial permeability of the warp and weft tows with sizing evaluated by Equation (51) and the experimental Kozeny constants  introduced in Equation (52). Firstly, the experimental axial permeability of the warp and weft tows turned out to be about 1.7 darcy, namely 1.7 μm2. Then, considering a tow tortuosity equal to unity, the experimental constants
  overlap for the warp and weft tows. Indeed, the experimental values of
  for the warp and weft tows were about 2.1 and 2.3 respectively. Over the small range of porosity investigated, these values of
  can be considered as independent of the microscopic porosity. This is consistent with the literature on permeability characterization when polymer liquids are used as infiltration fluids [34]. However, experimental values of
  were slightly greater than the theoretical value of
  that was inferred as equal to 57/32 in the material characterization section (as a result of a quadratic packing of the tow filaments).
It is also interesting to point out in Table 6 that the experimental values of axial permeability are similar to the theoretical predictions of Blake-Kozeny-Carman Equation (45) using the filament diameter of Table 2 and the tow porosity of Table 5. Indeed, decoupling the capillary and viscous effects shows that the experimental and theoretical values generally overlap with a discrepancy lower than 15%. The experimental axial permeability of the warp and weft tows and Blake-Kozeny-Carman permeability predictions were respectively around 1.7 darcy and 2.0 darcy in both tow directions.
Firstly, this discrepancy of 15% between the experimental and analytical values of the axial tow permeability could be explained by a non uniform filament packing arising from the spinning/stitching fabrication process. Such a heterogeneous filament packing can generate a complex tridimensional capillary flow in fiber tows due to the interactions between the axial and perpendicular flows, resulting in a deviation from the hypothesis of perfect parallel flows. This hypothesis is used to evaluate the equilibrium capillary pressure in fiber tows by
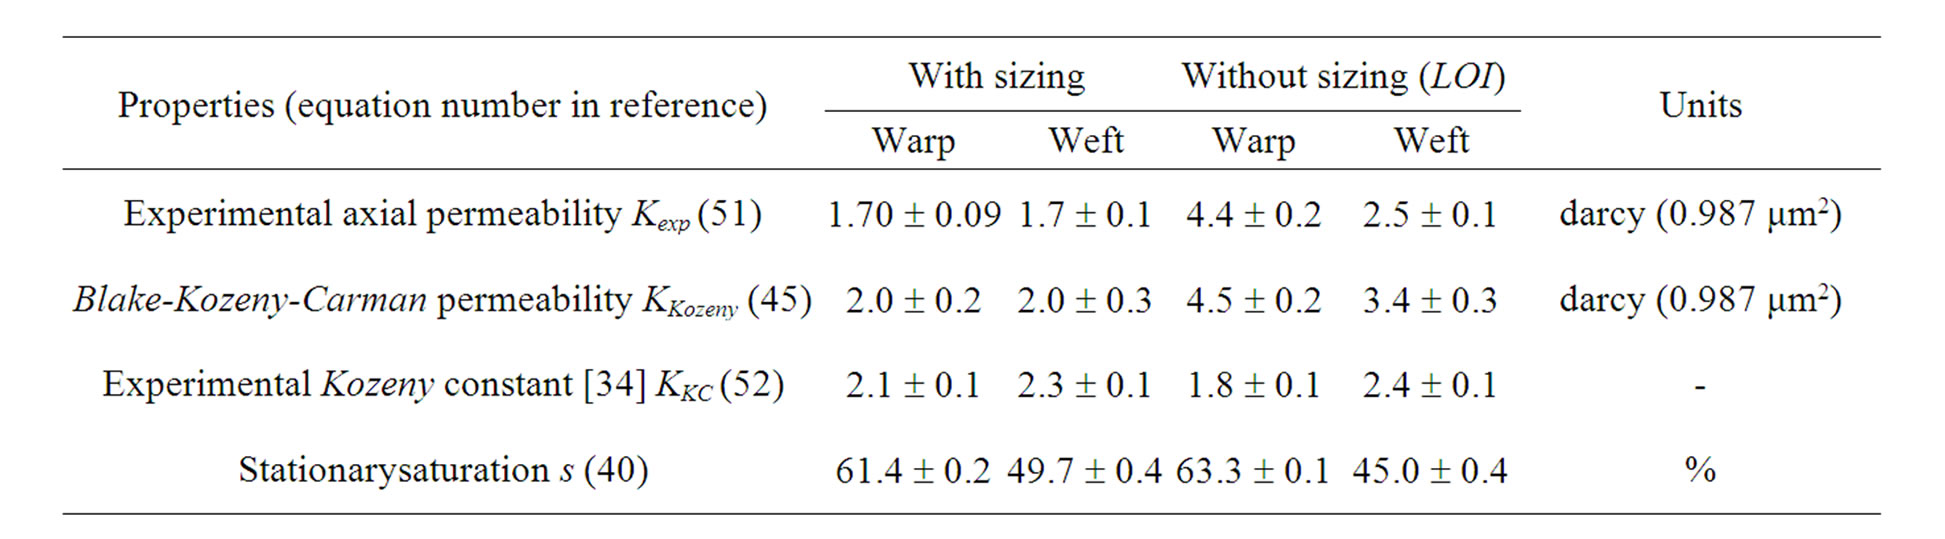
Table 6. Results derived from warp and weft imbibition tests with hexadecane.
Young-Laplace’s Equation (53) in conjunction with the tow specific surface areas per unit pore volume. On the other hand, the discrepancy between the experimental and analytical values of axial tow permeability can also arise from underestimating the fiber tow tortuosity. Indeed, the fiber tow tortuosity was assumed here to be equal to unity because of the non crimp architecture of the current fabric. In this regard, the fiber tow tortuosity is difficult to characterize directly. Recent investigations reported promising ways to estimate the tow tortuosity from computational fluid dynamics, image analysis, nuclear magnetic resonance or other measurement techniques.
As presented in Figure 12, current global saturation levels in the warp and weft tows were evaluated by Equation (41) from the height and weight evolutions. Within short imbibition distances, the warp and weft tow saturations converge to quasistationary values of about 60% and 50% respectively. These observations seem to confirm, as assumed in Equation (26), the previous hypothesis of constant saturation flow for short imbibition distances. Indeed, from the tow properties of Table 2 and the results of tow imbibition experiments, warp and weft tow saturation levels of 62% ± 3% and 50% ± 4% respectively could be evaluated by Equation (40). These values are consistent with the evolution of saturation levels for hexadecane reported in Figure 12 and Table 6. Further study of saturation would require advanced digital camera and appropriate image analysis tools.
7.3. Wicking along Fiber Tows without Sizing
The capillary setup has also been used to investigate the impact of fiber coating on tow wicking. Sizing has been removed from the fiber tows by carbonization (LOI). For this purpose, the pyrolysis oven has been set to the sizing degradation temperature (see Table 1) during three hours. Afterwards, fiber tows have been put under vacuum at –85 kPa for 15 minutes to remove residual ashes, after which they were ready for imbibition tests. According to Figures 13 and 14, the height and weight wicking rates were higher for warp fiber tows without sizing than with sizing. The same behavior was observed for weft tows. The results summarized in Table 6 confirm that the removal of sizing increases the tow microscopic porosity, and thus their hydraulic diameter. The increase in hydraulic diameter for the warp and weft fiber tows was about 25%, which is consistent with previous studies from the literature [13]. Therefore, it is clear that fiber sizing hinders the wicking flow. This clogging effect has been previously observed by other researchers [13].
Thus the tow alteration was mainly architectural rather than chemical and could originate from a loss of tow integrity due to degradation of the film forming agent included in the sizing. Under the hypothesis of similar tow size and radial convergent sizing flows during the surface coating process, distances of sizing penetration from the tow exterior surface have been estimated to a few tens of microns, which is consistent with literature data [37,40] . Indeed, these estimations of sizing penetration distances in fiber tows are carried out by assuming that their cross-section area is not modified by LOI and by measuring variations in the tow microscopic porosity before and after LOI.
8. Conclusions
Despite microscopic variability in porosity of about 10%, different characterization methods of fiber tow microscopic porosity, tow cross-section area and equivalent hydraulic diameter based on microscopic image analysis, porosimetry by liquid expulsion and capillary rise monitoring gave consistent results. The same consistency in characterization results was confirmed for weft tows. Thus the anisotropy ratios of microscopic pores between the warp and weft tows obtained by image analysis and by the capillary rise technique were also similar. This exhaustive comparison of tow wicking characterization proves the reliability of the capillary rise method.
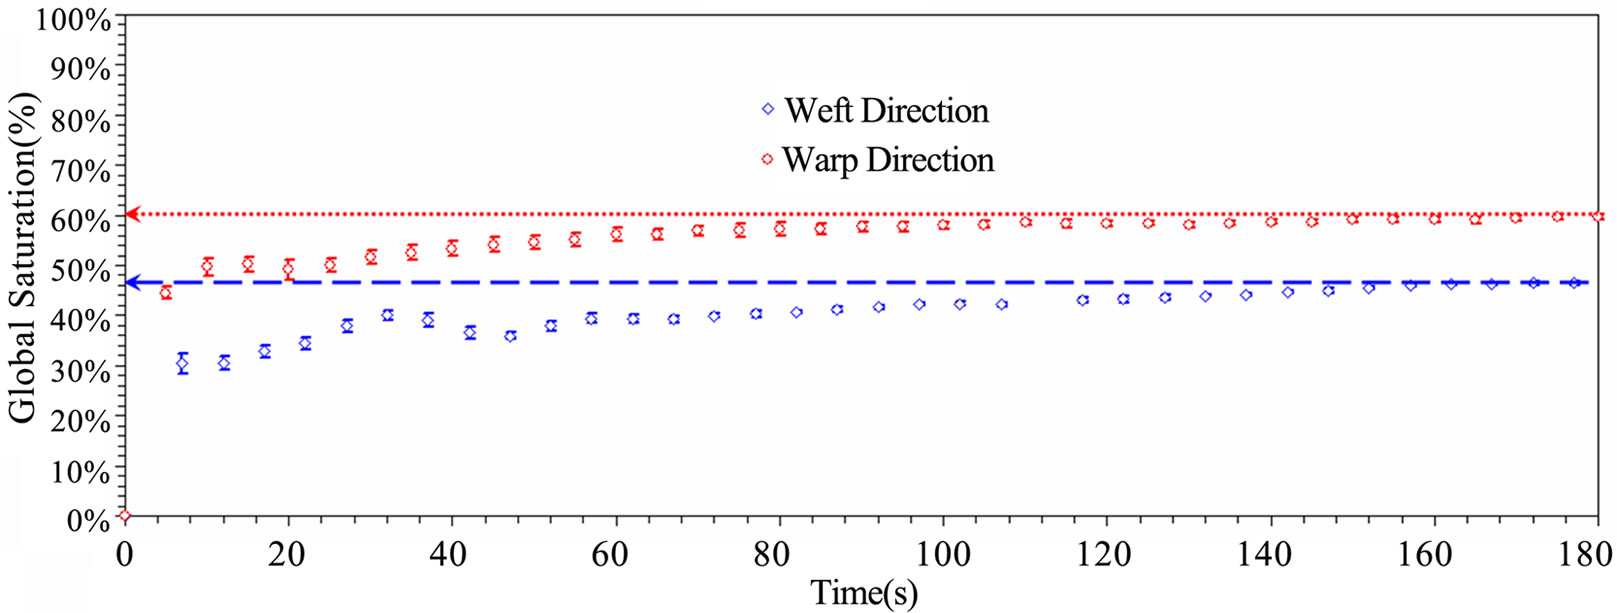
Figure 12. Global tow saturation evolutions in time with hexadecane along the warp and weft directions.
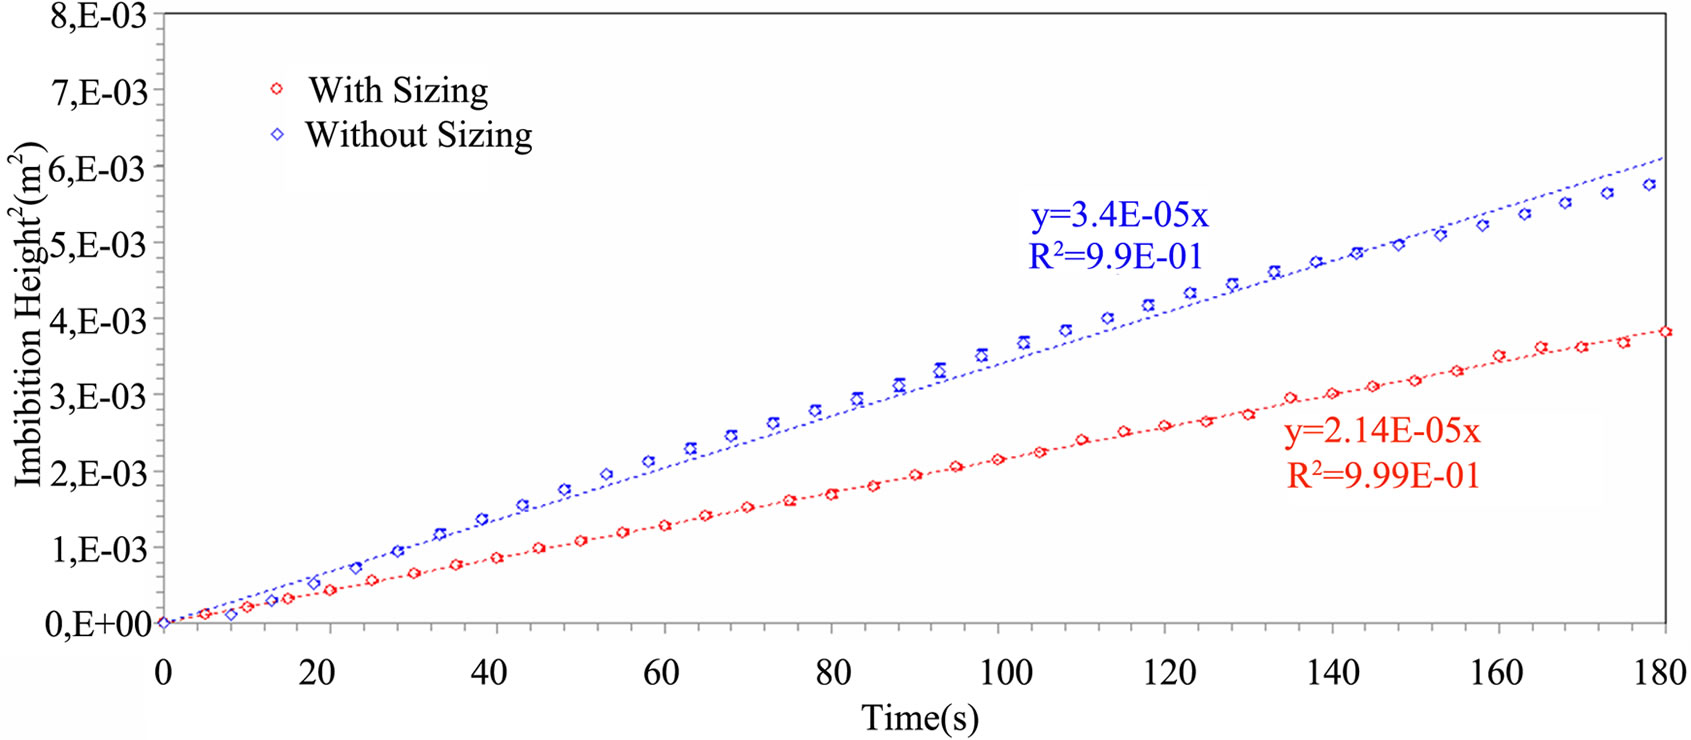
Figure 13. Comparison of square imbibition height evolutions in time for sized and unsized warp fiber tows with hexadecane.
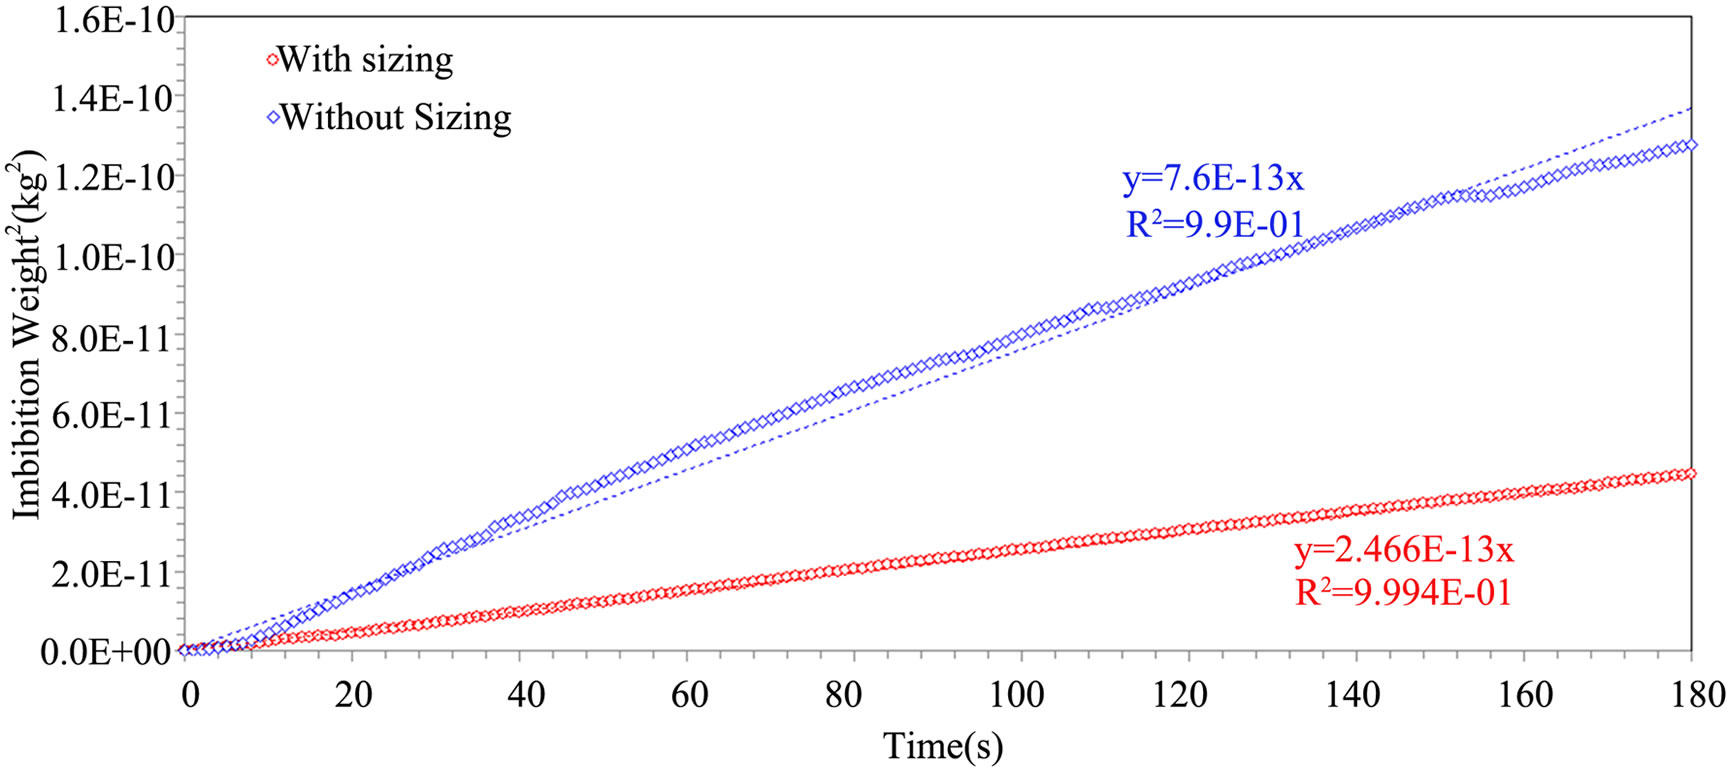
Figure 14. Comparison of square imbibition weight evolutions in time for sized and unsized warp fiber tows with hexadecane.
Furthermore, the experimental values of axial tow permeability obtained by the capillary rise method were consistent with predictions of Blake-Kozeny-Carman model and with the scientific literature. Experimental results from tow wicking characterization have also confirmed the capability of the proposed Lucas-Washburn model to predict tow imbibition rates from the properties of the fiber tows and of the infiltration fluid. Besides, the experiments have shown a similar wicking behavior in the warp and weft tows. Further imbibition analysis on the whole fibrous reinforcement should again confirm a similar in-plane wicking behavior along the warp and weft directions of the current fabric. Finally, the global flow obstruction effect of sizing during fiber bundle imbibition has been investigated. The experimental results obtained by the capillary rise technique, coupled with fluorescence visualization, have demonstrated the robustness of this characterization method for fiber tows capillary rise technique, coupled with fluorescence visualization, have demonstrated the robustness of this characterization method for fiber tows. The wicking behavior of the whole fibrous reinforcement can now be investigated with the same experimental approach for several ply configurations and compared to tow imbibition data. Of special interest in the future will be the wicking behavior of dual scale engineering fabrics.
9. Acknowledgements
The authors are grateful to the National Science and Engineering Research Council of Canada (NSERC) and the Canada Research Chair (CRC) for their financial support. The authors would also like to thank the Fonds Québé- cois de Recherche sur la Nature et al. Technologie (FQRNT), the Chair on Composites of High Performance (CCHP) of École Polytechnique de Montréal and the Center for applied research on polymer and composites (CREPEC) for providing the research infrastructure and equipment. They are also very grateful to JB Martin for donating the fiber reinforcement used in the experiments, the authors would also like to express their deep appreciation to Suzie Poulin, Yves Bédard, Régina Zamojska and Catherine Billotte for their support in the characterization work. Finally, the contributions of Christian-Charles Martel, Alex Bourgeois, Antonin Leclair-Maréchal, Michael Cantin, Nadir Nchit, Mickëal Leduc, Simon Dulong, Frédérick Marcil St-Onge, Fran-cisco Doyon, Matthieu Sola, Farida Bensadoun, Julian Gutierrez, Philippe Causse and Vincent Achim are also gratefully acknowledged.
REFERENCES
- F. Trochu, et al., “Advanced Numerical Simulation of Liquid Composite Molding for Process Analysis and Optimization,” Composites Part A: Applied Science and Manufacturing, Vol. 37, No. 6, 2006, pp. 890-902. doi:10.1016/j.compositesa.2005.06.003
- J. García, et al., “An Efficient Solver of the Saturation Equation in Liquid Composite Molding Processes,” International Journal of Material Forming, Vol. 3, Supp. 2, 2010, pp. 1295-1302. doi:10.1007/s12289-010-0681-8
- J. Leclerc, “Amélioration du procédé RTM par l’optimisation des paramètres d’injection,” Master Thesis, Ecole Polytechnique, Montreal, 2008.
- J. S. Leclerc and E. Ruiz, “Porosity Reduction Using Optimized Flow Velocity in Resin Transfer Molding,” Composites Part A: Applied Science and Manufacturing, Vol. 39, No. 12, 2008, pp. 1859-1868. doi:10.1016/j.compositesa.2008.09.008
- S. R. Ghiorse, “Effect of Void Content on the MechanicalProperties of Carbon Epoxy Laminates,” SAMPE Quarterly, Vol. 24, No. 2, 1993, pp. 54-59.
- N. C. W. Judd and W. W. Wright, “Voids and Their Effects on the Mechanical Properties of Composites—An Appraisal,” SAMPE Journal, Vol. 14, No. 1, 1978, pp. 10-14.
- J. Lambert, et al., “3D Damage Characterisation and the Role of Voids in the Fatigue of Wind Turbine Blade Materials,” Composites Science and Technology, Vol. 72, No. 2, 2012, pp. 337-343. doi:10.1016/j.compscitech.2011.11.023
- M. Haider, p. Hubert and L. Lessard, “An Experimental Investigation of Class a Surface Finish of Composites Made by the Resin Transfer Molding Process,” Composites Science and Technology, Vol. 67, No. 15-16, 2007, pp. 3176-3186. doi:10.1016/j.compscitech.2007.04.010
- E. Ruiz, et al., “Optimization of Injection Flow Rate to Minimize Micro/Macro-Voids Formation in Resin Transfer Molded Composites,” Composites Science and Technology, Vol. 66, No. 3-4, 2006,, pp. 475-486. doi:10.1016/j.compscitech.2005.06.013
- V. Achim and E. Ruiz, “Guiding Selection for Reduced Process Development Time in RTM,” International Journal of Material Forming, Vol. 24, 2010, pp. 1277-1286. doi:10.1007/s12289-009-0630-6
- G. L. Batch, Y. T. Chen and C. W. Macosko, “Capillary Impregnation of Aligned Fibrous Beds: Experiments and Model,” Journal of Reinforced Plastics and Composites, Vol. 15, No. 10, 1996, pp. 1027-1050. doi:10.1177/073168449601501004
- S. C. Amico and C. Lekakou, “Axial Impregnation of a Fiber Bundle. Part 1: Capillary Experiments,” Polymer Composites, Vol. 23, No. 2, 2002, pp. 249-263. doi:10.1002/pc.10429
- J.-M. Sénécot, “Étude de L’Imprégnation Capillaire de Tissus de Verre,” Ph.D. Thesis, Université de Haute Alsace, Montréal, 2002.
- S. C. Amico and C. Lekakou, “Axial Impregnation of a Fiber Bundle. Part 2: Theoretical Analysis,” Polymer Composites, Vol. 23, No. 2, 2002, pp. 264-273. doi:10.1002/pc.10430
- Y.-L. Hsieh and B. Yu, “Liquid Wetting, Transport, and Retention Properties of Fibrous Assemblies Part I: Water Wetting Properties of Woven Fabrics and Their Constituent Single Fibers,” Textile Research Journal, Vol. 62, No. 11, 1992, pp. 677-685.
- E. Bayramli and R. L. Powell, “Experimental Investigation of the Axial Impregnation of Oriented Fiber-Bundles by Capillary Forces,” Colloids and Surfaces, Vol. 56, 1991, pp. 83-100. doi:10.1016/0166-6622(91)80115-5
- S. C. Amico, “Permeability and Capillary Pressure in the Infiltration of Fibrous Porous Media in Resin Transfer Moulding,” Ph.D. Thesis, University of Surrey, Guildford, 2000.
- S. Chwastiak, “Wetting of Carbon Yarns from Wicking Rate Measurements,” Journal of Colloid and Interface Science, Vol. 31, No. 1, 1971, pp. 437-442. doi:10.1016/0021-9797(73)90293-2
- K. E. Scher, “Comparison of Wicking and Single Filament Techniques for Determining Contact Angles,” Master Thesis, University of Washington, Washington CD, 1983.
- K. M. Pillai and S. G. Advani, “Wicking across a FiberBank,” Journal of Colloid and Interface Science, Vol. 183, No. 1, 1996, pp. 100-110. doi:10.1006/jcis.1996.0522
- J. G. Williams, C. E. M. Morris and B. C. Ennis, “Liquid Flow through Aligned Fiber Beds,” Polymer Engineering and Science, Vol. 14, No. 6, 1974, pp. 413-419. doi:10.1002/pen.760140603
- M. Hamdaoui, F. Fayala and S. B. Nasrallah, “Dynamics of Capillary Rise in Yarns: Influence of Fiber and Liquid Characteristics,” Journal of Applied Polymer Science, Vol. 104, 2007, pp. 3050-3056.
- Y. K. Kamath, et al., “Wicking of Spin Finishes and Related Liquids into Continuous Filament Yarns,” Textile Research Journal, Vol. 64, No. 1, 1994, pp. 33-40. doi:10.1177/004051759406400104
- N. R. S. Hollies, M .M. Kaessinger and H. Bogaty, “Water Transport Mechanisms in Textile Materials1 Part I: The Role of Yarn Roughness in Capillary-Type Penetration,” Textile Research Journal, Vol. 26, No. 11, 1956, pp. 829-835. doi:10.1177/004051755602601102
- A. W. Adamson and A. P. Gast, “Physical Chemistry of Surfaces,” 6th edition, 1997, Wiley, New York.
- R. W. Johnson, “The Handbook of Fluid Dynamics,” CRC Press, Boca Raton, 1998.
- K. J. Ahn, J. C. Seferis and J. C. Berg, “Simultaneous Measurements of Permeability and Capillary-Pressure of Thermosetting Matrices in Woven Fabric Reinforcements,” Polymer Composites, Vol. 12, No. 3, 1991, pp. 146-152. doi:10.1002/pc.750120303
- N. R. S. Hollies, et al., “Water Transport Mechanisms in Textile Materials: Part II: Capillary-Type Penetration in Yarns and Fabrics,” Textile Research Journal, Vol. 27, No. 1, 1957, pp. 8-13. doi:10.1177/004051755702700102
- J. Bear, “Dynamics of Fluids in Porous Media,” American Elsevier, New York, 1972.
- S. Brunauer, P. H. Emmett and E. Teller, “Adsorption of gases in Multimolecular Layers,” Journal of the American Chemical Society, Vol. 60, No. 2, 1938, pp. 309-319. doi:10.1021/ja01269a023
- A. Siebold, et al., “Effect of Dynamic Contact Angle on Capillary Rise Phenomena,” Colloids and Surfaces A, Vol. 161, No. 1, 2000, pp. 81-87. doi:10.1016/S0927-7757(99)00327-1
- Washburn, E.W., “The Dynamics of Capillary Flow,” Physical Review, Vol. 18, No. 3, 1921, pp. 273-283. doi:10.1103/PhysRev.17.273
- J. Bico and D. Quere, “Precursors of Impregnation,” Europhysics Letters, Vol. 61, No. 3, 2003, pp. 348-353. doi:10.1209/epl/i2003-00196-9
- B. R. Gebart, “Permeability of Unidirectional Reinforcements for RTM,” Journal of Composite Materials, Vol. 26, No. 8, 1992, pp. 1100-1133. doi:10.1177/002199839202600802
- H. Yanazawa, K. Ohshika and T. Matsuzawa, “Precision Evaluation in Kr Adsorption for Small BET Surface Area Measurements of Less than 1 m2,” Adsorption, Vol. 6, 2000, pp. 73-77.
- M. J. Weber, “Handbook of Optical Materials,” CRC Press, Boca Raton, 2003.
- J. L. Thomason and L. J. Adzima, “Sizing up the Interphase: An Insider’s Guide to the Science of Sizing,” Composites Part A: Applied Science and Manufacturing, Vol. 32, No. 3-4, 2001, pp. 313-321. doi:10.1016/S1359-835X(00)00124-X
- S. H. Saidpour, “The Effect of Fibre/Matrix Interfacial Interactions on the Mechanical Properties of Unidirectional E-Glass Reinforced Vinyl Ester Composites,” Ph.D. Thesis, Loughborough University of Technology, Leicestershire, 1991.
- N. Otsu, “Threshold Selection Method from Gray-Level Histograms,” IEEE Transactions on Systems, Man and Cybernetics, Vol. 9, No. 1, 1979, pp. 62-66.
- V. Wolff, et al., “Determination of Surface Heterogeneity by Contact Angle Measurements on Glassfibres Coated with Different Sizings,” Journal of Materials Science, Vol. 34, No. 15, 1999, pp. 3821-3829. doi:10.1023/a:100460491722