Open Journal of Composite Materials
Vol. 3 No. 3 (2013) , Article ID: 34645 , 25 pages DOI:10.4236/ojcm.2013.33008
Continuous Damage Monitoring of a Thin Composite Structural with Mismatched Stiffener in a Combined Joint Using Fiber Bragg Grating under Tension and Three-Point Loading
![]()
1Department of Aerospace Engineering, Tokyo Metropolitan University, Tokyo, Japan; 2Composite Technology Centre, Japan Aerospace Exploration Agency, Tokyo, Japan.
Email: *trilaksono-agus@sd.tmu.ac.jp
Copyright © 2013 Agus Trilaksono et al. This is an open access article distributed under the Creative Commons Attribution License, which permits unrestricted use, distribution, and reproduction in any medium, provided the original work is properly cited.
Received May 8th, 2013; revised June 8th, 2013; accepted July 8th, 2013
Keywords: Carbon Fiber; Joints/Joining; Cohesive Elements; Secondary Bending Moment; Structural Health Monitoring
ABSTRACT
A joint combining riveting and bonding is considered in terms of structural performance if the composite structure has a mismatched stiffener. The transfer loading is correlated with high performance aerospace joints to increase delamination resistance in the out-of-plane direction. However, combined joints (rivet/bonded) will create a bearing area that induces another potential damage source aside from secondary bending moment on the edge of the stiffener. Another problem is that the structure is difficult to be inspected by using conventional methods because of limited accessibility. The use of embedded fiber Bragg grating (FBG) technology in the structure as a strain sensor can potentially solve the problem in structures that have a stiffness mismatch. The FBG can be used to detect and characterize delamination before it reaches a critical stage. The model used to represent this problem is a thin composite stiffened skin under two load cases: tension and three-point bending. Finite element modeling using a traction versus separation theory is performed to determine the critical area on the specimen for placement of the FBG before manufacturing and testing. Experiments were presented to determine the distribution of load in a combined joint under both loading cases using ideal loads to create a secondary bending moment and bearing loads in the stiffness-mismatched structure. In this research, the FBG successfully detected and characterized the delamination caused in both loading cases. In addition, FBG can predict the delamination growth quantitatively. A spectrum graph of the FBG results can be used to replace the conventional mechanical graph in composite structural health monitoring in real applications.
1. Introduction
The alignment of the load path and the geometry of the structural elements are important considerations in the design of joints. Aircraft structural elements are generally intended to be loaded in either tension/compression or shear modes. Primary bending is avoided by keeping the loading as close as possible to collinear. However, secondary bending induced by minor eccentricities of the loads occurs in many types of joints (and structures) and can cause serious problems. Because there is less available information on composite materials and structures than metal structures, especially with regard to failure mechanisms, structural aircraft designs that often incorporate over-strengthening, and the fear of failure that prompts too-frequent manual inspections of the structure. In the long run, these factors lead to inflated airline operating costs especially when compared to conventional aircraft design, which is based on metallic structures. In fact, composite materials and structures have complex failure mechanisms such as resin cracking, disjointing, delamination, fiber breakout, and these mechanisms can be difficult to detect and can lead to catastrophic failure [1-3].
Therefore, detecting and characterizing damage in the composite structure is important before it reaches a critical stage; the mismatch can then be stiffened to increase the safety and reliability of the structure. Structural health monitoring can offer a good solution to this problem and is performed by installing a fiber Bragg grating as a strain sensor during the manufacturing process. This component monitors structural degradation due to external forces or environment/temperature. One of the problems in implementing FBGs in the composite structure is that it is difficult to guarantee that a failure in the composite structure will occur close enough to an FBG location to allow for strain transfer and, thus, detection and interpretation. The focus of this study is to discuss a numerical approach to define FBG placement before fabriccation of a specimen model. The experimental model verifies the numerical results of FBG reflection-wavelength measurements for automatic damage detection during specimen testing in a thin composite structure containing a mismatched stiffness in a combined joint. The main concept of FBG implementation in a composite structure mimics human neural networks as shown in Figure 1 [4-9].
The Bragg, or reflected, wavelength (lB) is defined by the Fresnel reflection according to the following relationships (illustrated in Figure 2):
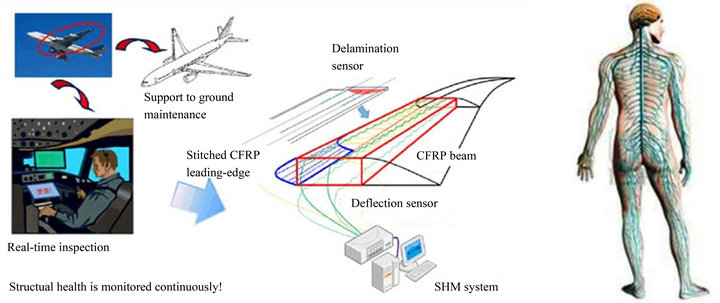
Figure 1. Human neural network concept in structural health monitoring of aircraft structure.
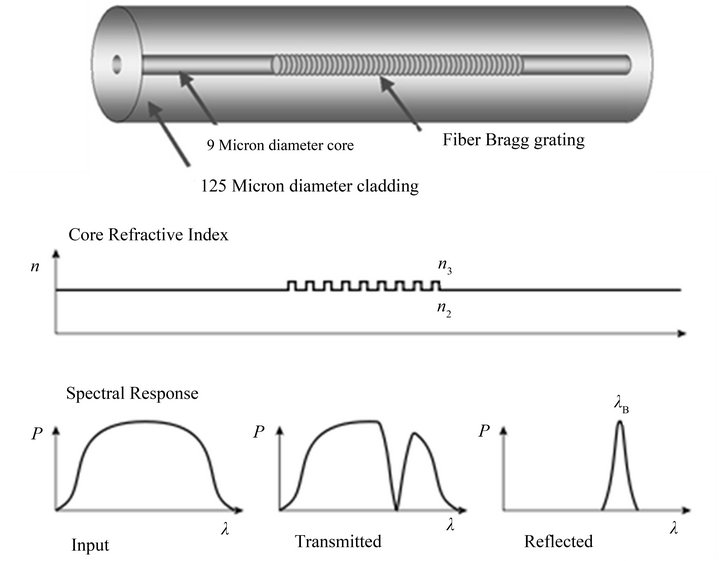
Figure 2. Fiber Bragg grating optics and illustration of the principle.
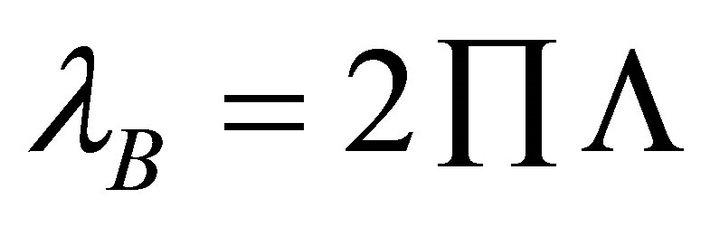 (1)
(1)
 (2)
(2)
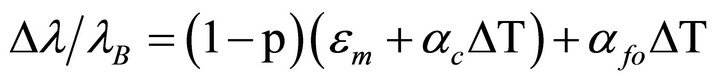
where P is the effective refractive index of the grating in the fiber core and  is the grating period. Also,
 = wavelength shift
 = base wavelength at test start p = photoelastic coefficient (p = 0.22)
 = mechanical strain
ΔT = temperature change in K
 = coefficient of thermal expansion of the composite
 = coefficient of thermal expansion of the fiber optic The proposal in this study is to automatically and continuously detect and characterize damage by using FBG in the thin structure where stiffness mismatch can occur as a simplification of composite skin stringers or composite joining, which can be misaligned with the neutral axis of the structure position. This automated detection and monitoring damage offers improvements in the safety and reliability of the aircraft structure. The study is organized as follows: Section 2 presents the design concepts in general. Section 3 presents the methodology of the numerical approach. Section 4 presents the experimental approach for a static case. Section 5 presents a perspective on the FBG strain sensor as a damage detection and monitoring device. Section 6 presents the discussion and conclusion.
2. General Design Concepts
Aircraft structures consist essentially of an assembly of simple elements connected to form a load transmission path. The elements, which include skins, stiffeners, frames, and spars, form the major components, such as wings, the fuselage, and the empennage. The connections or joints are potentially the weakest points in the airframe, and they determine its structural efficiency. Generally, it is desirable to reduce the number and complexity of joints to minimize weight and cost. A very important advantage of composite construction is the ability to form unitized components, which minimizes the number of joints required. However, the design and manufacture of the remaining joints are still major challenges to produce safe, cost-effective, and efficient structures. One of the important structures in aircraft is the skin stringer.
Although it is an important structure and provides many advantages in lightweight structures, such as providing end restraint for the skin panels and resisting outof-plane deflections when skins try to buckle, the concept of fully composite skin stringers poses a problem. These parts suffer the emergence of a secondary bending phenomenon that creates a peel failure on the interface between the skin and the stringers. Only a small force is needed to start a peel failure because the load is transferred from one skin panel to the next via the joints. The load is not collinear through the joint, but it is instead offset or eccentric. The secondary bending is highly dependent on the magnitude of the eccentricity.
In this section, we aim to produce a simplified model as shown in Figure 3 to perform fundamental tests on failures caused by secondary bending moments and to monitor them using the FBG strain sensor. The specimen, which is referred to as a thin composite stiffened skin, was made with double-stage adhesive curing; after the adhesive had cured, rivets were installed onto the stiffened area. In fastener (rivet) joints, loads are transferred between the joint elements largely by compression on the internal faces of the fastener holes, and there is a smaller shear component on the outer faces of the elements due to friction. In bonded joints, the loads are transferred mainly by shear on the surfaces of the elements. In combined joint cases, the load transmission elements (fastened or bonded) are stressed primarily by shear along the joint line; however, the actual stress distribution will be complex; combining this construction with the FBG as a strain sensor, our numerical approach and experiments will explain the complexity in detail.
Generally, a joint bonded with a structural adhesive is usually much stiffer than a similar joint joined by mechanical fastening even when the mechanical joint is optimally designed and interference fit fasteners are used. Thus, it is not possible to design a joint in which the load
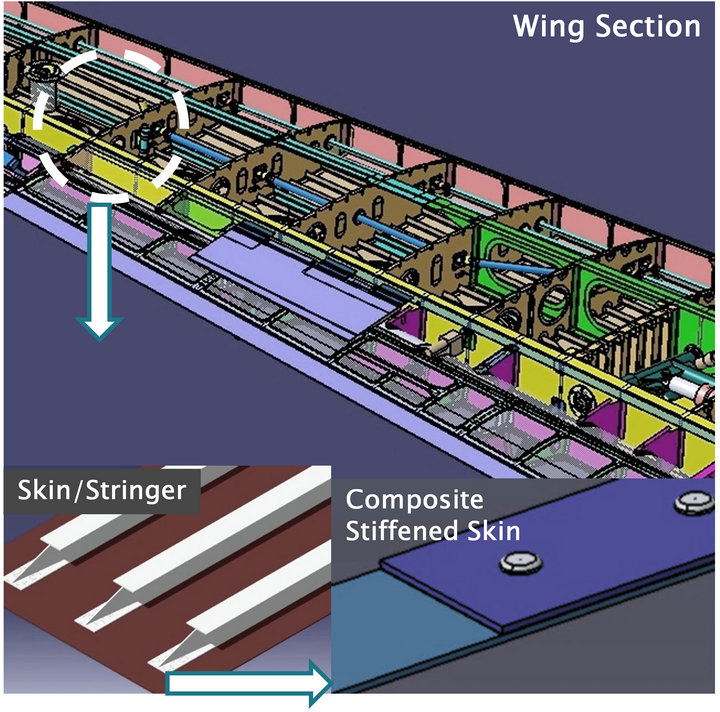
Figure 3. Specimen for fundamental testing (composite stiffened skin) inspired by a skin stringer structure.
is effectively shared between the bonded and fastened regions. However, using both fastening and bonding together can be beneficial for several reasons. Fasteners provide an alternate in-plane load path and throughthickness reinforcement, and they can be used at the end of a lap joint to reduce peel stresses (this is a somewhat hazardous application because the fastener holes, unless very carefully sealed, allow environmental ingress into the bond interface in the most critical region). Fasteners can also be used both as a jigging aid and to apply pressure during adhesive bonding of composite components. Bonding can be used to alleviate local stresses in the metallic component in a mechanically fastened joint, which improves fatigue and static strength properties. A combined approach is used extensively with riveting in the metallic longitudinal fuselage splice region in commercial aircraft. With composite construction, this approach is more likely to be used for rework in areas found to be prone to damage.
Material and Specimen Preparation
Carbon fiber unidirectional impregnated IMS60/#133 (Toho Tenax) was used for laminate. The composite was eight-layer anisotropic [0, 0, 45, −45]s, and it was fabriccated by autoclaving at ±180˚C to produce the following mechanical properties: σt = 2201 MPa, σc = 1037 MPa, τt= 207 MPa, Et = 150 GPa, Ec = 137 GPa, Gtc = 10.9 GPa, and νtc = 0.33. The material was cut with diamond cutting machines into the desired dimensions. One piece was cut as a skin and another as a stiffener as shown in Figure 4. The interface between the composite skin and the stiffener was bonded using the adhesive DP420 Off-White from 3M with a double-stage bonding method containing the following mechanical properties: τs = 20 MPa, τn = 17 MPa, τt = 207 MPa, and Et = 2000 Mpa. The bonding area was roughened with fine abrasive paper and cleaned with acetone before the bonding process. AN470 AD5 rivets with Φ 3.2 mm were installed into the specimen using a 0.30 MPa pressured rivet gun. The drilling process is shown in Figure 5. The FBG was embedded in the interface between the skin and the stiffener near the edge of the specimen because this area has the greatest potential for failure as shown in Figure 3. The FBG is made using Fujikura Optical Fiber with Ø 125 mm, and a grating span of 15 mm was used.
3. Methodology of the Numerical Approach
The fates of the edges of the stiffener, the adhesive, and the riveted joint were investigated. The joint configuretion used in the study was a combination riveted/bonded method for the composite stiffened skin. The rivet geometry was maintained as a constant throughout the
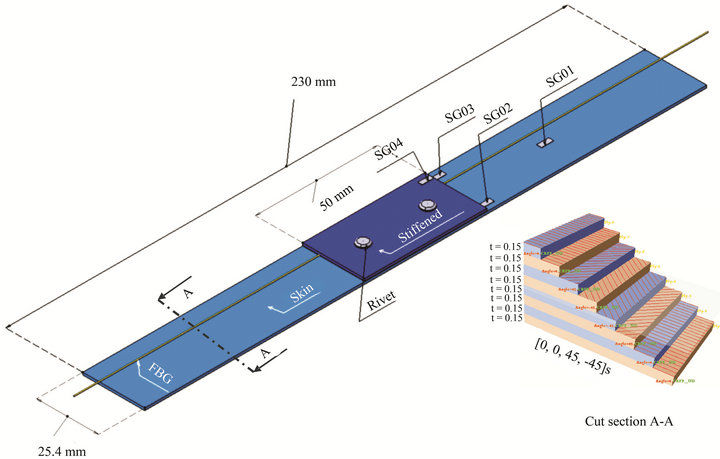
Figure 4. Specimen dimensions and configuration.
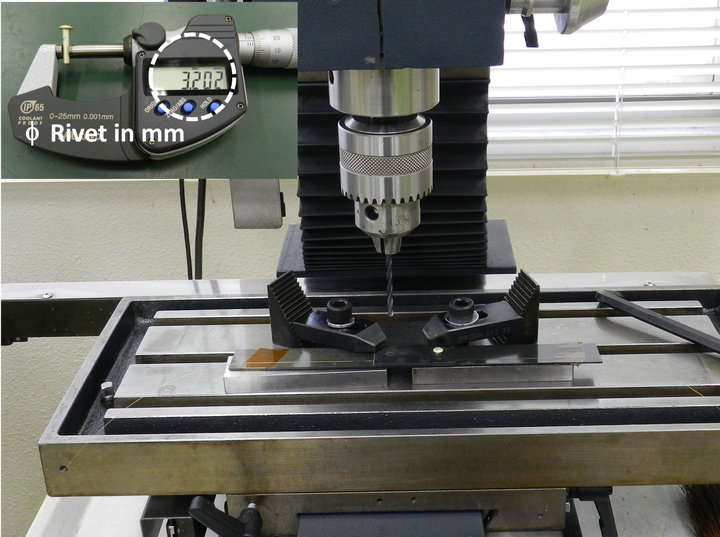
Figure 5. Drilling process and rivet installation.
analyses. In addition to predictions of the load transfer in the joint, a stress analysis was performed to investigate the peeling effect and to determine the shear stress distributions in the adhesive and the riveted joint. Adhesive debonding has different characteristics in asymmetric and symmetric configurations; the asymmetric configuration encounters bending stresses, which then lead to peeling stresses. To describe the adhesive cracks that cause delamination, cohesive elements are used, and this approach has risen in popularity over the years. This interest is principally due to the ease of implementation and the clear virtual picture that is given by an explicit representation of delamination. After the mechanical behavior is investigated, the specimen was fabricated and the FBG was installed in the specimen model. The experimental results were used to validate the predicted values from the finite element model [10-12].
3.1. FEM Analysis Parameters
The traction versus separation theory is a well-known theory used to model the onset of delamination in the combined joint of a thin composite stiffened skin. The quality of various modeling techniques for a thin composite stiffened skin must be weighed (information is available in Abaqus), and the results must be verified by correlation with experimental data.
3.2. Using Traction vs. Separation Laws
Delamination is one of the main modes of failure in composites when there is no reinforcement in the thickness direction. Prediction of delaminations can be performed using cohesive elements, which combine aspects of strength analysis to predict the onset of damage at the interface and fracture mechanics to predict the propagation of a delamination. Cohesive elements have been found useful to study fracture along the interfaces of contact materials that have the same stiffness or thickness.
A cohesive constitutive law correlates the traction s to the displacement d at the interface. The bilinear softening model, which is chosen here for its simplicity, is shown in Figure 6. One characteristic of all softening models is
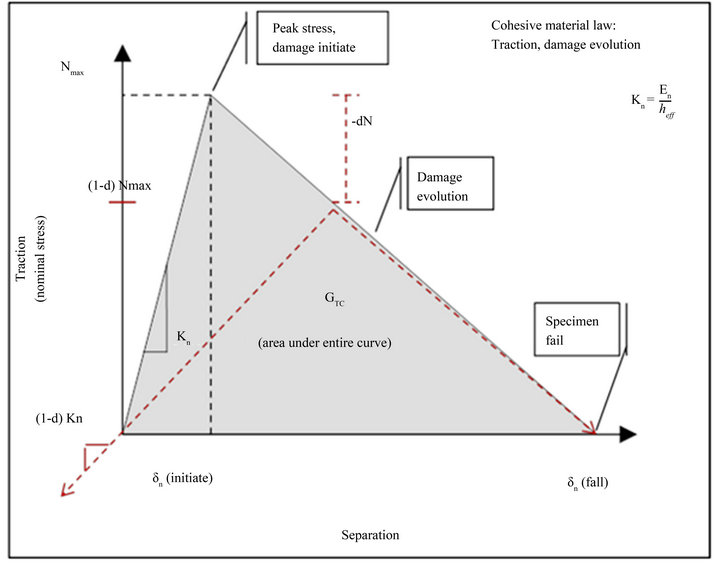
Figure 6. Onset of delamination based on the traction vs. separation theory.
that the cohesive zone can still transfer load after the onset of damage. For pure Mode I, II or III loading, the stiffnesses are gradually reduced to zero after the interfacial normal or shear tractions reach their particular interlaminar tensile or shear strengths. The areas under the traction-displacement curves are the respective modes (I, II or III) of the fracture energy [13-16].
The penalty stiffness K is an arbitrarily large number selected such that the presence of undamaged cohesive elements does not introduce substantial compliance to the structure. A cohesive law is assumed to have three fracture modes. It is assumed that direction 3 is normal to the interface and that the interlaminar shear strength dshear is independent of the shearing direction. Then, the displacements for damage initiation in each mode are simplified by the equations below:
Mode I: 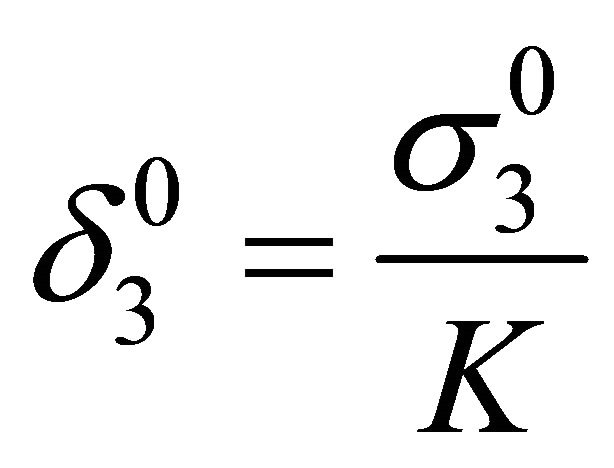
Mode II: 
Mode III: 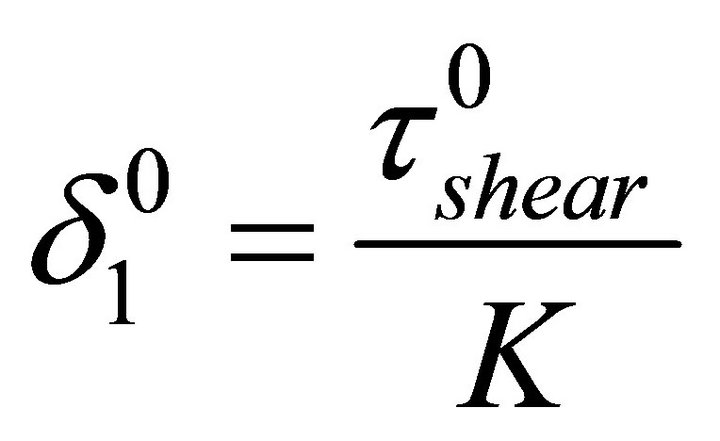
The constitutive response of traction vs. separation theory used here is based on the maximum stress criterion and is as follows:

The quadratic stress interaction criterion is
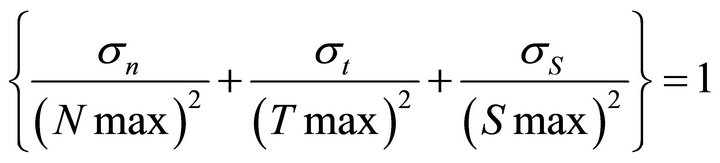
Note:
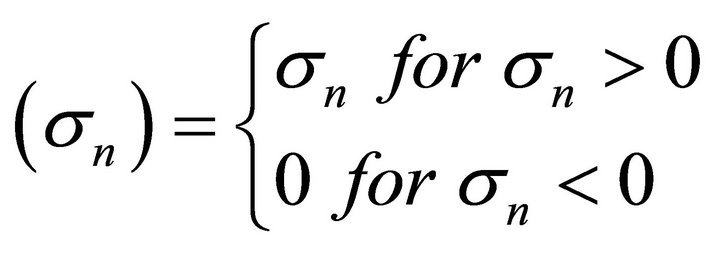
 = nominal stress in the normal direction
 = nominal stress in the first shear direction
 = nominal stress in the second direction d = scalar damage variable d = 0: no damage d = 1: fully damaged
3.3. Three-Dimensional Modeling with Finite Elements
The three-dimensional models were built using a partitioned solid model in the thickness direction with a pointed section as the shell-composite for the laminate, a cohesive element for the adhesive and solid-homogeneous element for the rivet. In the element modeling, the laminate (the skin/stiffener) was modeled using an 8- node quadrilateral in-plane continuum shell with hourglass control and with multiple elements in the thickness direction, which improved the performance of the elements under bending. The adhesive was modeled using 8- node three-dimensional cohesive elements. The rivet was modeled using an 8-node linear brick with hourglass control, which produced a more accurate representation of the curved surface. A medial axis transform was used to generate the mesh, and a neat fit was assumed between the rivet and the laminate in all of the simulations. Symmetry was adopted along the length of the joint, and the model was thus reduced to a half-model to reduce computational time. To accurately determine the mechanical behavior, including the load transfer at the interface of the adhesive and rivet, a three-dimensional model was required wherein the pair contact between the rivet and hole was modeled with a master-slave algorithm that allowed finite sliding of the contact pairing assuming a value of 0.2 for the friction coefficient; the adhesive interface was modeled as a cohesive element. To blur the dissimilar surface junction, the nodes used in interaction of the parts were merged, and all degrees of freedom at the node were merged together so that the meshing retains a good shape [17-19].
A finite element model of a composite stiffened skin with combined joint was developed using finite element code that is available in Abaqus. The analyses were performed by inducing a tensile load at one end of the joint, which was only free to move in the longitudinal (x) direction (uyuz = 0). The opposite end of the joint had clamped boundary conditions (uxuyuz = 0). Because it was fixed in the (z) direction, this model was represented as a half-model (uz = 0). In another test using three-point bending conditions, the piece is free to move (roll-support) in the longitudinal (x) and normal (z) directions (uy = 0) with loading on the center back side of the stiffener. The effects of non-linear geometry were included in the analyses.
Figures 7 and 8 show the differences in stress concentration at the interface between the stiffener and the skin when using cohesive elements under tensile and three-
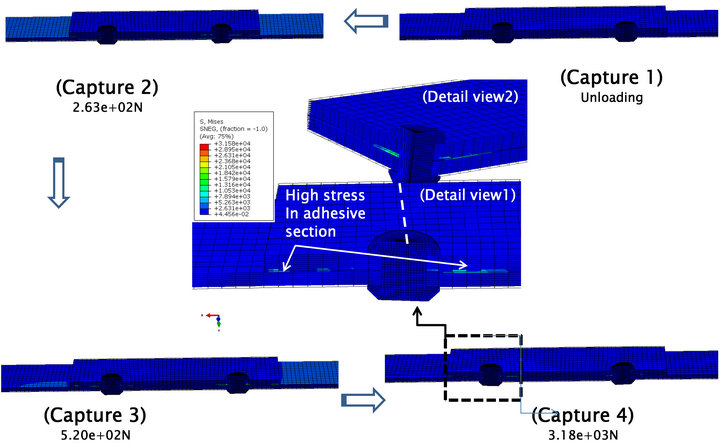
Figure 7. Onset of delamination based on traction vs. separation theory in a tensile test.
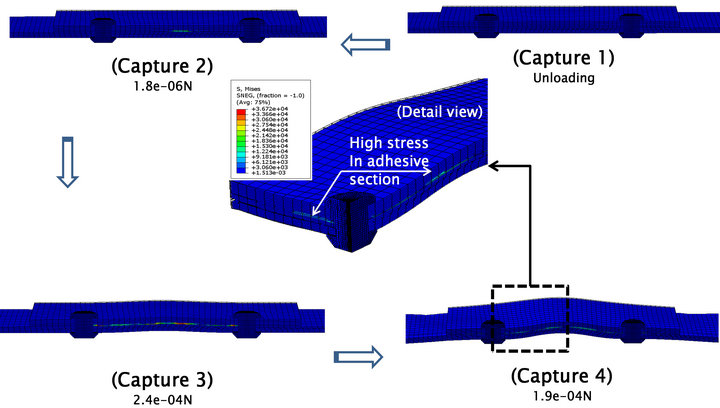
Figure 8. Onset of delamination based on traction vs. separation theory in three-point bending test.
point bending loads. Using this theory, it can be verified that the onset of delamination will occur at the edge of the stiffener and near the riveting hole under tensile loading. Under three-point bending, the load concentration appeared in the center of the specimen model and near the riveting hole. No out-of-plane behavior is seen in this virtual model because the element based on traction separation is a shell, and this type of structure cannot experience normal direction behavior except as shown by the vector stress response.
A comparison of the separation element and the stress distribution at the combined joint in the thin composite stiffened skin under tension and under three point loading is shown here in several figures. The specimen model under tension loading is shown in Figures 9 and 10. We can see that separation initially occurs at the edge of the stiffener as a result of the peeling stress created by the secondary bending moment. This effect occurs because of the stress concentration at the edge region of the stiffener due to a stiffness mismatch; the neutral-axis load was changed, and the load was shifted nearer to the hole rivet area when the load increased. The peel stress caused by the mismatched stiffness and load-shift can also be shown in that virtual figure by the maximum principle stress vector in the normal direction, which produces a secondary bending moment and creates the potential of a peeling failure.
In the combined joint under three-point loading, shown in Figures 11 and 12, a different separation pattern appears where the stress distribution response is opposite from that under tension loading. This pattern shows a significant stress concentration in the middle of the specimen that is load shifted to near the hole rivet area, and loading is increased. Indications are that the addition of the rivet in this case provides a multi-area stress concentration effect. The stress concentration becomes very critical especially in the transverse direction due to the fairly large separation in the area of the rivet. Both loading scenarios have principle differences regarding the stress distribution; however, the shear load is dominant in both specimen models while secondary bending occurs from the edge stiffness. This outcome will influence the FBG spectrum perspective behavior, which is explained in the next chapter. However, this shearing load response is less critical in the delamination process compared with the normal direction load response.
Figure 13 shows the stress distribution profile in the longitudinal direction under tension loading. This profile is consistent with the previous figure in that multiple areas of peeling stress concentrate on the edges of the stiffener and the rivet holes as local stress concentrations dominate. However, in the case of three-point loading as shown in Figure 14, no peeling stress concentration occurs at the edge of the stiffener as a result of the mismatched stiffness in the area. The stress is eliminated
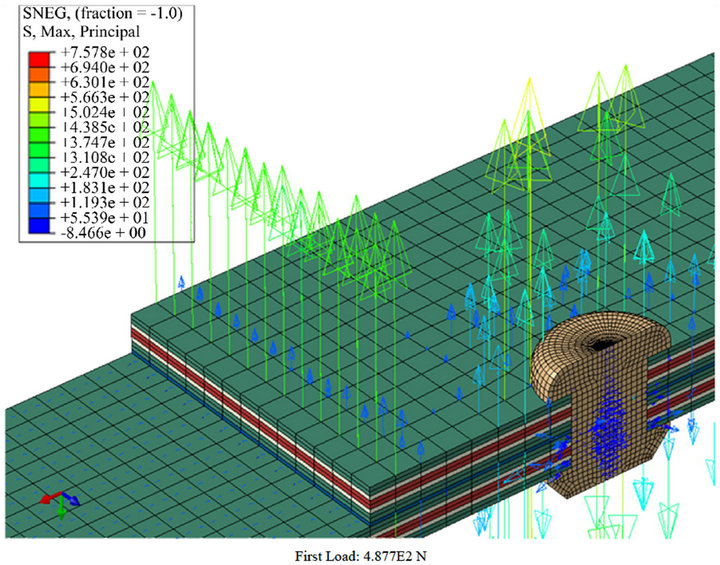
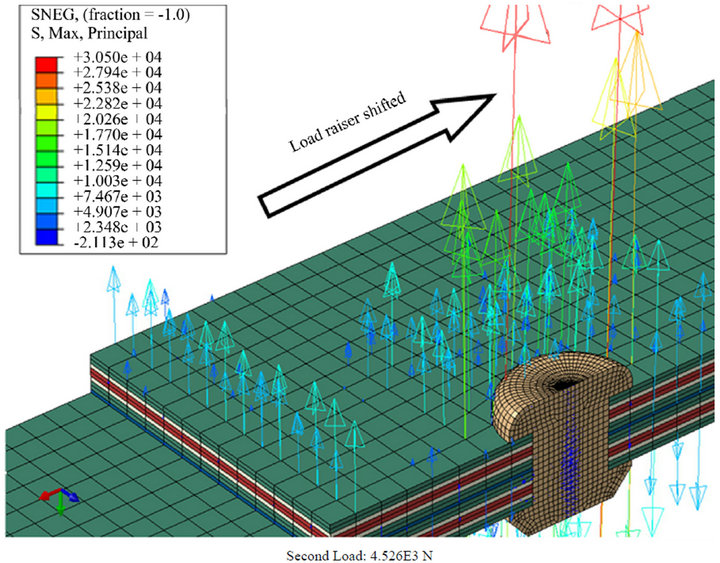
Figure 9. Distribution of principle stress maxima and vector direction sunder tensile loading.
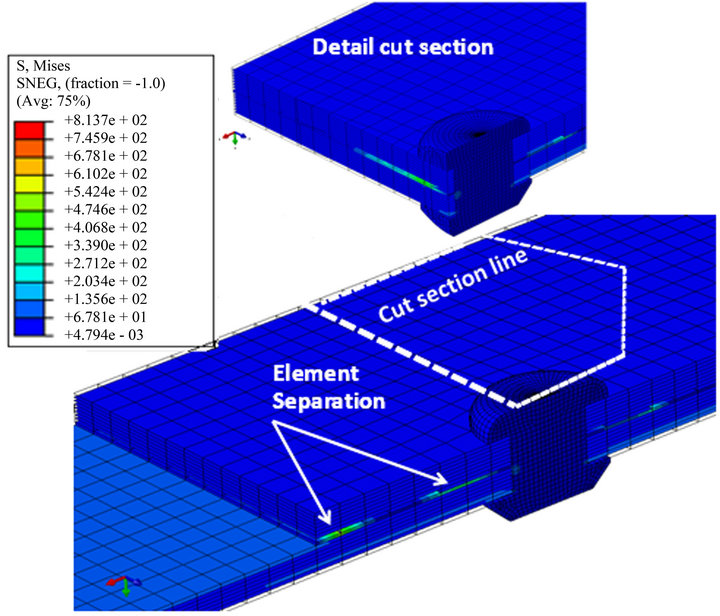
Figure 10. Separation element location during tensile loading for riveted bonding stiffened skin.
because the rivet increased the resistance to out-of-plane failure at the edge although it also increased the risk of bearing failure due to the hole. The addition of the rivet indicated that the stress distribution can shift in the middle of the specimen as shown in the case of three-point loading.
Figures 15 and 16 show the stress distribution profile in the transverse direction. A comparison between the test scenarios under different loads indicates that both have nearly the same stress distribution profile in the transverse direction, which has no multi-area stress concentration caused by the addition of the rivet. The stress concentration occurs only around the rivet hole for both test scenarios.
A comparison of the load transferred to the rivet area for the two test scenarios is illustrated in Figures 17 and 18. Under tension loading, nearly all the load is transferred to the rivet area. As a consequence, nearly no load is transferred to the stiffener in this case, and the load nearly entirely accumulated in the hole rivet area. It could be said that the addition of the rivet increased the risk of bearing failure. The situation is different in the test scenario under three-point loading in which it can be seen that the load is transferred partially to the rivet area. This means that the risk of bearing failure is also minimized.
Now that FEM studies have verified the mechanical behavior of the failure scenarios and the critical positions in which to place the FBG in the composite stiffened skin specimen, the specimen is ready to be built and tested using the Instron 8802 machines. The test will be conducted in two steps. First, the profile spectrum from zero loading until specimen breakage is determined to obtain the complete spectrum behavior based as a function of the FBG read-out. Then, an interrupted test is conducted to determine the loaded/unloaded spectrum and the growth of delamination. After the loaded/unloaded test, the specimen is evaluated using a C-scan machine to determine the shape of the delamination growth.
4. Experimental Approach in the Static Case Experimental Procedure
During the static test, the FBG optical fiber was lit using a broadband light source (ASE FL7002, 1530 - 1610 nm, FiberLabs) using a Fujikara arc splicer connected as shown in Figure 19. The power spectrum was measured from reflected light in the FBG sensor, which was embedded inside the skin stiffener. Losses after fiber optic

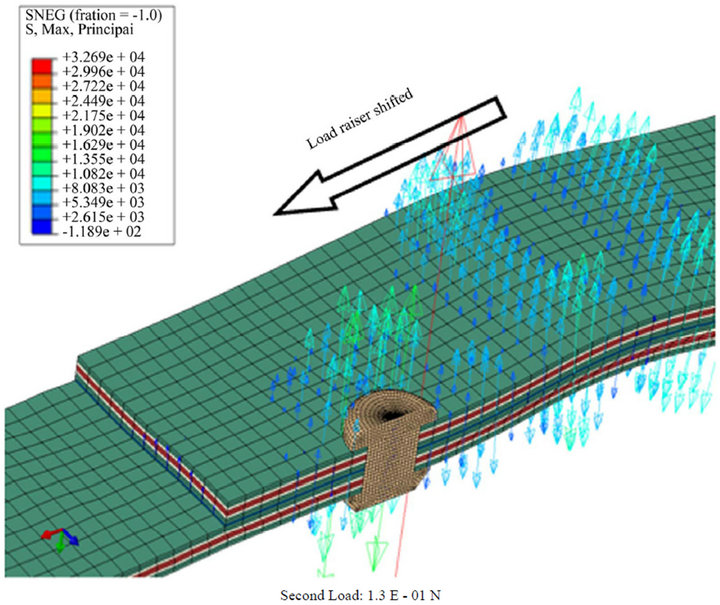
Figure 11. Distribution of principle stress maxima and vector direction under three-point loading.
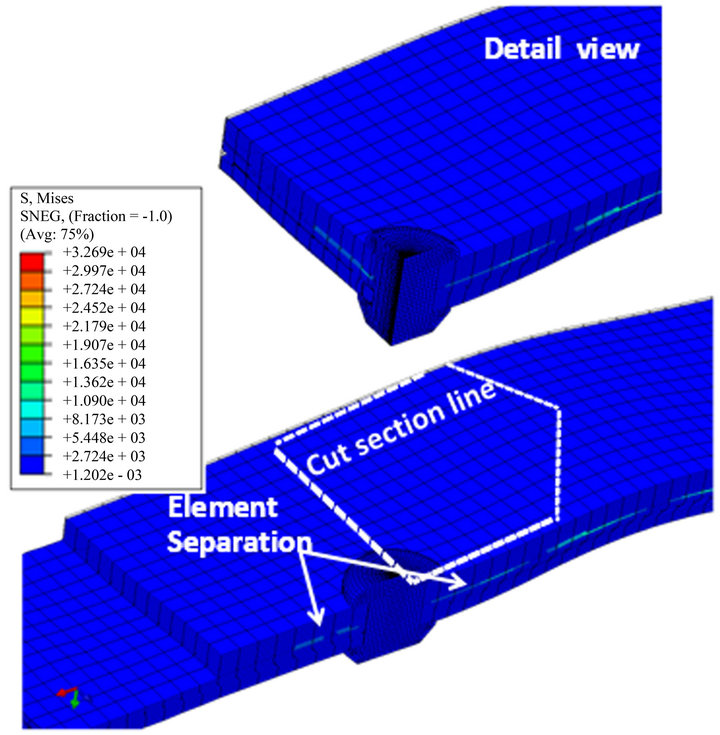
Figure 12. Separation element location during three-point loading for riveted bonding stiffened skin.
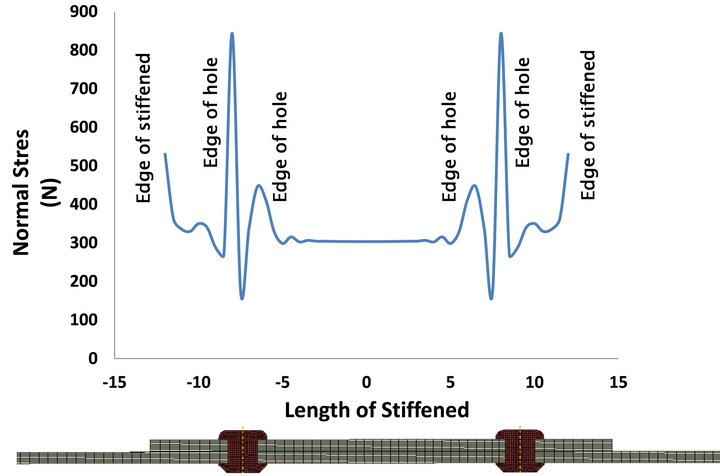
Figure 13. Stress distribution profile in the longitudinal direction for the test under tension loading.
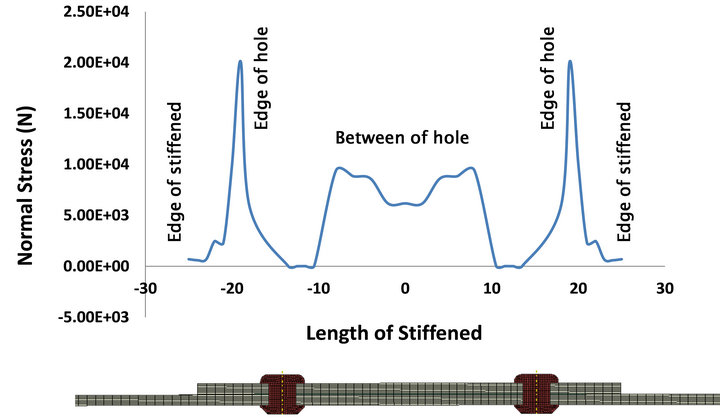
Figure 14. Stress distribution profile in the longitudinal direction for the test under three-point loading.
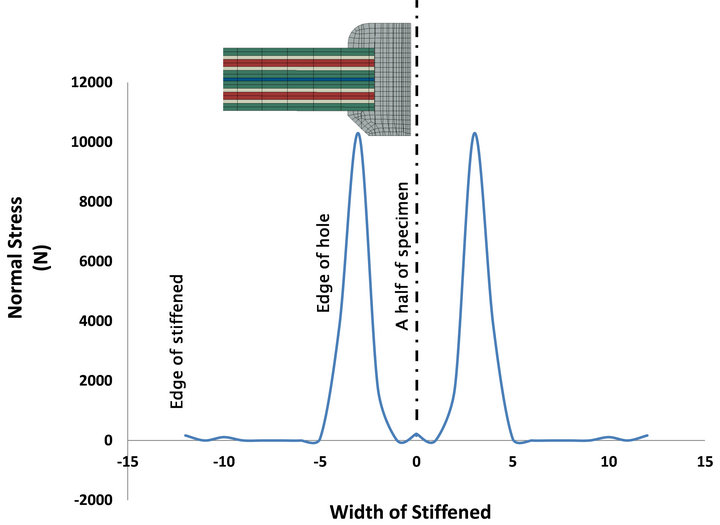
Figure 15. Stress distribution profile in the transverse direction for the test under tension loading.
joining were 0.00 dB, indicating a perfect joining result. The spectrum reflection was measured using an optical spectrum analyzer (MS9710C, Anritsu Co.).
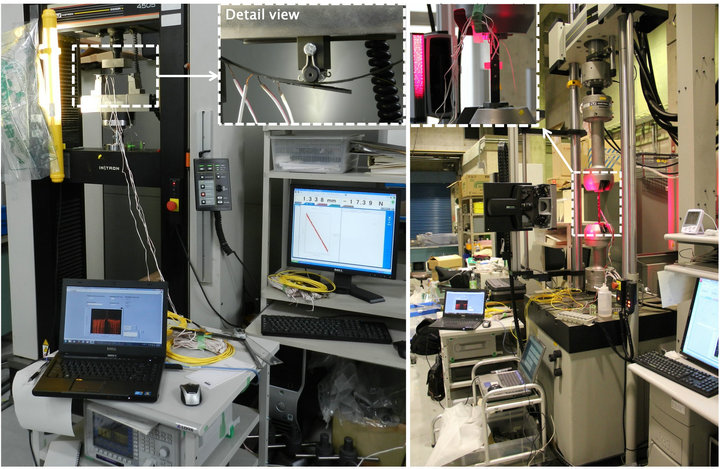
Figure 20 presents one of the two experimental arrangements. The tensile test was conducted using a universal testing machine (Instron 8802), and the three-point bending test was performed using an Instron 4505. The cross-head speed was 0.5 mm/min. The span length for the tensile test was 170 mm, and the span length for threepoint bending was 150 mm. A non-contact strain measurement, the advanced video extensometer (AVE), was used to monitor the axial strain behavior on the back side
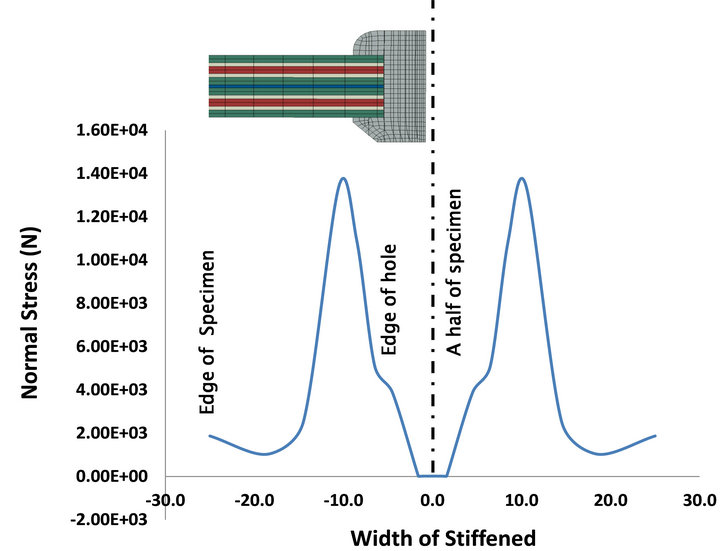
Figure 16. Stress distribution profile in the transverse direction for the test under three point loading.
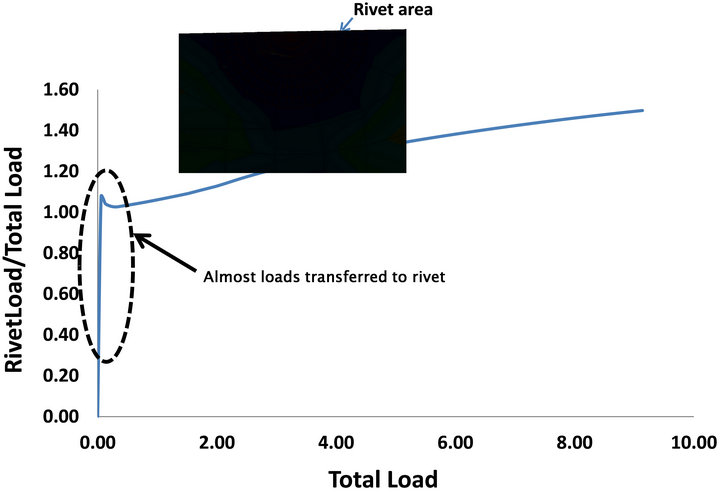
Figure 17. Normalized load transfer in the rivet area under tension loading.
of the stiffener to clarify how the secondary bending occurred under tension loading.
The spectrum reflection was continuously measured until the specimen broke. After that point, an interrupted test at a certain load interval was conducted to observe the damage growth under FBG interrogation under loaded and unloaded conditions. The specific load for the interrupted test was chosen based on the load-displacement curve and from changes in the spectrum reflection, which indicated that damage had begun. The loadingunloading condition was used to represent real conditions when damage occurs in aircraft structures. The evolution of the reflection spectrum’s shape was observed using a spectrum analyzer, and damage was observed using an
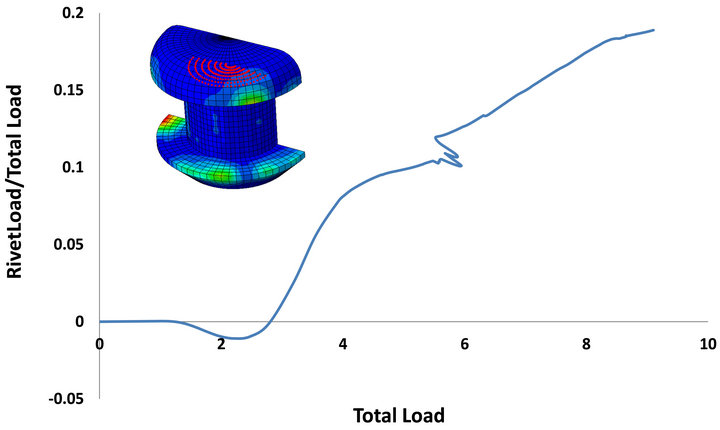
Figure 18. Normalized load transfer in the rivet area under three point loading.
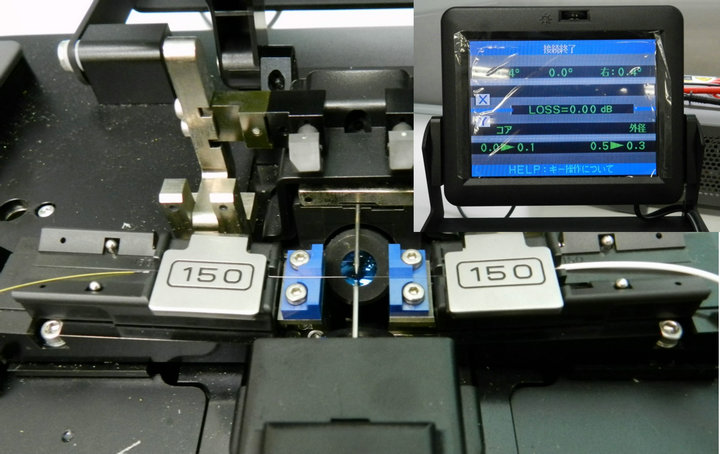
Figure 19. FBG connection setup and light bias test.
ultrasonic c-scan (Gsonic scan 6A × 600).
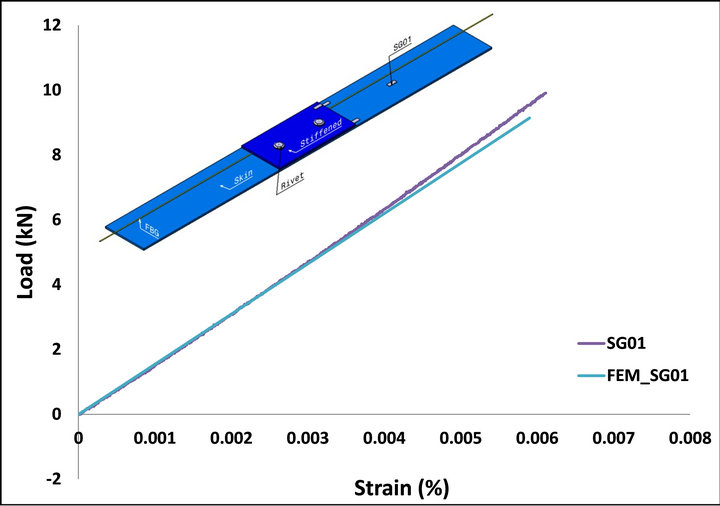
Figures 21(a)-(d) show the magnitude of the mechanical behavior from the finite element analysis compared with the strain gage measurements during the test. The mechanical behaviors at strain gage 1 (SG1) through strain gage 4 (SG4) have the same trend as the experimental results. This similarity means that there is close agreement in the mechanical behavior trend between the finite element analysis and the experiment.
The interrupt load test was performed to gather data for comparison with non-destructive inspections performed using a C-scan to determine the degree of delamination. The interrupt test was used to simulate real conditions in that the loading-unloading conditions rep-
 (a) (b)
Figure 20. (a) Three-point bending and (b) tensile test setups.
resent operating-grounded conditions. This type of test also determines the effects of changes in load distribution and stress concentration during loading. Figure 22 shows the C-can under interrupted tension loading. It is clear that delamination appears in two places as a result of the two areas of stress concentration; these areas begin in and around the rivet hole and then grow to the edge of the stiffener. The result is consistent with the stress distribution profile as shown in Figure 13. Only a small load is needed to initiate delamination because the high stress concentration occurs near the rivet hole area. Under three-point loading as shown in Figure 23, delamination occurs gradually and requires a high load to initiate and propagate. This difference is a result of the dominance of shear stress over others in three-point loading. One can interpret that the addition of the rivet, which created the stress concentration, is more sensitive in tension than shearing.
5. Perspective on the FBG Strain Sensor for Damage Detection and Monitoring
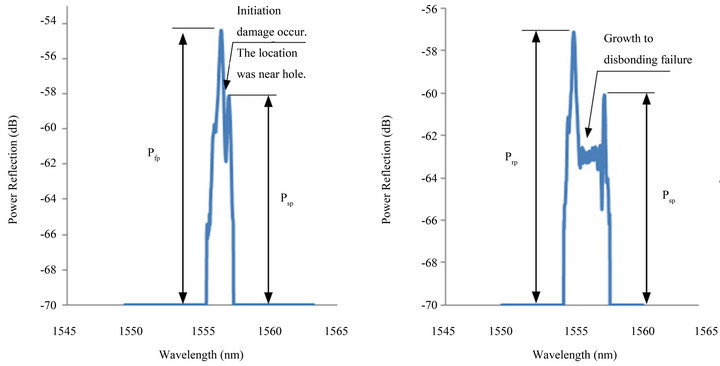
FBG strain sensors provide two data readouts in the spectrum analyzer: power reflection and wavelength. The wavelength equation gives a linear relationship with the mechanical strain as indicated by Equations (1) and (2). If the material or structure in which the FBG is embedded suffers damage that causes a non-linear mechanical strain response, Equations (1) and (2) cannot be used. However, if the response through the length of the FBG grating period is still uniform, those equations can still be used. The power reflection is used to measure whether materials or structures have been damaged enough to cause the FBG grating length to become non-uniform. This measurement is marked by a multi-peak occurrence of the power reflection.
Figures 24(a)-(d) show the characteristic evolution of the FBG spectrum under tension loading. There are three dominant peaks in the spectrum of the FBG reflection during loading in the specimen, and those peaks changed as the delamination progressed. The three dominant peaks in the spectrum are defined as Pfp (first peak), Psp (second peak), and Ptp (third peak). The equation based on the three spectral peaks has a value ratio ([(Pfp − Psp) + (Pfp − Ptp)]/2) that is relatively linear, so it can be used to indicate the growth of delamination.
Figure 25 shows a characteristic evolution of the spectrum with a change in wavelength without the occurrence
 (a)
(a)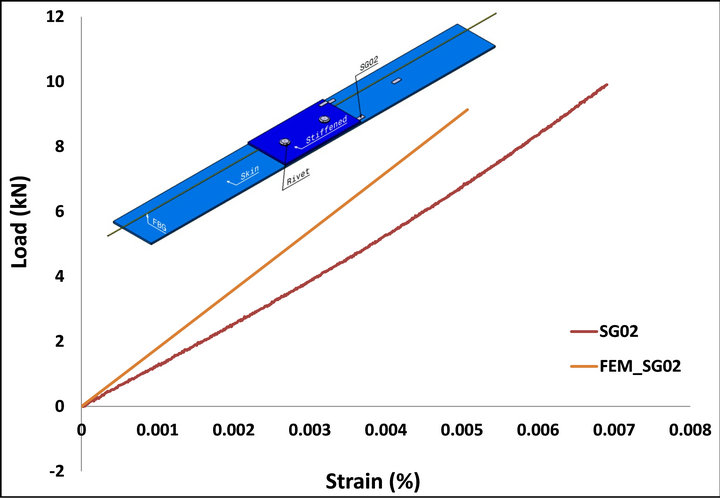 (b)
(b)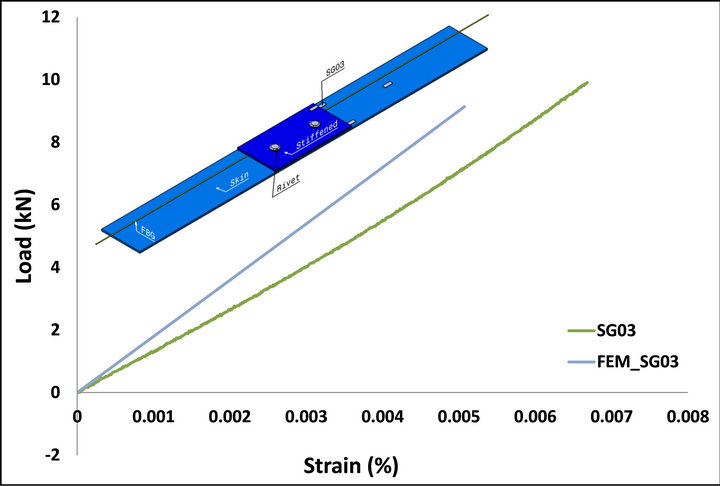 (c)
(c)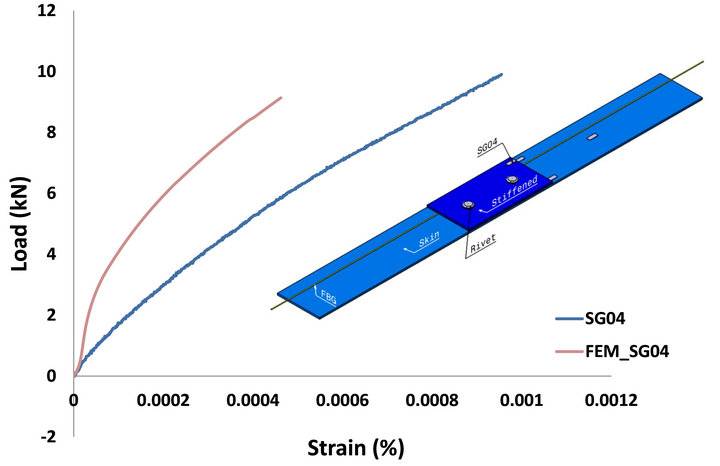 (d)
(d)
Figure 21. (a), (b), (c) and (d) comparisons of mechanical behavior based on experimental strain gage measurements and finite element analysis results.
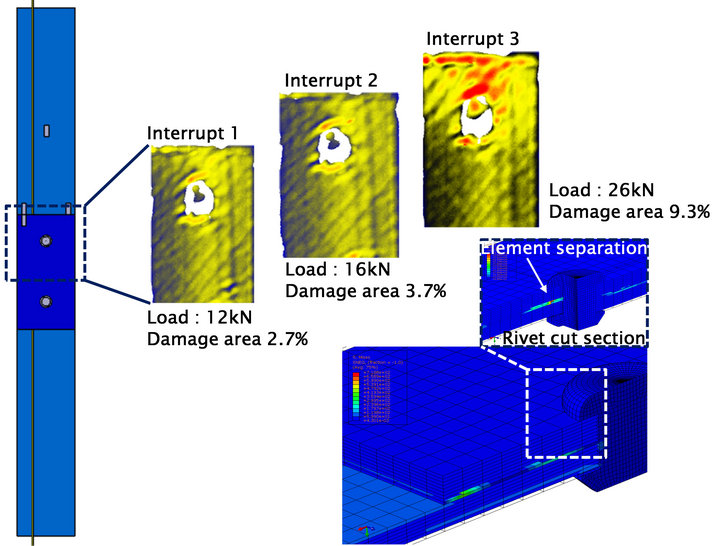
Figure 22. Tensile loading interrupt tests.
of multiple peaks. Under three-point bending, the spectrum peak has nearly the same value, but the peak wavelength width is broader. The ratio between the original wavelength and the loaded wavelength can be used to quantify the growth of the damage. The equation for the loaded and original wavelengths of this spectrum has a value ratio (∆l2 − ∆l1) that is relatively linear, so it can be used to indicate the growth of delamination.
Figures 26(a) and (b) show the specimen test results under a three-point bending test. These graphs show that the normalized power reflection could not be used as an indicator of delamination growth because the normalized intensity value remains nearly the same during a loading run, and the line’s slope is small. There is typically a uniform strain response in the FBG reading. Meanwhile, the normalized wavelength over the loading run could more clearly be used as a damage growth indicator. After damage occurred, the normalized wavelength curve in-
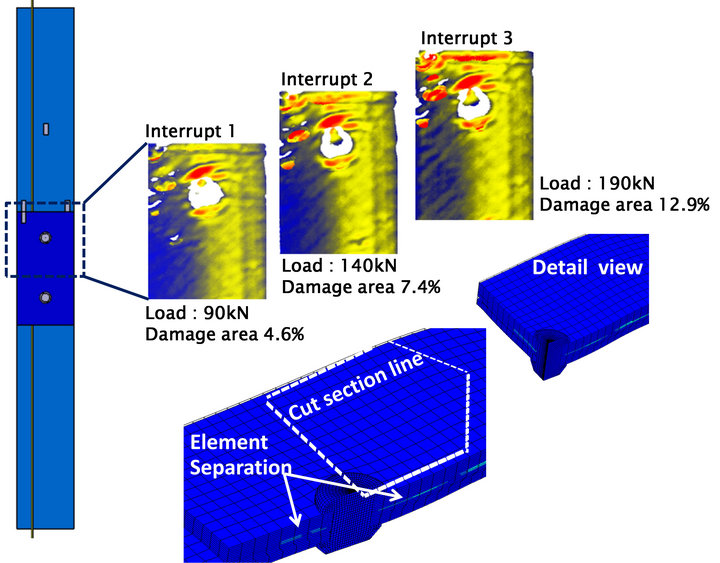
Figure 23. Three-point bending loading interrupt tests.
creased significantly as the load increased. As a result, the normalized wavelength can be used to quantitatively measure damage in a uniform strain failure.
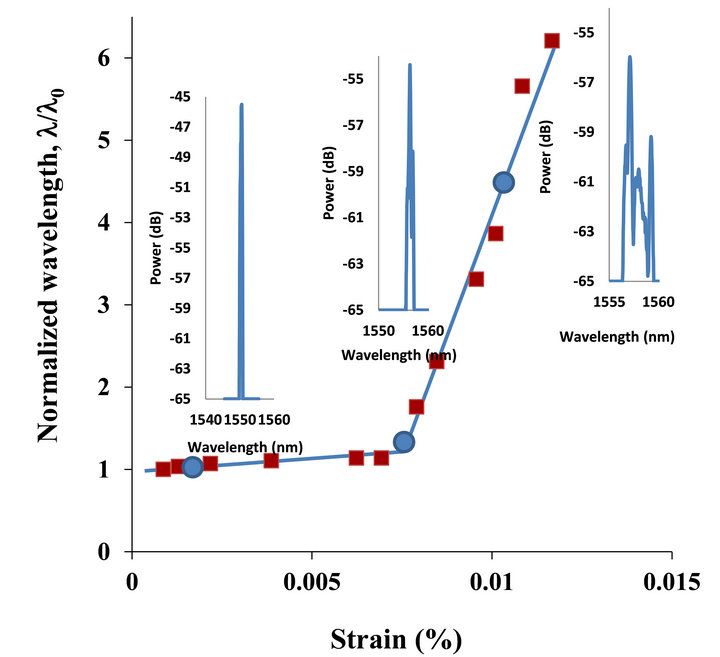
Figures 27(a) and (b) show the specimen test results under tension loading. These graphs indicate that the normalized power reflection and wavelength can be used as tracking parameters for delamination growth because the occurrence of multiple peaks with broader wavelengths can be clearly seen when damage occurred. Exactly these indicators can be seen in the figures at the point of specimen breakage.
Figure 28 shows how the multi-peak power reflection quantifies the delamination growth specimen model under tension loading. By defining the ratio between the three dominant peaks as [(Pfp − Psp) + (Pfp − Ptp)]/2, we can see the correlation between the multi-peak spectrum and delamination growth. While Figure 29 shows the test scenario in the three-point loading, the equation (∆l2 − ∆l1) can be used to quantify the delamination because the phenolmena of multi-peak occurrence is not seen clearly in this case. However, if damage initiates and grows, the wavelength broadens significantly.
6. Discussion and Conclusion
The behavior of a thin composite structure with a mismatched stiffener in the combined joint has been demonstrated by numerical analysis and experimental approaches. Continuous damage monitoring using FBG has also demonstrated that FEM predicts the mechanical behavior of the structure, which demonstrates a fundamental behavior difference under tension and three-point loading. Where the normal stress at the edge of the stiffener plays an important role in initiate peeling failure due to tensile loading as shown in Figure 13, the addition of a rivet induces a high risk of bearing failure as shown in Figure 17 because nearly the entire given load flowed to the rivet area. In the case of three-point loading, the normal stress distribution shifted to the middle of the specimen model as shown in Figure 14. The addition of a rivet increased the resistance to out-of-plane failure at the edge of the stiffness bearing failure, and the risk of bearing failure is small because the load transferring to the rivet area occurred gradually. The experimental approach showed a close agreement between strain gage measurements and finite element analysis results as shown in Figure 21. The prediction of the growth of delamination in the specimen model also showed a close agreement between the methods as shown by the results of the C-scan in Figures 22 and 23. These conclusions show that the predictions by numerical analysis can be verified well by experimental approaches.
 (a)
(a)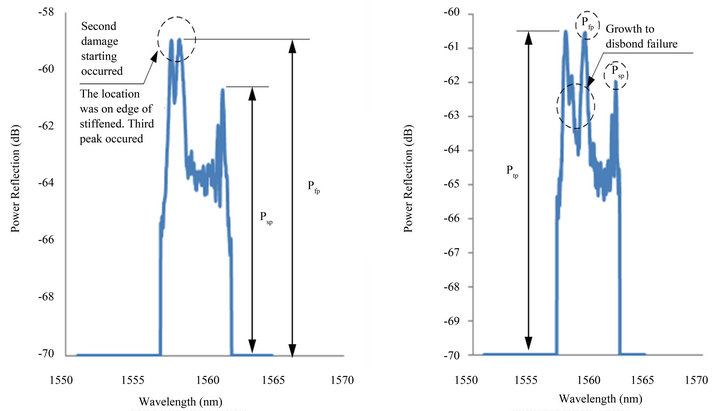 (b)
(b)
Figure 24. (a), (b), (c) and (d) Evolution of reflected FBG spectrum shape under tensile loading.
Numerical and experimental approaches have become crucial to determine proper placement of the FBG because the FBG is only able to detect damage adjacent to the grating length. As a result, the behavior of the model and its tendency to damage must be understood before fabrication of the specimen models to avoid misreadings.
We conclude that the FBG can detect initial damage and its subsequent growth properly as predicted by finite element analysis and corroborating experimental data. The occurrence of damage to the specimen models can
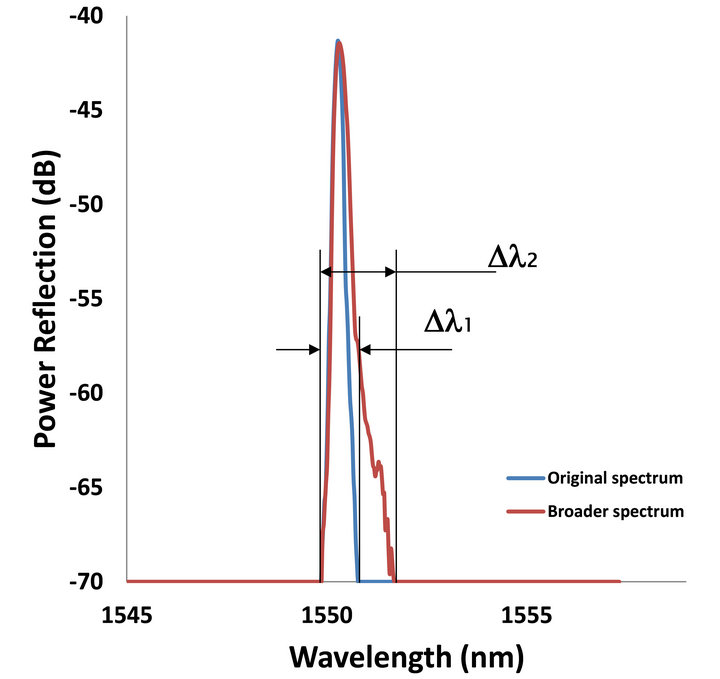
Figure 25. Evolution of reflected FBG spectrum shape under three-point loading.
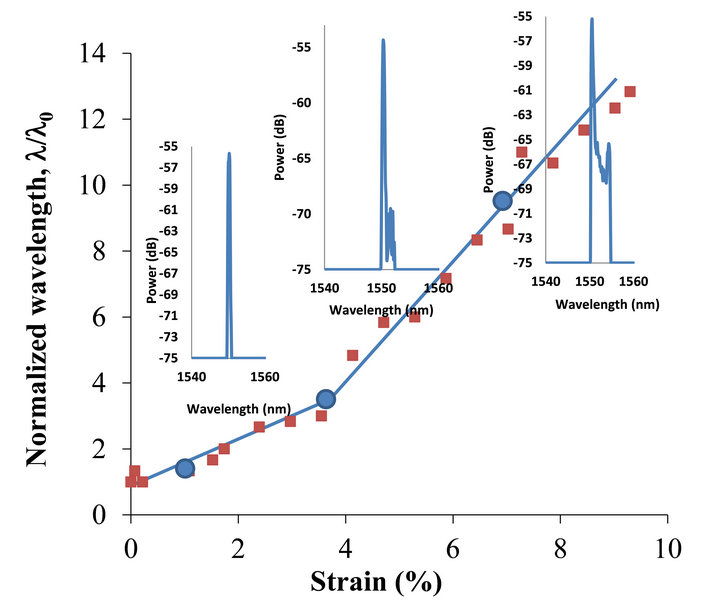
Figure 26. Normalized wavelength for FBG readings in three-point bending test.
 (a)
(a)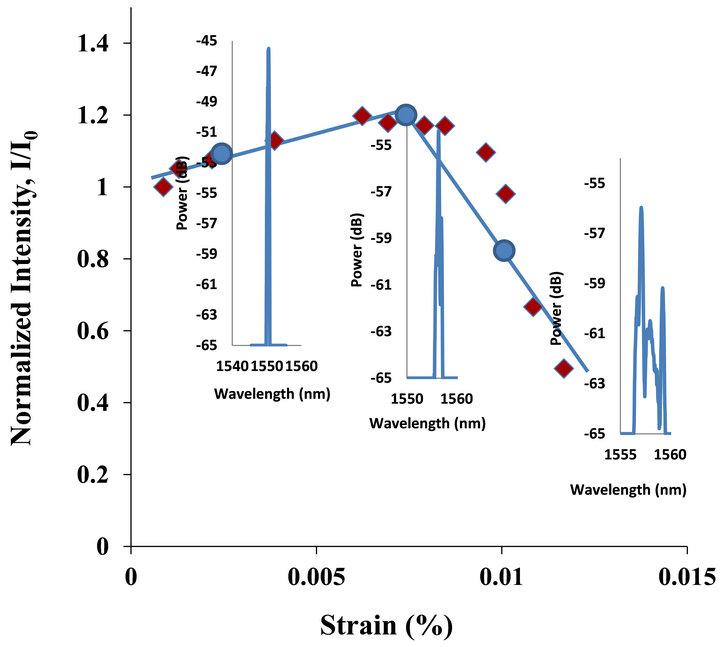 (b)
(b)
Figure 27. (a) Normalized wavelength and (b) power reflection for FBG readings in tensile test.
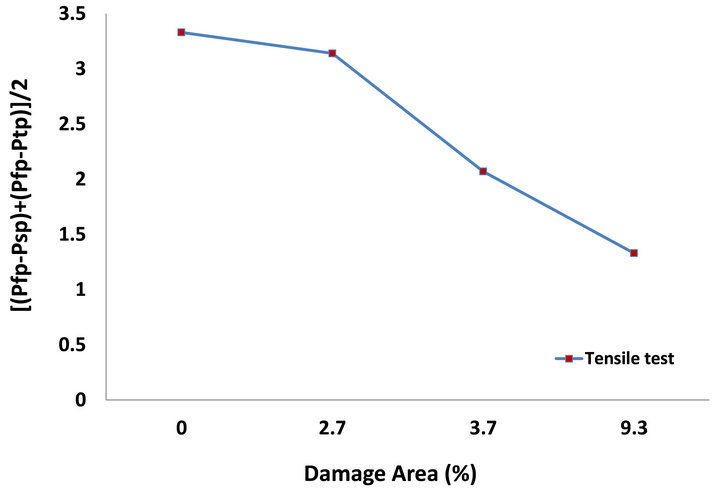
Figure 28. Quantification of damage based on the shape evolution of the FBG spectrum reflection under tensile loading.
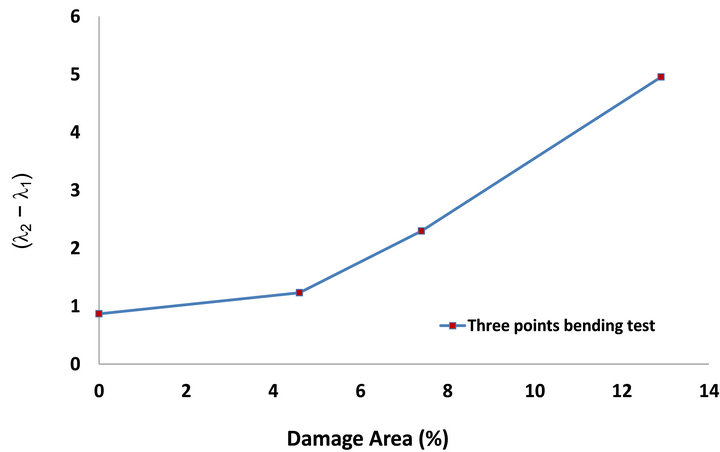
Figure 29. Quantification of damage based on the shape evolution of the FBG spectrum under three-point bending loading.
be characterized by FBG with the occurrence of multiple peaks in the power reflection and significantly broader peaks in wavelength. The damage growth can be quantified successfully by FBG readings through the appropriate ratio between multiple spectral peaks and through the differences in the wavelength ratios. Additionally, if the damage to the specimen model still provides a linear response to the FBG period gratings, damage characterization can be performed by using the wavelength evolution even if a multi-peak spectrum does not occur as demonstrated by Figures 25 and 26. However, if the damage induces a non-linear response at the FBG grating periodthen the multi-peak power reflection and wavelength broadening can be used to characterize the damage as indicated by Figures 24 and 27. The design evolution of the application of FBG in the materials or structure can be seen in Figure 30.
With the above characteristics, it is necessary to continue research by using combined loading to represent the real loading conditions on aircraft structures.
7. Acknowledgements
The authors gratefully acknowledge the Tokyo Metropolitan Government for its financial support from the
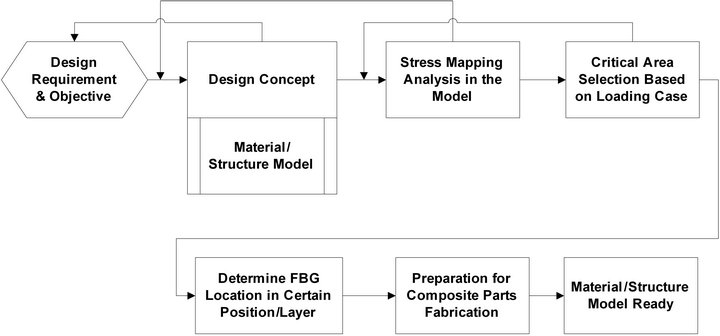
Figure 30. Design evolution charts before FBG Installation.
Asian Human Resources Fund under the project Asian Network of Major Cities 21 (ANMC21).
REFERENCES
- J. M. Gere and S. P. Timoshenko, “Mechanics of Materials,” 3rd SI Edition, Chapman & Hall, London, 1991.
- J. Schijve, “Secondary Bending Moment,” NLR 72036U, 1972.
- A. A. Baker, “Bonded Repair of Aircraft Structures,” Martinus Nijhoff Publishers, Leiden, 1988. doi:10.1007/978-94-009-2752-0
- S. Takeda, Y. Okabe, T. Yamamoto and N. Takeda, “Detection of Edge Delamination in CFRP Laminates under Cyclic Loading Using Small-Diameter FBG Sensors,” Composite Science and Technology Journal, Vol. 63, No. 13, 2003, pp. 1885-1894. doi:10.1016/S0266-3538(03)00159-3
- S. Huang, M. M. Ohn, M. Leblanc and R. M. Measures, “Continuous Arbitrary Strain Profile Measurements with Fiber Bragg Grating,” Smart Material and Structure, Vol. 7, No. 2, 1998, pp. 248-256. doi:10.1088/0964-1726/7/2/012
- S. Takeda, S. Minakuchi, Y. Okabe and N. Takeda, “Delamination Monitoring of Laminated Composites Subjected to Low-Velocity Impact Using Small-Diameter FBG Sensors,” Composites Part A: Applied Science and Manufacturing, Vol. 36, No. 7, 2005, pp. 903-908.
- K. Peters, P. Pattis, J. Botsis and P. Giaccari, “Experimental Verification of Response of Embedded Optical Fiber Bragg Grating Sensors in Non-Homogeneous Strain Fields,” Optics and Lasers in Engineering, Vol. 33, No. 2, 2000, pp. 107-119. doi:10.1016/S0143-8166(00)00033-6
- H. Wang, S. L. Ogin, A. M. Thorne and G. T. Reed, “Interaction between Optical Fibre Sensors and Matrix Cracks in Cross-Ply GFRP Laminates. Part 2: Crack Detection,” Composite Science and Technology, Vol. 66, No. 13, 2006, pp. 2367-2378. doi:10.1016/j.compscitech.2005.10.021
- N. Takeda, “Characterization of Microscopic Damage in Composite Laminates and Real-Time Monitoring by Embedded Optical Fiber Sensors,” International Journal of Fatigue, Vol. 24, No. 2-4, 2002, pp. 281-289. doi:10.1016/S0142-1123(01)00083-4
- S. Yashiro, N. Takeda, T. Okabe and H. Sekine, “A New Approach to Predicting Multiple Damage States in Composite Laminates with FBG Sensors,” Composite Science and Technology Journal, Vol. 65, No. 3-4, 2005, pp. 659-667. doi:10.1016/j.compscitech.2004.09.022
- J. Botsis, L. Humbert, F. Colpo and P. Giaccari, “Embedded Fiber Bragg Grating Sensor for Internal Strain Measurements in Polymeric Materials,” Optic and Lasers in Engineering, Vol. 43, No. 3-5, 2005, pp. 491-510. doi:10.1016/j.optlaseng.2004.04.009
- H. Y. Ling, K. T. Lau, L. Cheng and Z. Q. Su, “Mode II Fracture Behavior Monitoring for Composite Laminates using Embedded Fiber Bragg Grating Sensors,” Composite Structure, Vol. 76, No. 1-2, 2006, pp. 88-93. doi:10.1016/j.compstruct.2006.06.013
- P. P. Camanho, C. G. Davila and M. F. De Moura, “Numerical Simulation of Mixed-Mode Progressive Delamination Composite Materials,” Journal of Composite Materials, Vol. 37, No. 16, 2003, pp. 1415-1438. doi:10.1177/0021998303034505
- A. Turon, P. P. Camanho, J. Costa and C. G. Davila, “A Damage Model for the Simulation of Delamination in Advanced Composites under Variable-Mode Loading,” Mechanics of Materials, Vol. 38, No. 11, 2006, pp. 1072-1089. doi:10.1016/j.mechmat.2005.10.003
- Q. Yang and B. N. Cox, “Cohesive Models for Damage Evolution in Laminated Composites,” International Journal of Fracture, Vol. 133, No. 2, 2005, pp. 107-137. doi:10.1007/s10704-005-4729-6
- E. D. Reedy, F. J. Mello and T. R. Guess, “Modeling the Initiation and Growth of Delaminations in Composite Structures,” Journal of Composite Materials, Vol. 31, No. 8, 1997, pp. 812-831. doi:10.1177/002199839703100804
- J.-H. Kweon, J.-W. Jung, T.-H. Kim, J.-H. Choi and D.-H. Kim, “Failure of Carbon Composite-to-Aluminum Joints Combined Mechanical Fastening and Adhesive Bonding,” Composite Structures, Vol. 75, No. 1-4, 2006, pp. 192-198. doi:10.1016/j.compstruct.2006.04.013
- J. W. H. Yap, M. L. Scott, R. S. Thomson and D. Hachenberg, “The Analysis of Skin-to-Stiffener Debonding in Composite Aerospace Structures,” Composite Structures, Vol. 57, No. 1-4, 2002, pp. 425-435. doi:10.1016/S0263-8223(02)00110-1
- A. G. Magalhaes, M. F. S. F. de Moura and J. P. M. Goncalves, “Evaluation of Stress Concentration Effects Single-Lap Bonded Joint of Laminate Composite Materials,” Adhesion and Adhesive, Vol. 25, No. 4, 2005, pp. 313-319. doi:10.1016/j.ijadhadh.2004.10.002
NOTES
*Corresponding author.