Open Journal of Medicinal Chemistry
Vol.3 No.4(2013), Article ID:40395,21 pages DOI:10.4236/ojmc.2013.34013
Physicochemical 2D-Qsar and 3D Molecular Docking Studies on N-Chlorosulfonyl Isocyanate Analogs as Sterol O-Acyl-Transferase-1 “Soat-1” Inhibitors
1Materials, Catalysis and Valorization of Natural Resources Laboratory (URAC 24), Faculty of Sciences and Techniques, Hassan II University, Mohammedia, Morocco
2Organic Chemistry, Catalysis and Environment Laboratory, Faculty of Sciences, Hassan II University, Casablanca, Marocco
Email: *mzahouily@yahoo.fr
Copyright © 2013 Khalid El Akri et al. This is an open access article distributed under the Creative Commons Attribution License, which permits unrestricted use, distribution, and reproduction in any medium, provided the original work is properly cited.
Received September 3, 2013; revised October 8, 2013; accepted October 15, 2013
Keywords: Sterol O-Acyl-Transferase-1; N-CSI Analogs; QSAR; MLR; ANN; 3D Molecular Docking
ABSTRACT
A series of N-carbonyl-functionalized ureas, carbamates and thiocarbamates derivatives (or N-Chloro sulfonyl isocyanate “N-CSI”) were involved in linear and nonlinear physicochemical quantitative structure-activity relationship “QSAR” analysis to find out the structural keys to control the inhibition against Sterol O-Acyl-Transferase-1 “SOAT-1”. The results indicate the important effects of geometrical and chemical descriptors on the inhibitory activity of SOAT-1. The molecules were also screened for three-dimensional molecular docking on the crystal structure of ACAT-1 (1WL5 for ACAT-1, PDB). A comparison between 2D-QSAR and 3D molecular docking studies shows that the latter confirm the first results and represent a good prediction of the chemical and physical nature of interactions between our drug molecules and enzyme SOAT-1.
1. Introduction
Acyl-coenzyme A: Cholesterol O-Acyl-Transferase (ACAT) is an intracellular enzyme that catalyzes the formation of cholesterol ester from free cholesterol and long-chain fatty acyl-coenzyme A [1-3]. Recently this enzyme was named Sterol O-Acyl-Transferase (SOAT) to keep a difference between acyl-coenzyme A: Cholesterol O-AcylTransferase (ACAT) and acetyl-coenzyme A: acetyltransferase or acetoacetyl-coenzyme A thiolase, also marked as ACAT [4]. Up to date, two SOAT isozymes have been identified [5,6]. SOAT-1 is an essential isozyme for intracellular storage of cholesteryl esters [7]. SOAT-2 is expressed exclusively in the small intestine and liver [8, 9]. In human liver, both of SOAT isozymes are expressed and may provide cholesteryl esters for very low density lipoprotein [10].
SOAT inhibitors have been developed over the last two decades as potential drugs for treatment of hypercholesterolemia and atherosclerosis [11]. In general, SOAT inhibitors are thought to have two different pharmacological actions: suppression of cholesterol adsorption in the intestine that leads to reduction of plasma cholesterol level, and suppression of foam cell formation in the arterial walls [12]. Currently, cholesterol reduction can be achieved satisfactorily with so-called strong STATIN, such as atorvastatin and pritavastatin [13]. Thus, the direct suppression of foam cell formation in atherosclerotic lesions, which is independent of the cholesterol lowering effect, is a more attractive aspect of SOAT inhibitors. As SOAT-1 is the dominant isozyme expressed in macrophage, SOAT-1 is regarded as a target molecule of SOAT-1 inhibitors in the arterial walls. However, selective disruption of macrophage SOAT-1 by bone narrow transplantation from SOAT-1 null mice to LDL receptor-null mice resulted in exacerbation of diet-induced atherosclerosis. Therefore, it is still controversial whether pharmacological inhibition of SOAT-1 in macrophages contributes to exacerbation or amelioration of atherosclerosis.
There is a large number of literature reports on the application of computational methods for describing the activity of biologically active compounds [14]. Quantitative structure-activity relationship studies are the most extensively used methods in computational chemistry. Appropriate representation of the structural and physicochemical features of chemical agents is an essential key to the successful application of QSAR models [15].
QSAR studies play a fundamental role in predicting the biological activity of new compounds and identifying ligand-receptor interaction. The first step in constructing the QSAR models is finding one or more molecular descriptors that represent variation in the structural property of the molecules by a number [16]. Structural descriptors have been classified into different categories according to different approaches including physiochemical, constitutional, geometrical, topological, and chemical descriptors. Currently, more than 1000 molecules descriptors can be easily calculated using available software such as Dragon [17].
There are different variable selection methods available including multiple linear regression (MLR) as linear method, and genetic algorithm, artificial neural network (ANN) as nonlinear methods. The relationship between molecular descriptors and activity is used to define the parameters affecting the biological activity and/or estimate the property of other molecules.
SOAT inhibitor compounds have been the subjects of QSAR studies to define statistical models describing the relationship between the structure and biological activity into the two ways—linear and nonlinear. We used the structural invariants obtained from whole molecular structures of a series of 130 derivatives of the SOAT-1 inhibitors. We exploited two different chemometrics methods, i.e., Multiple Linear Regression and Artificial Neural Network in order to make connections between structural parameters and SOAT inhibition. Finally, we performed the 3D molecular docking of these analogs on crystal of ACAT-1 (1WL5, PDB) to evaluate the binding energies as well as their mode of interaction.
2. Data and Methodology
2.1. Dataset Collection
An Intel® Core™ 2 Duo (CPU: T7300 2.00 GHz) with windows 7 and Linux Redhat operating systems were used. The two and three dimensional structures of molecules were drawn using ChemOffice v12 software package. The resulted geometry and Z-matrix were transferred into the Gaussian 98 program in order to perform the geometry and properties. The resulted geometry was performed with the semi-empirical AM1 method in MMP32 Pro program.
The biological data used in this study is SOAT inhibitory activity (in terms of pIC50 = −Log10IC50) of a set of 130 N-CSI derivatives. The data set was already synthesized and used by J. A. Picard et al. in 1996 for QSAR studies [18]. The structural features and biological activity of these compounds are listed in Table 1 (annex) and then used for subsequent QSAR analysis as dependent variable.
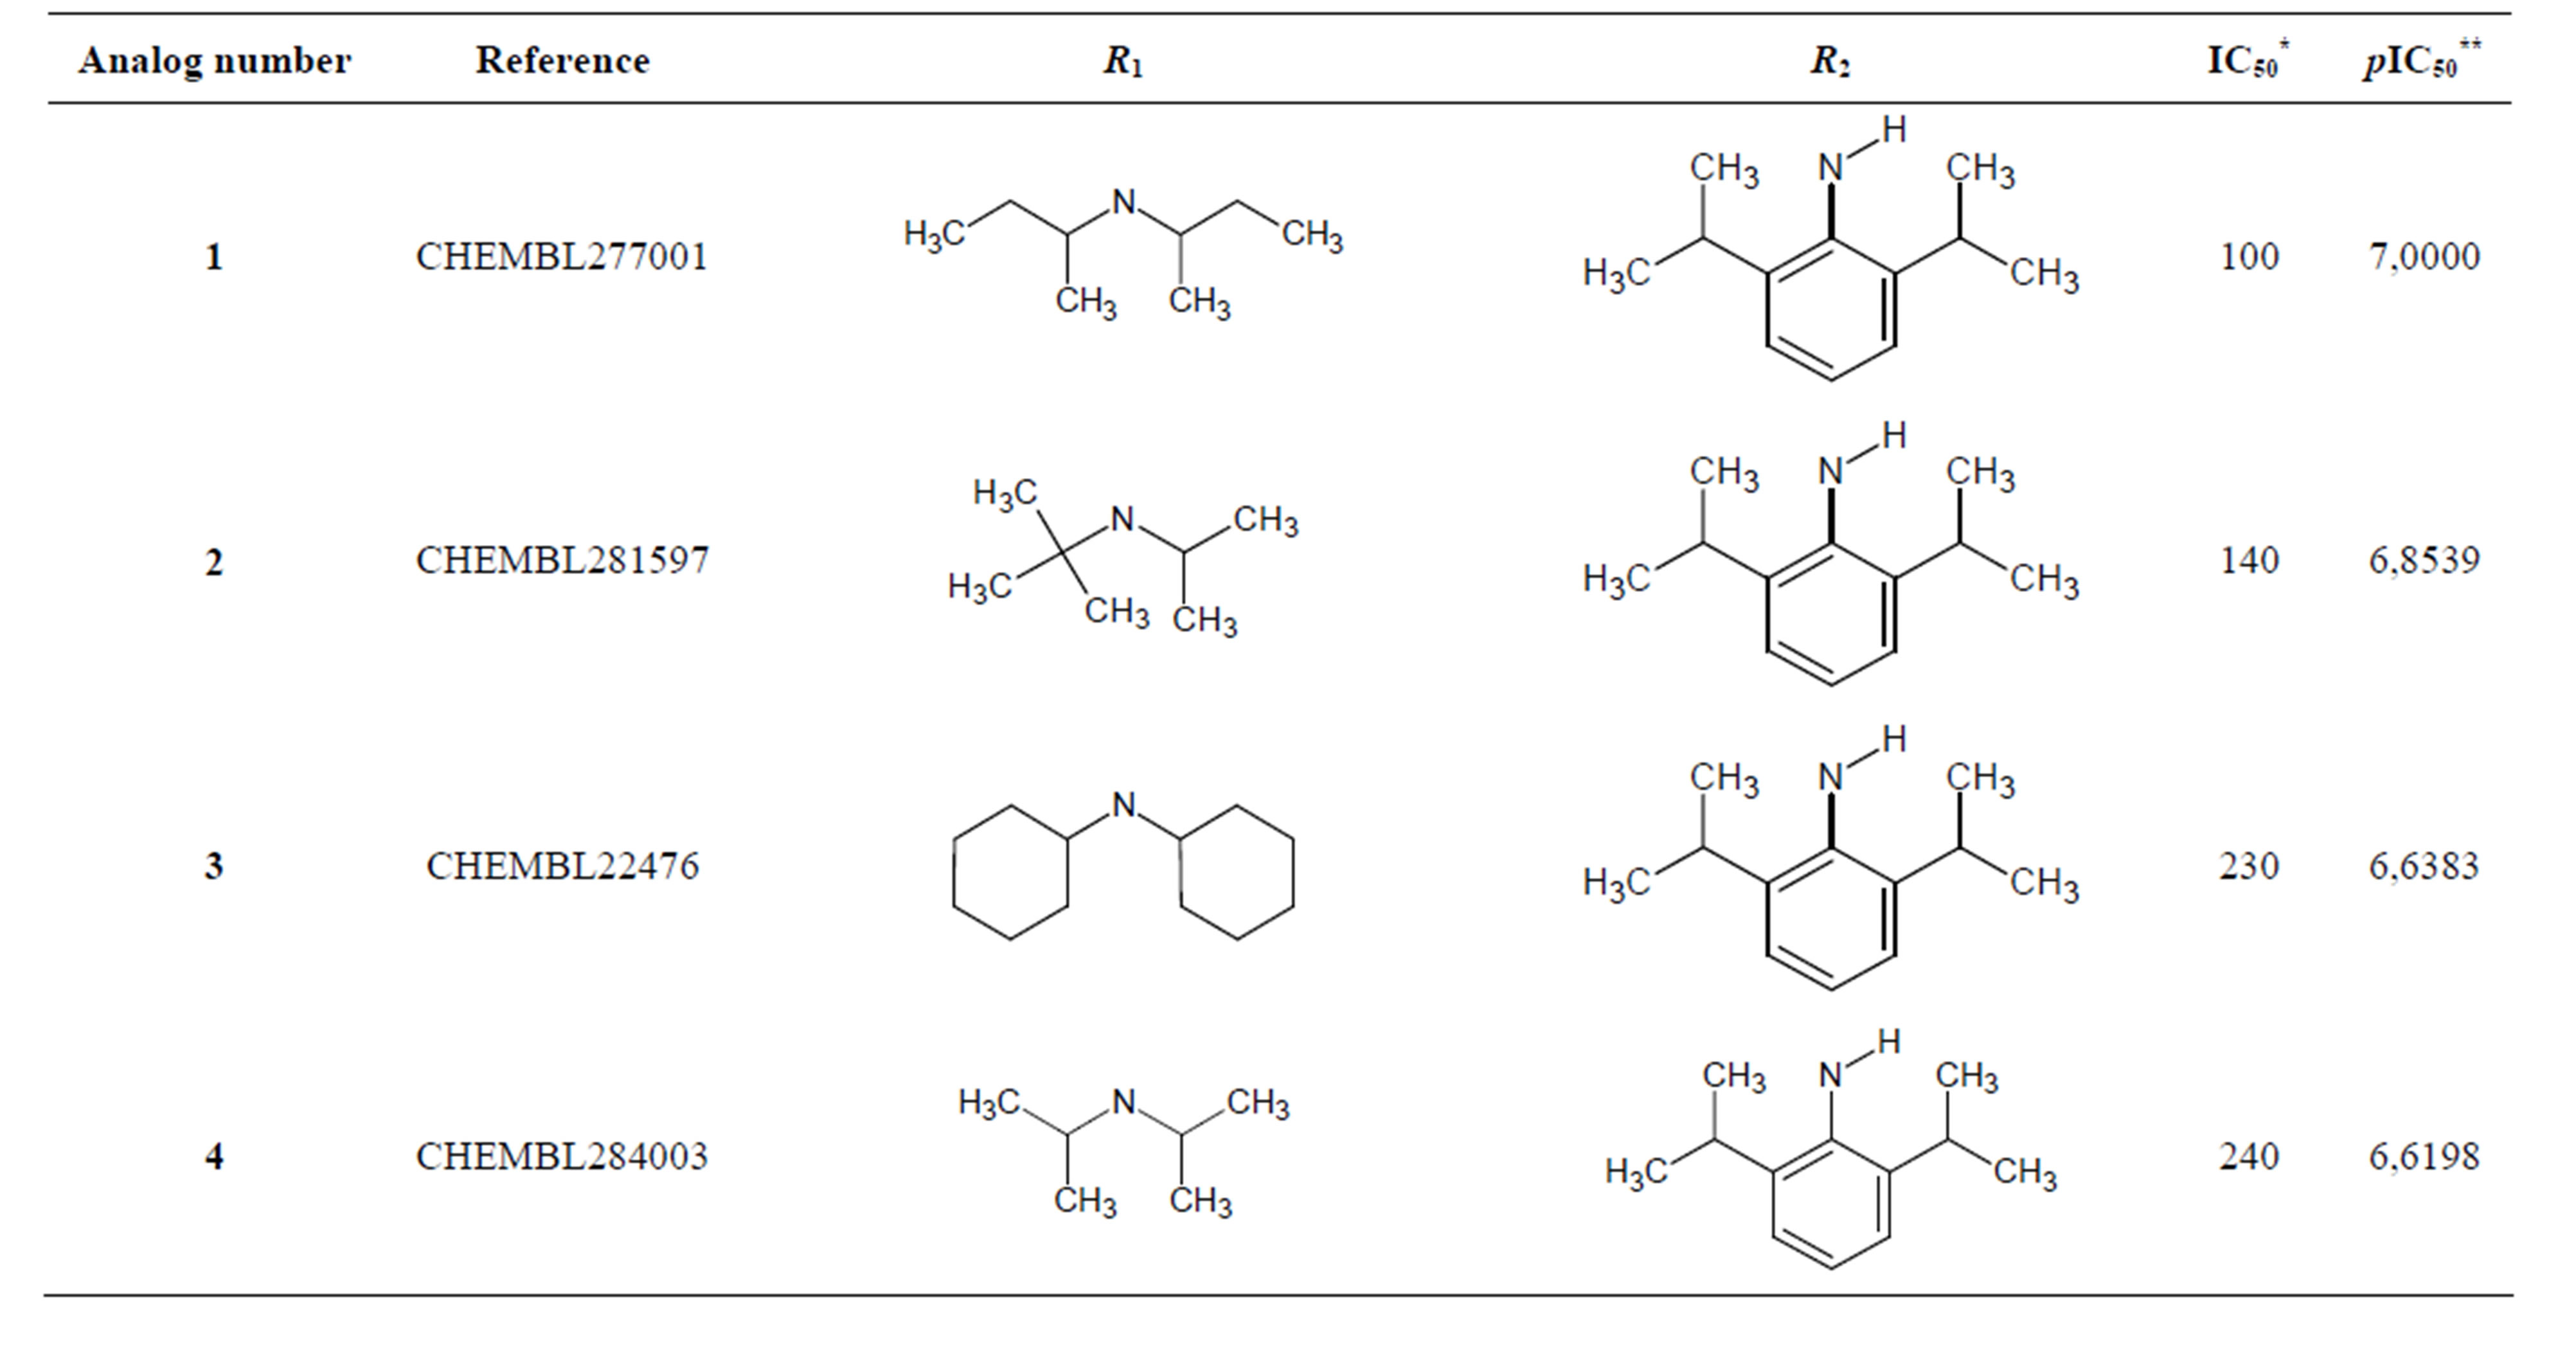
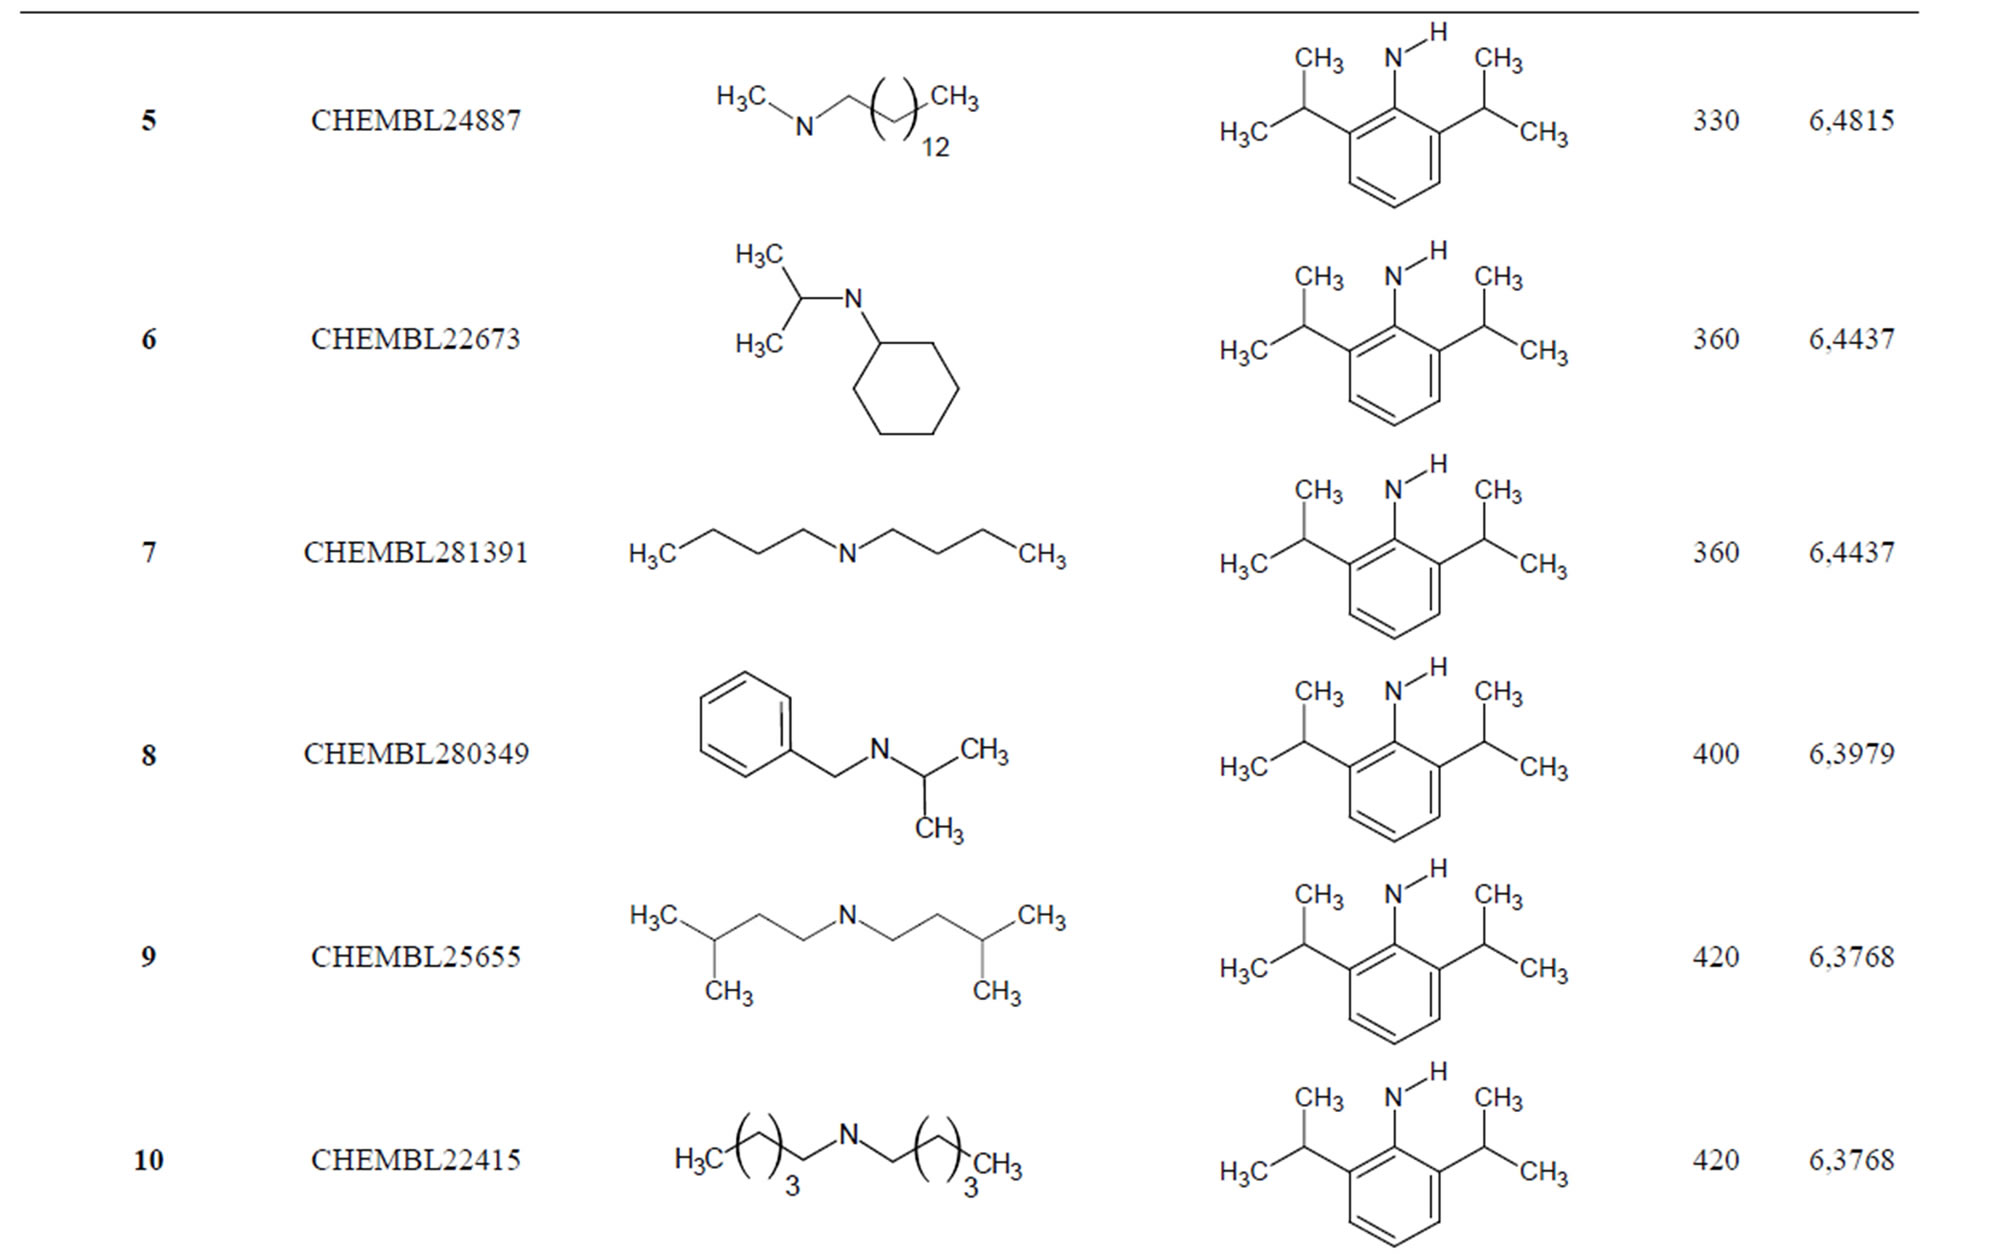
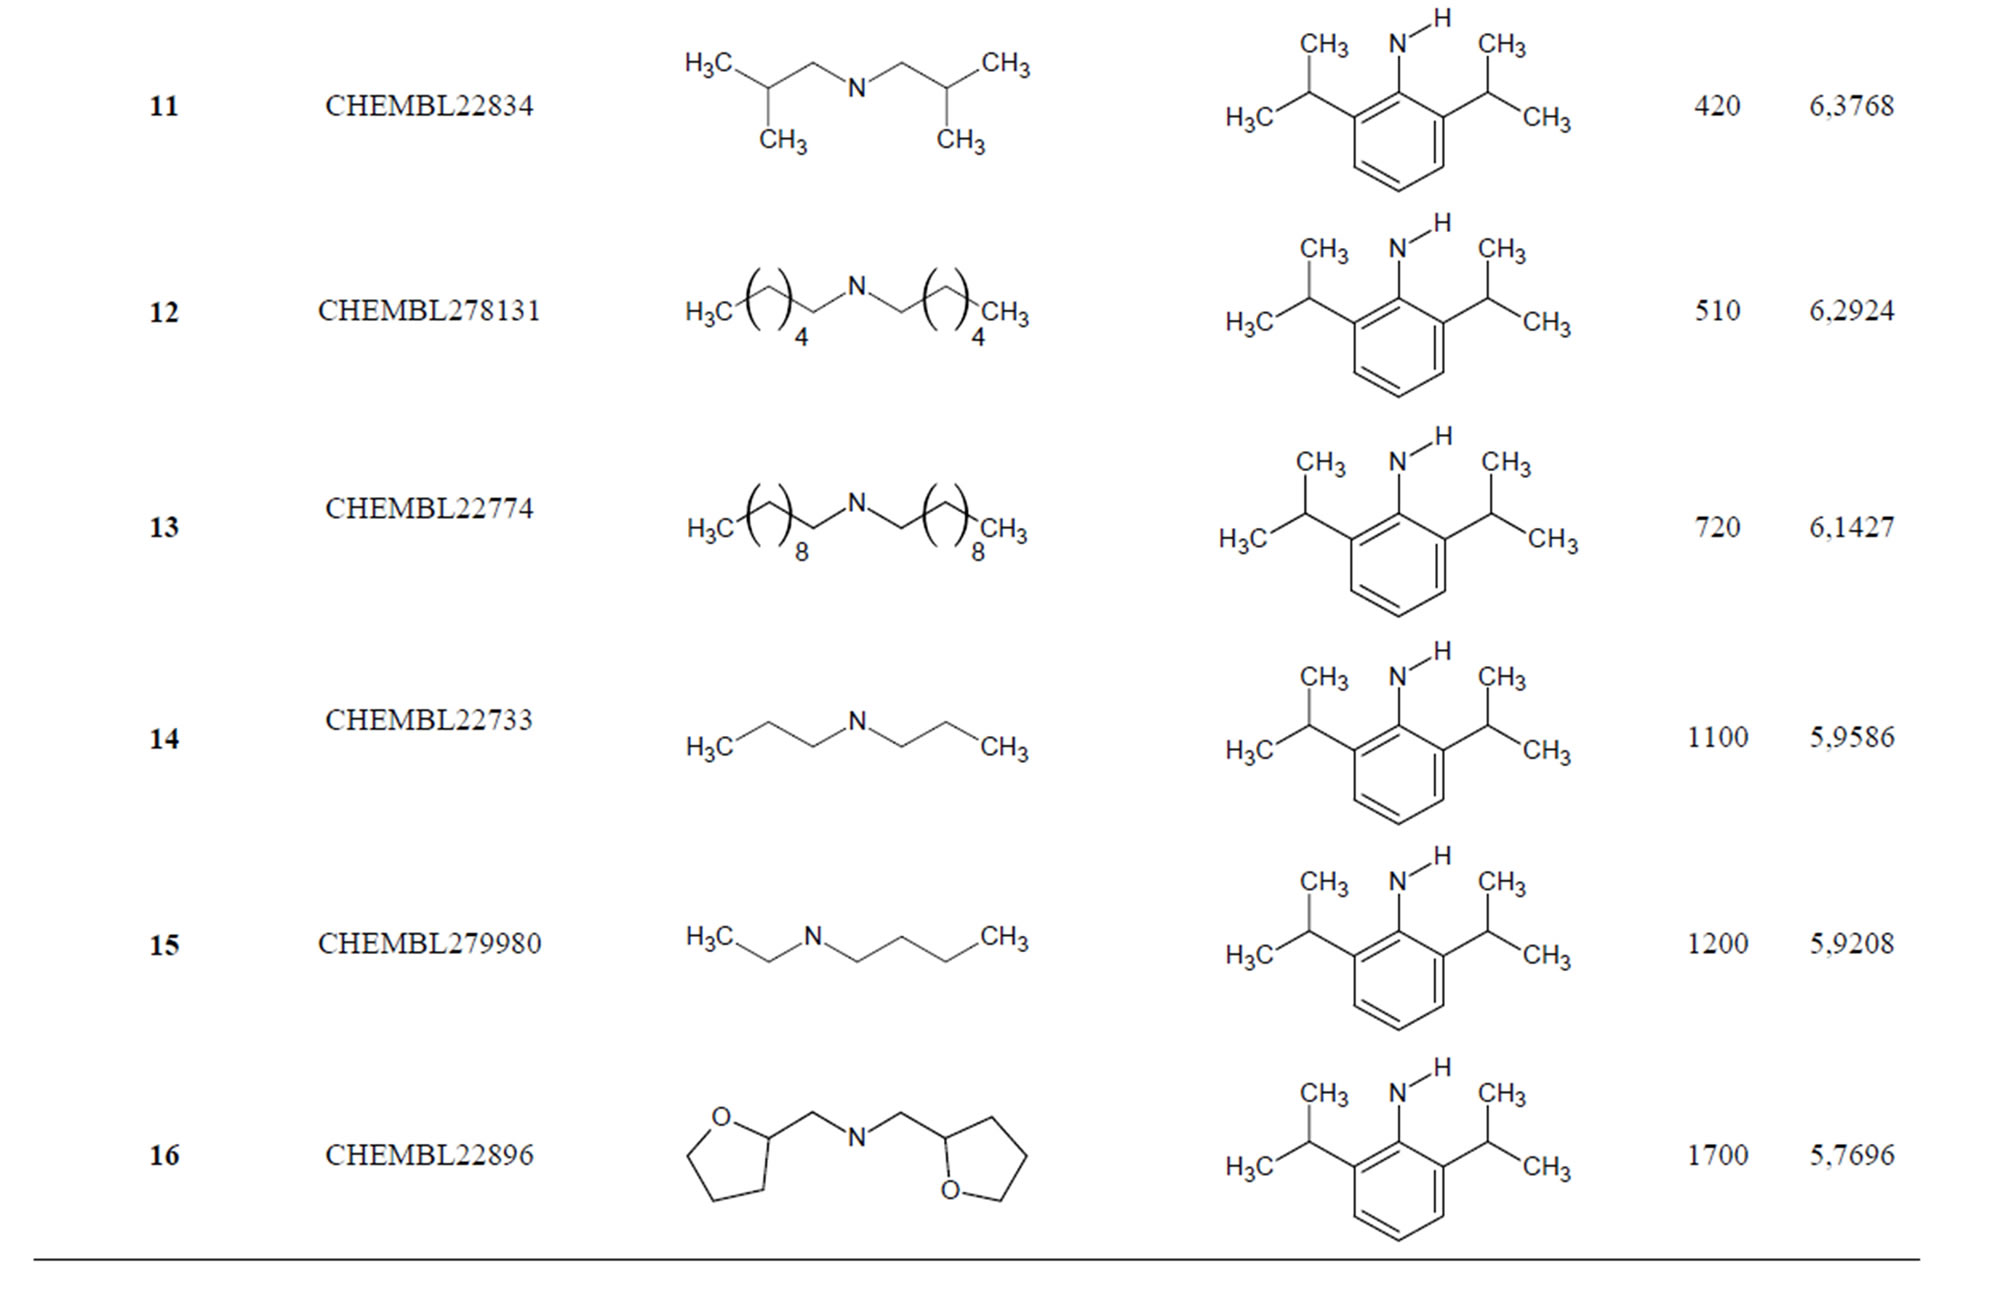
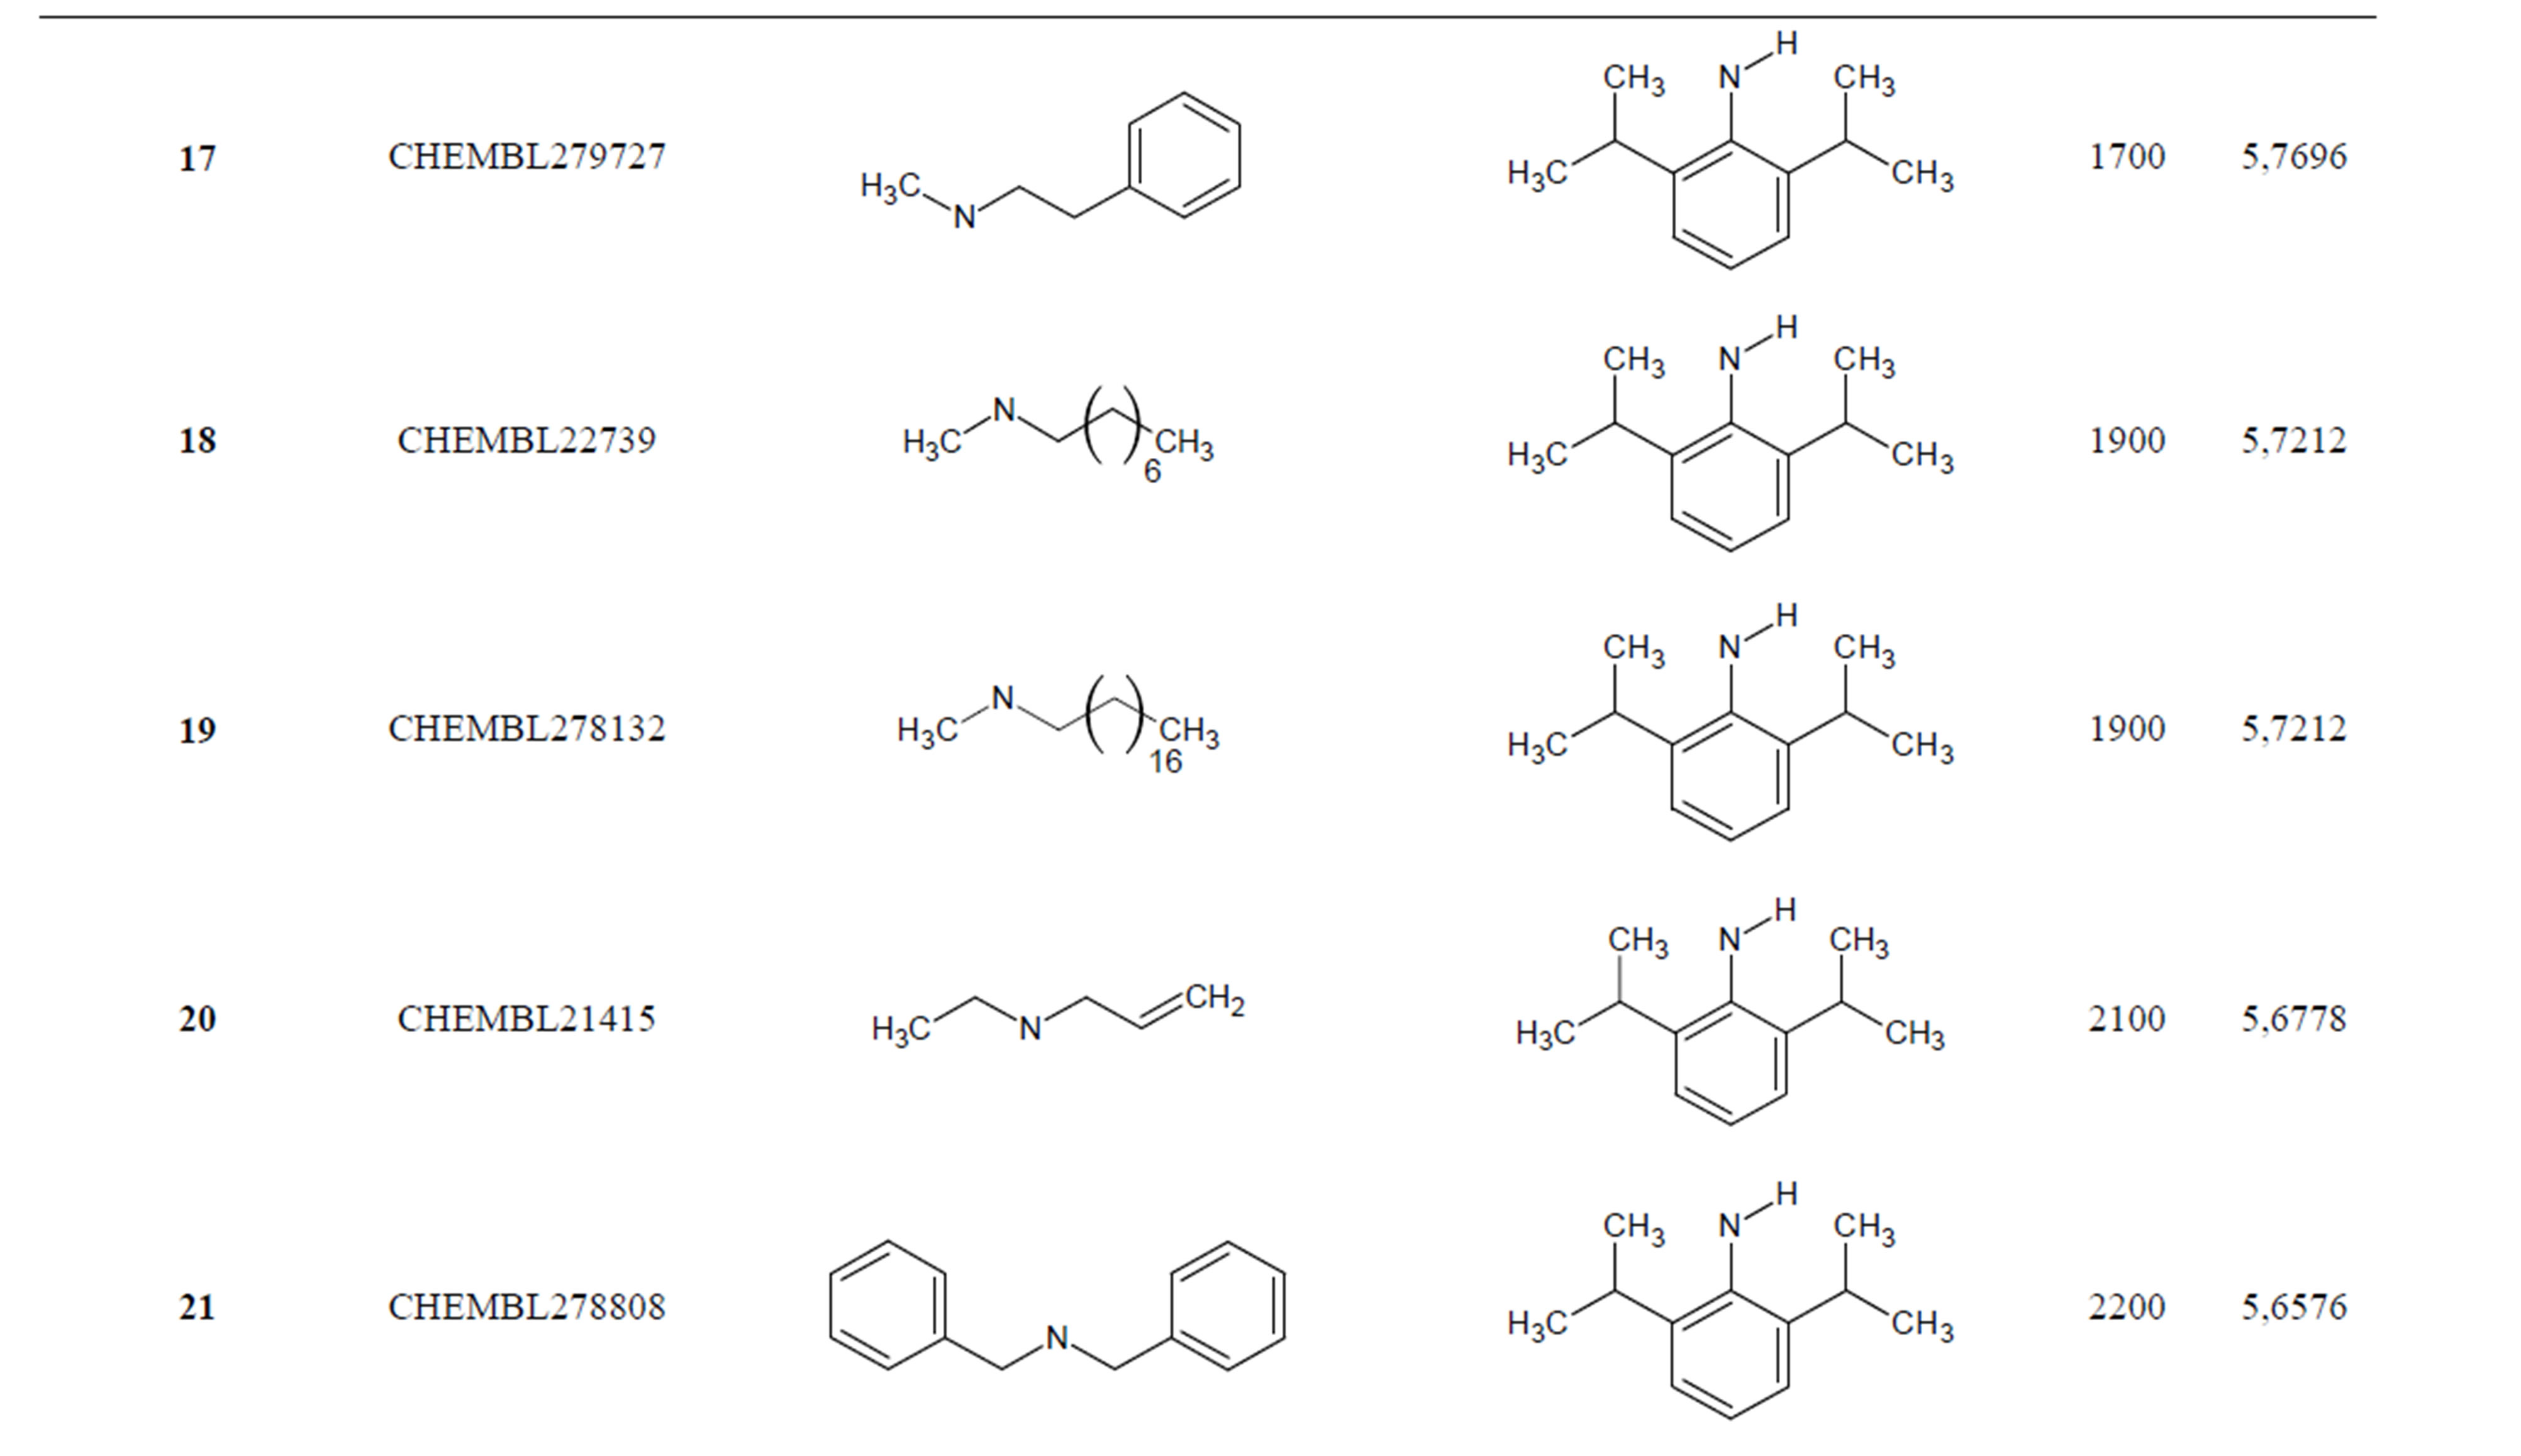
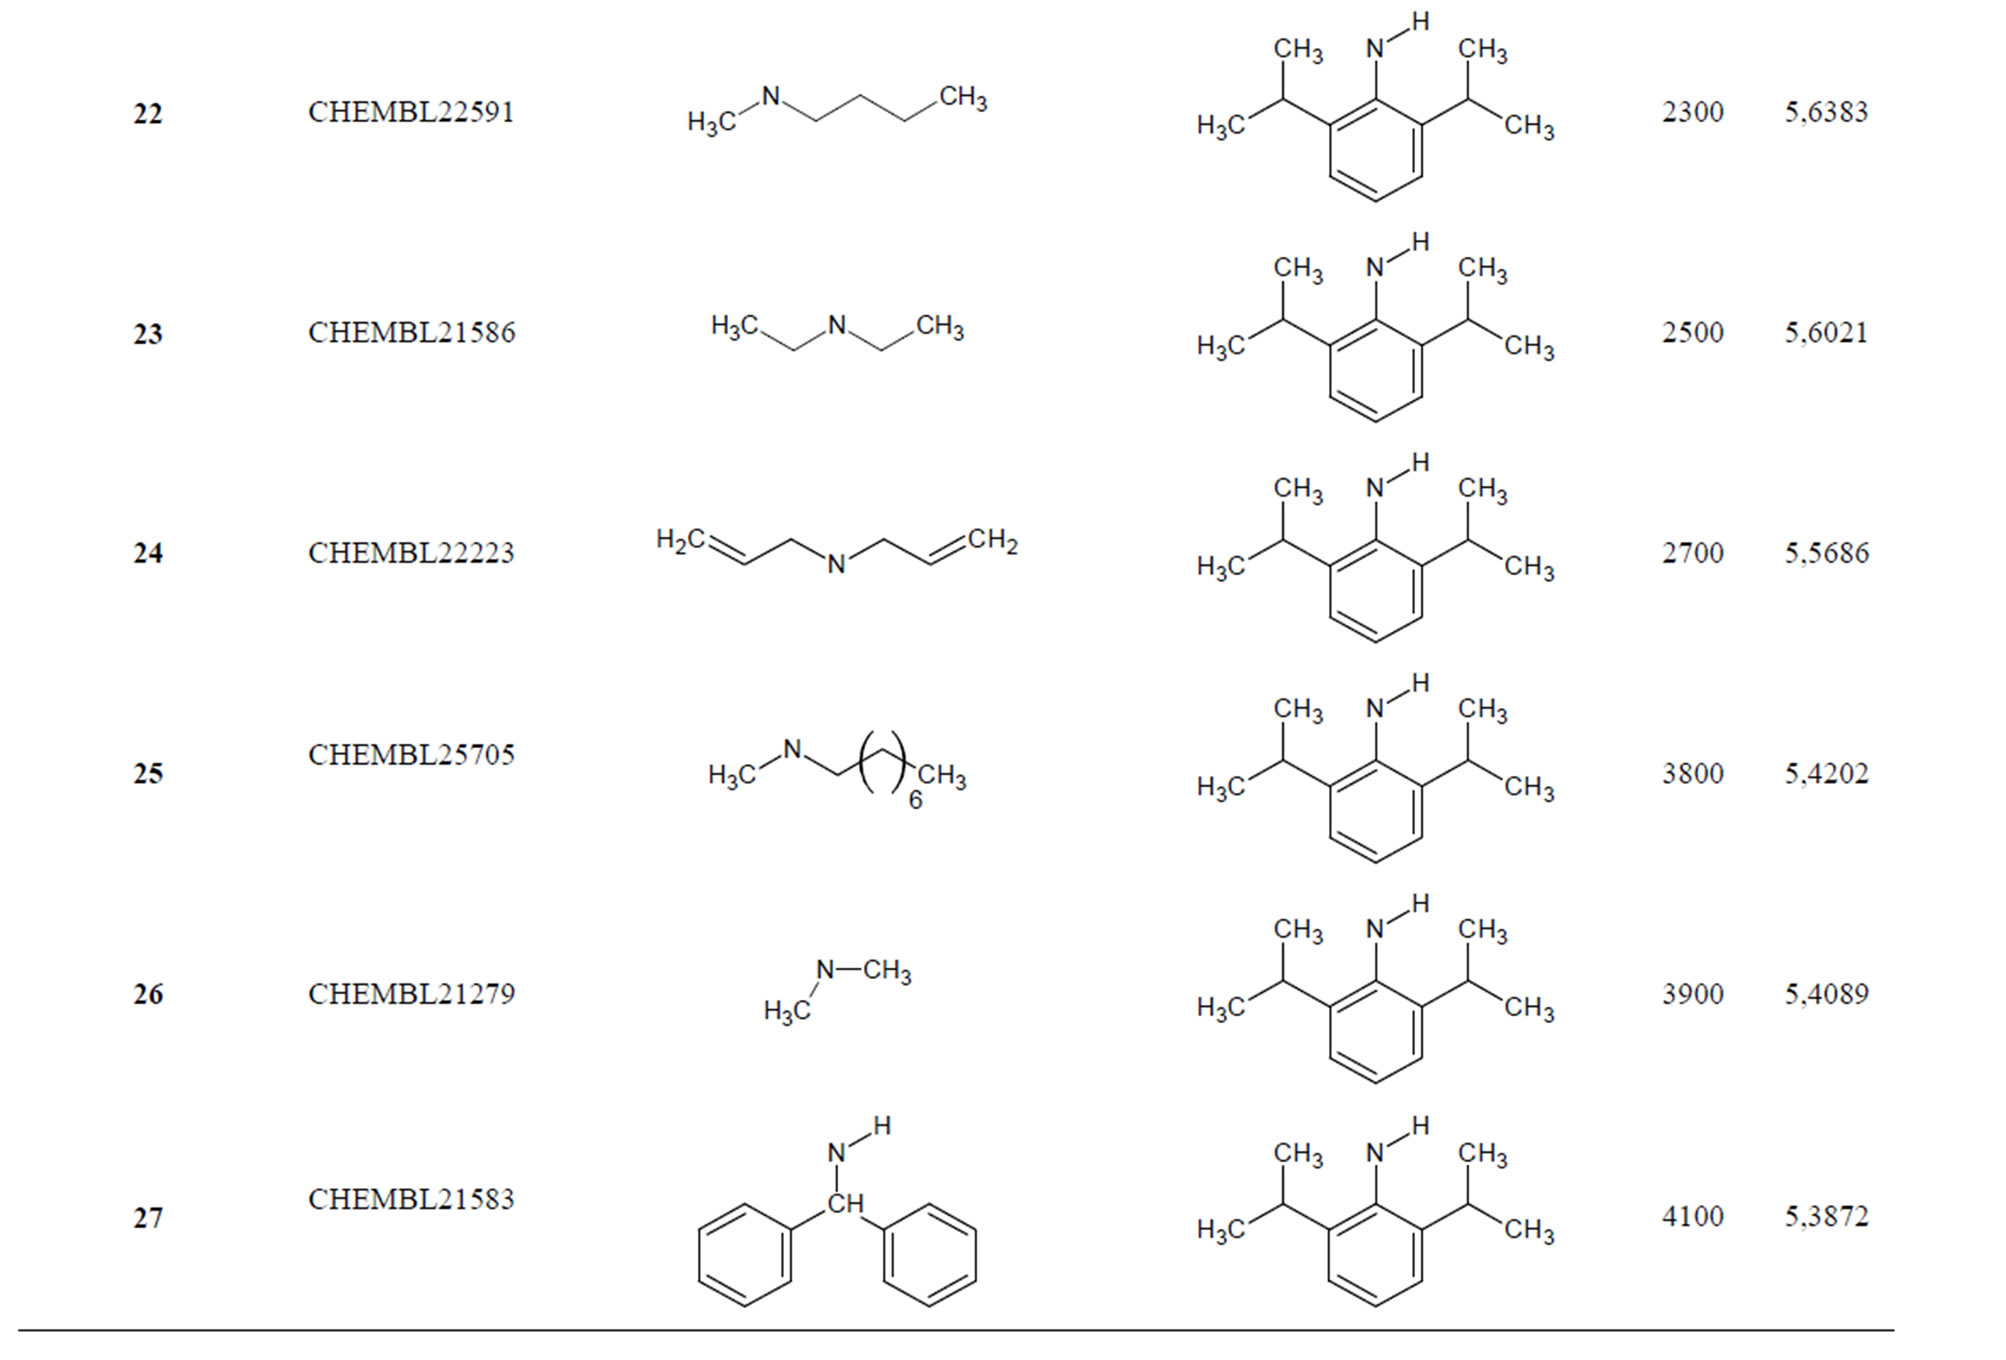

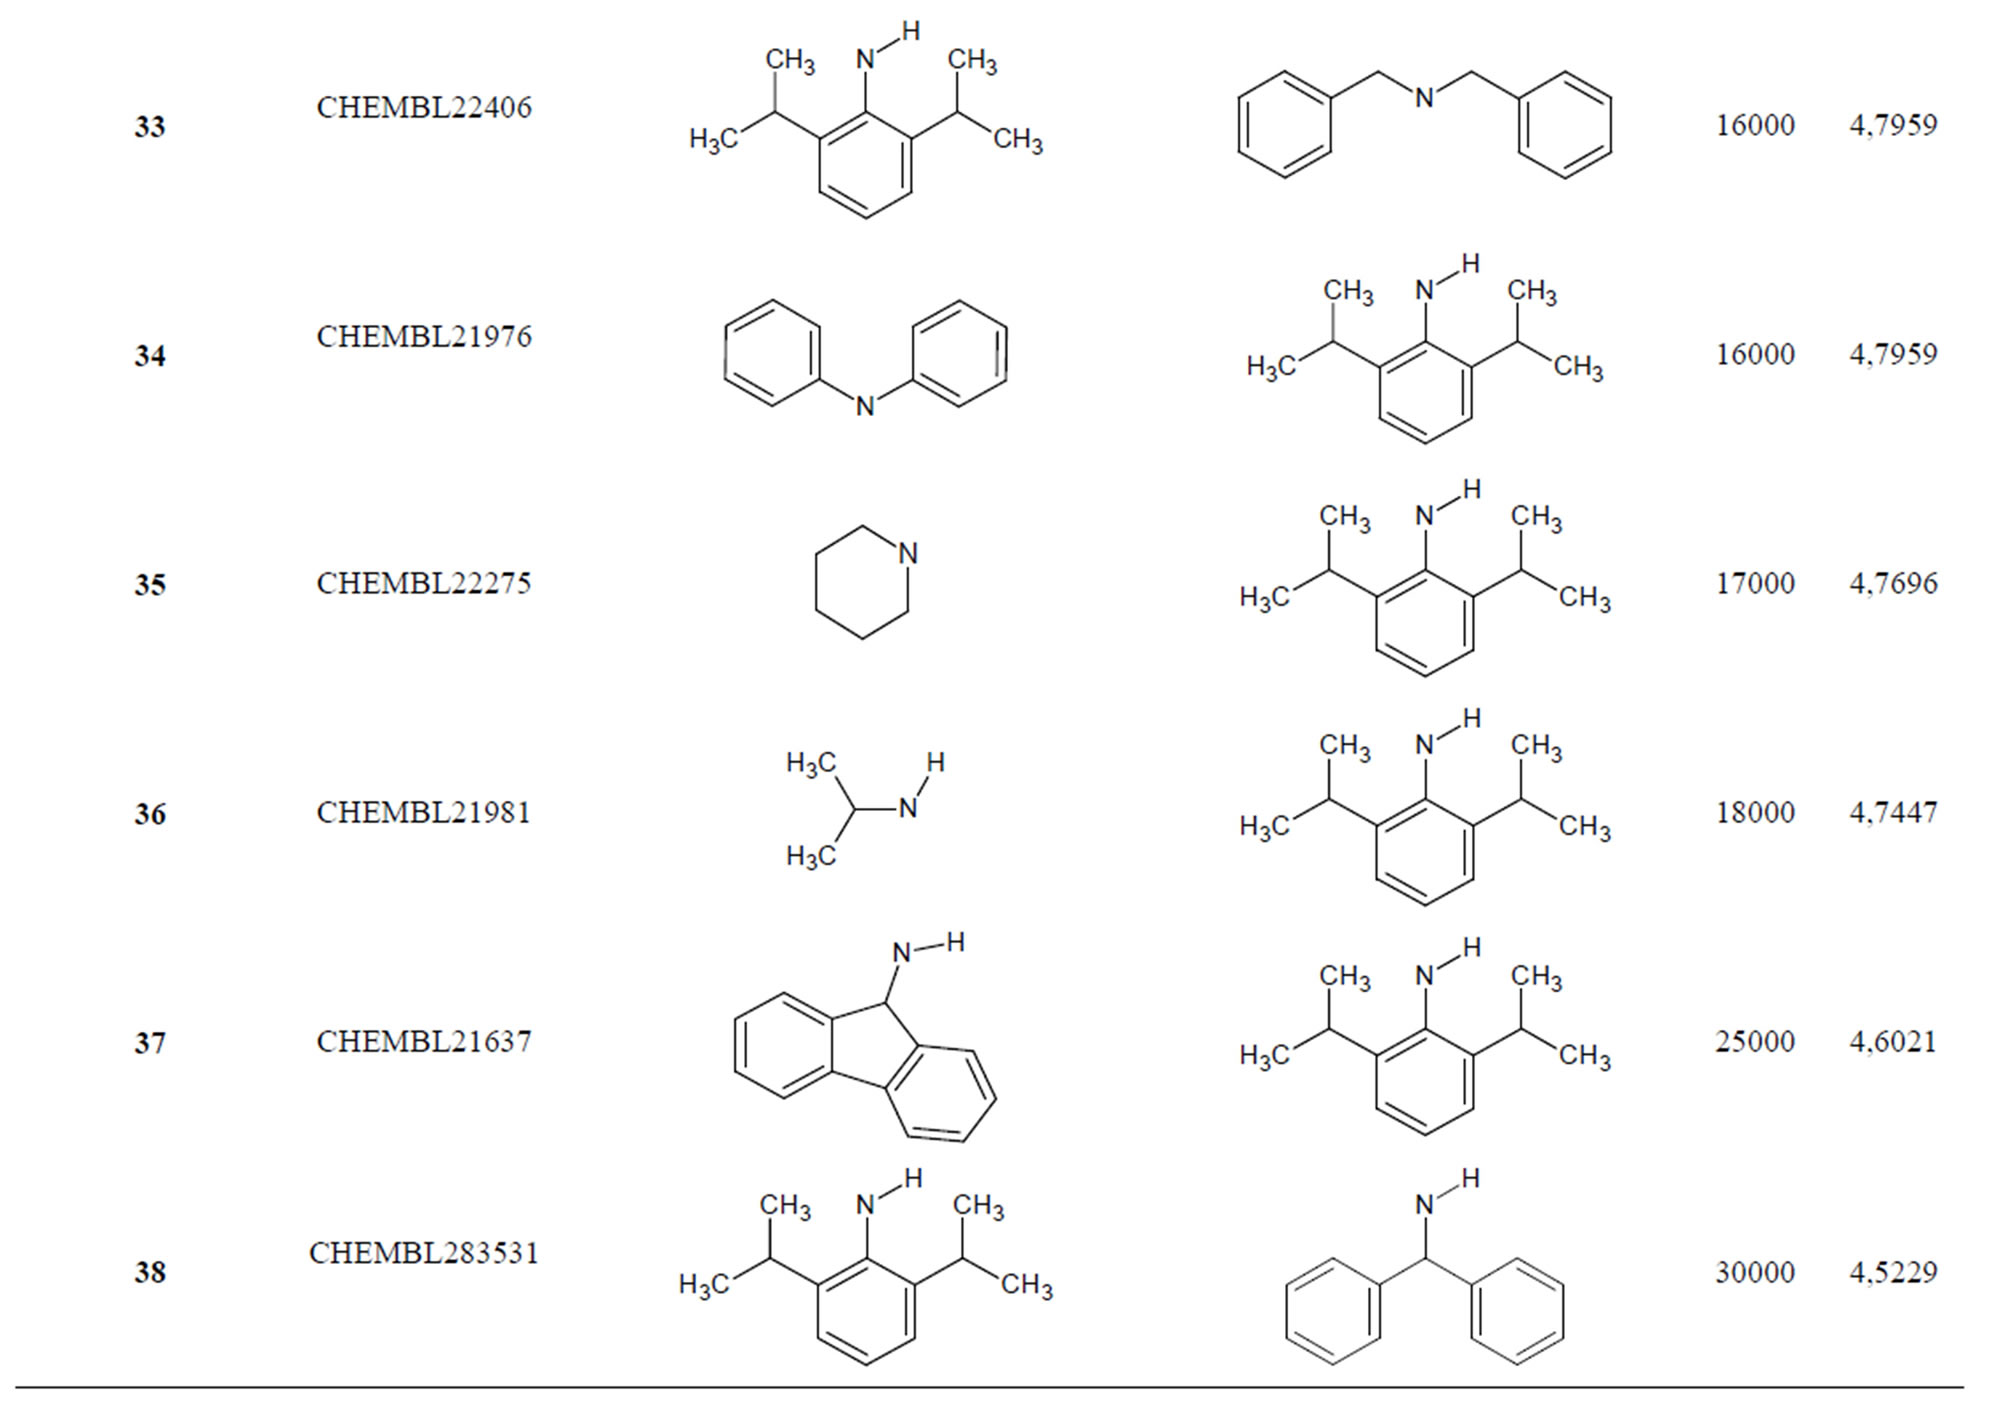
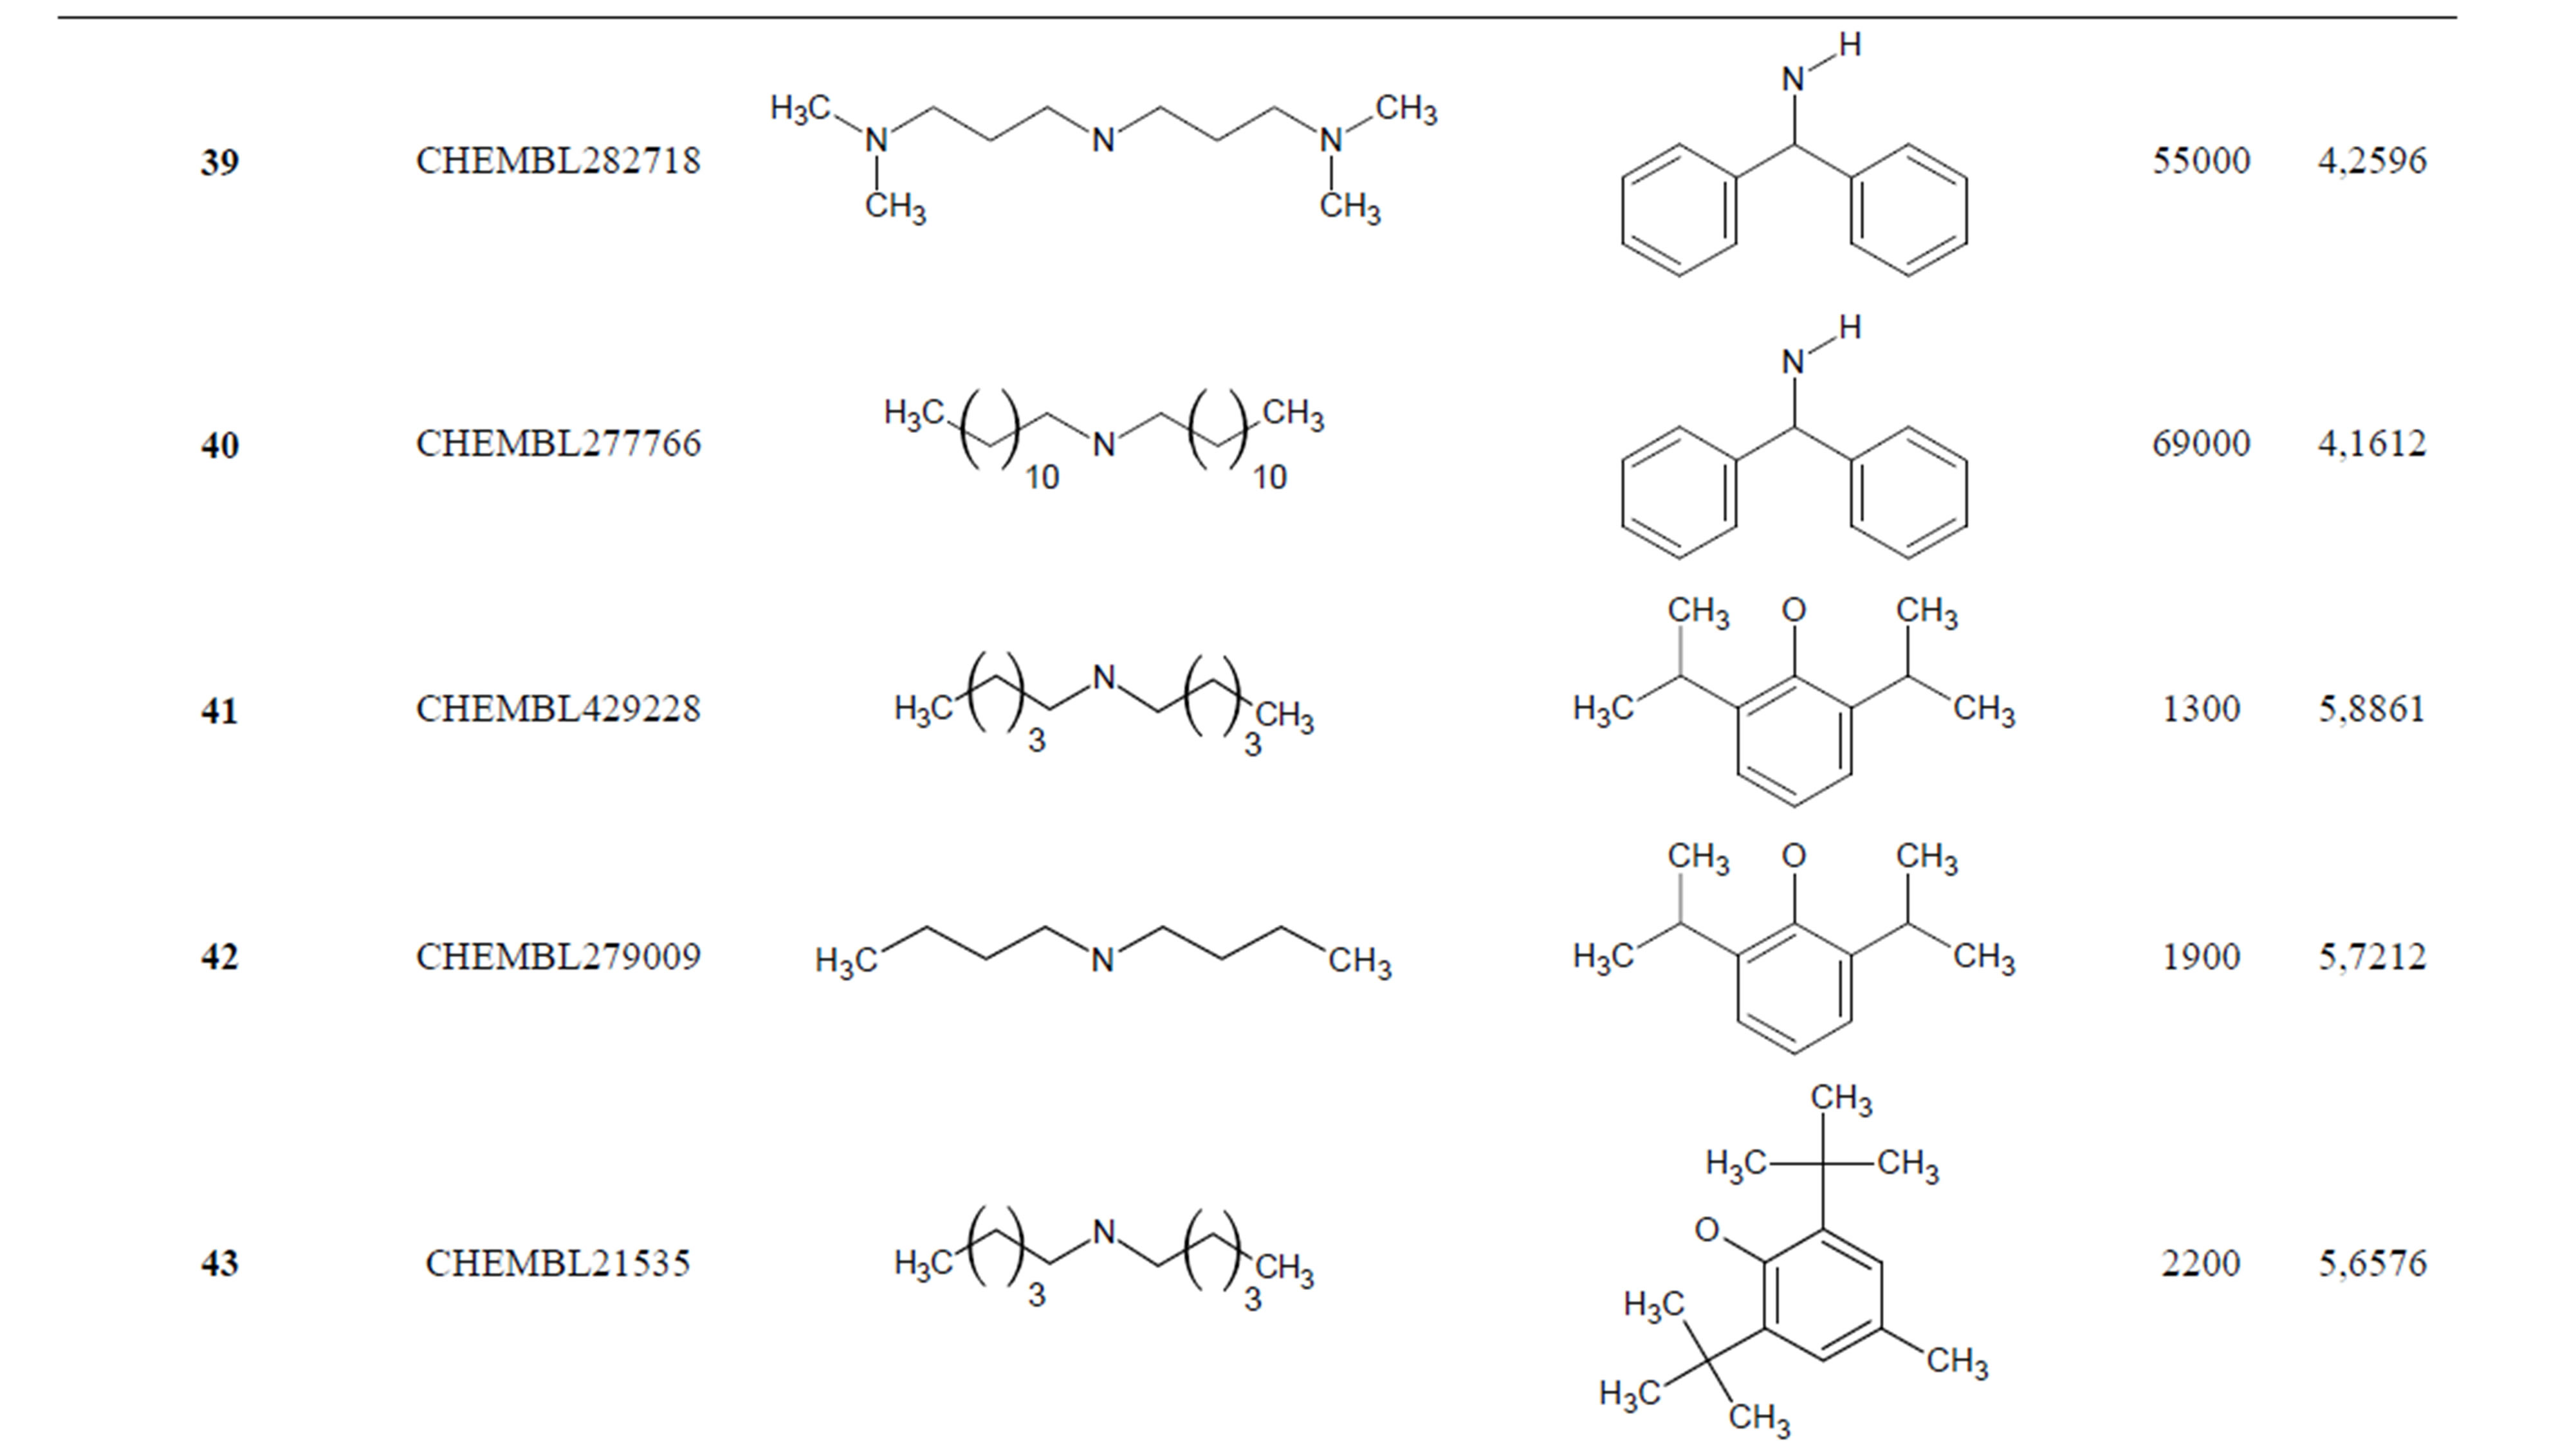
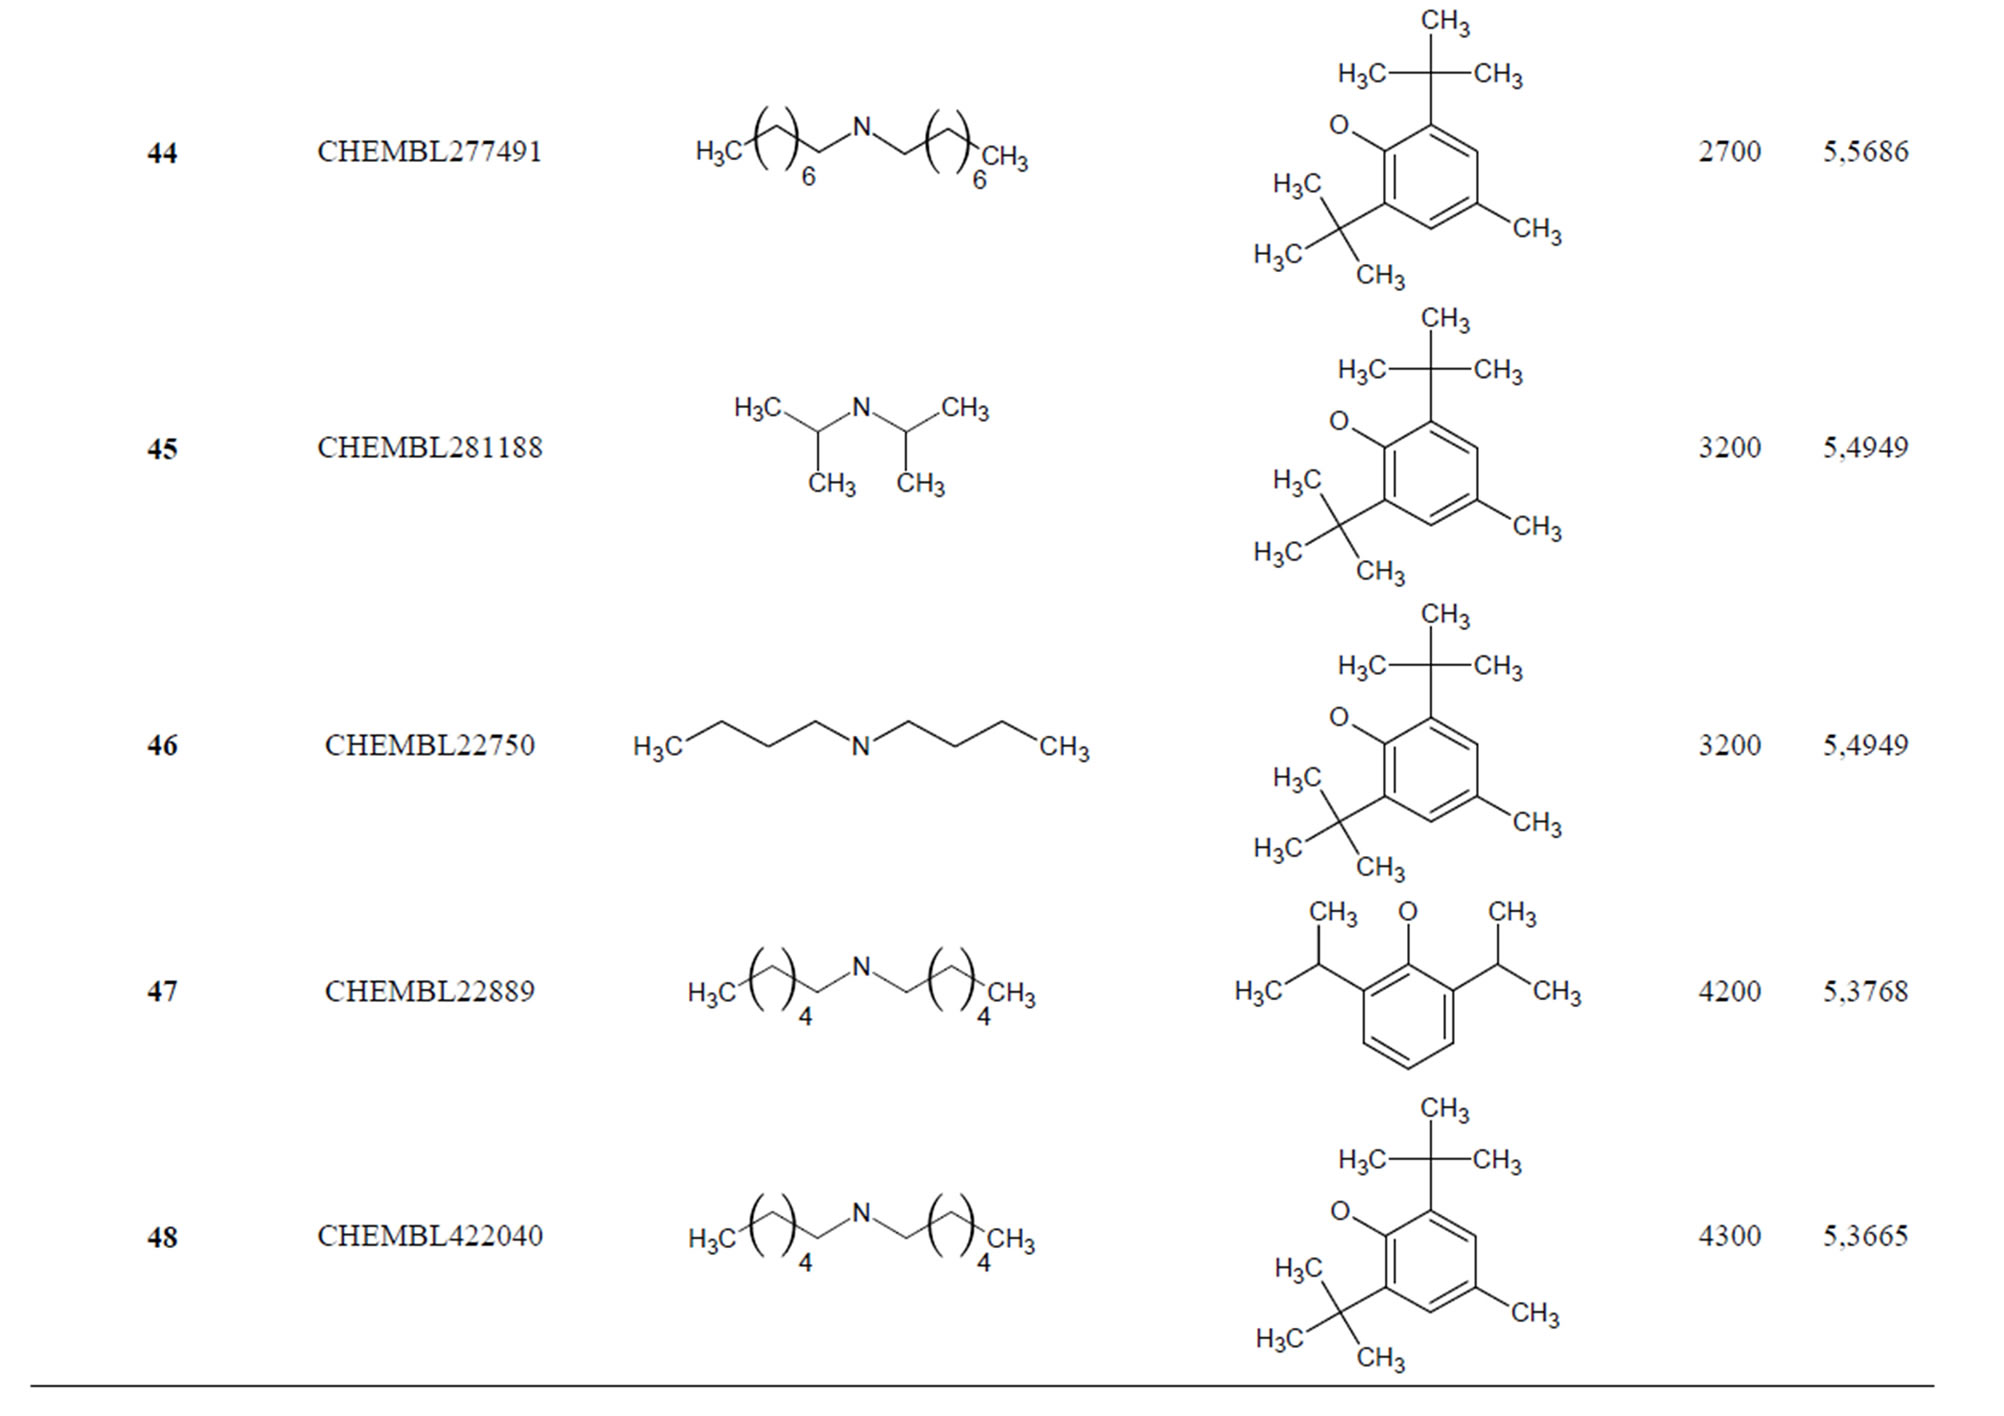
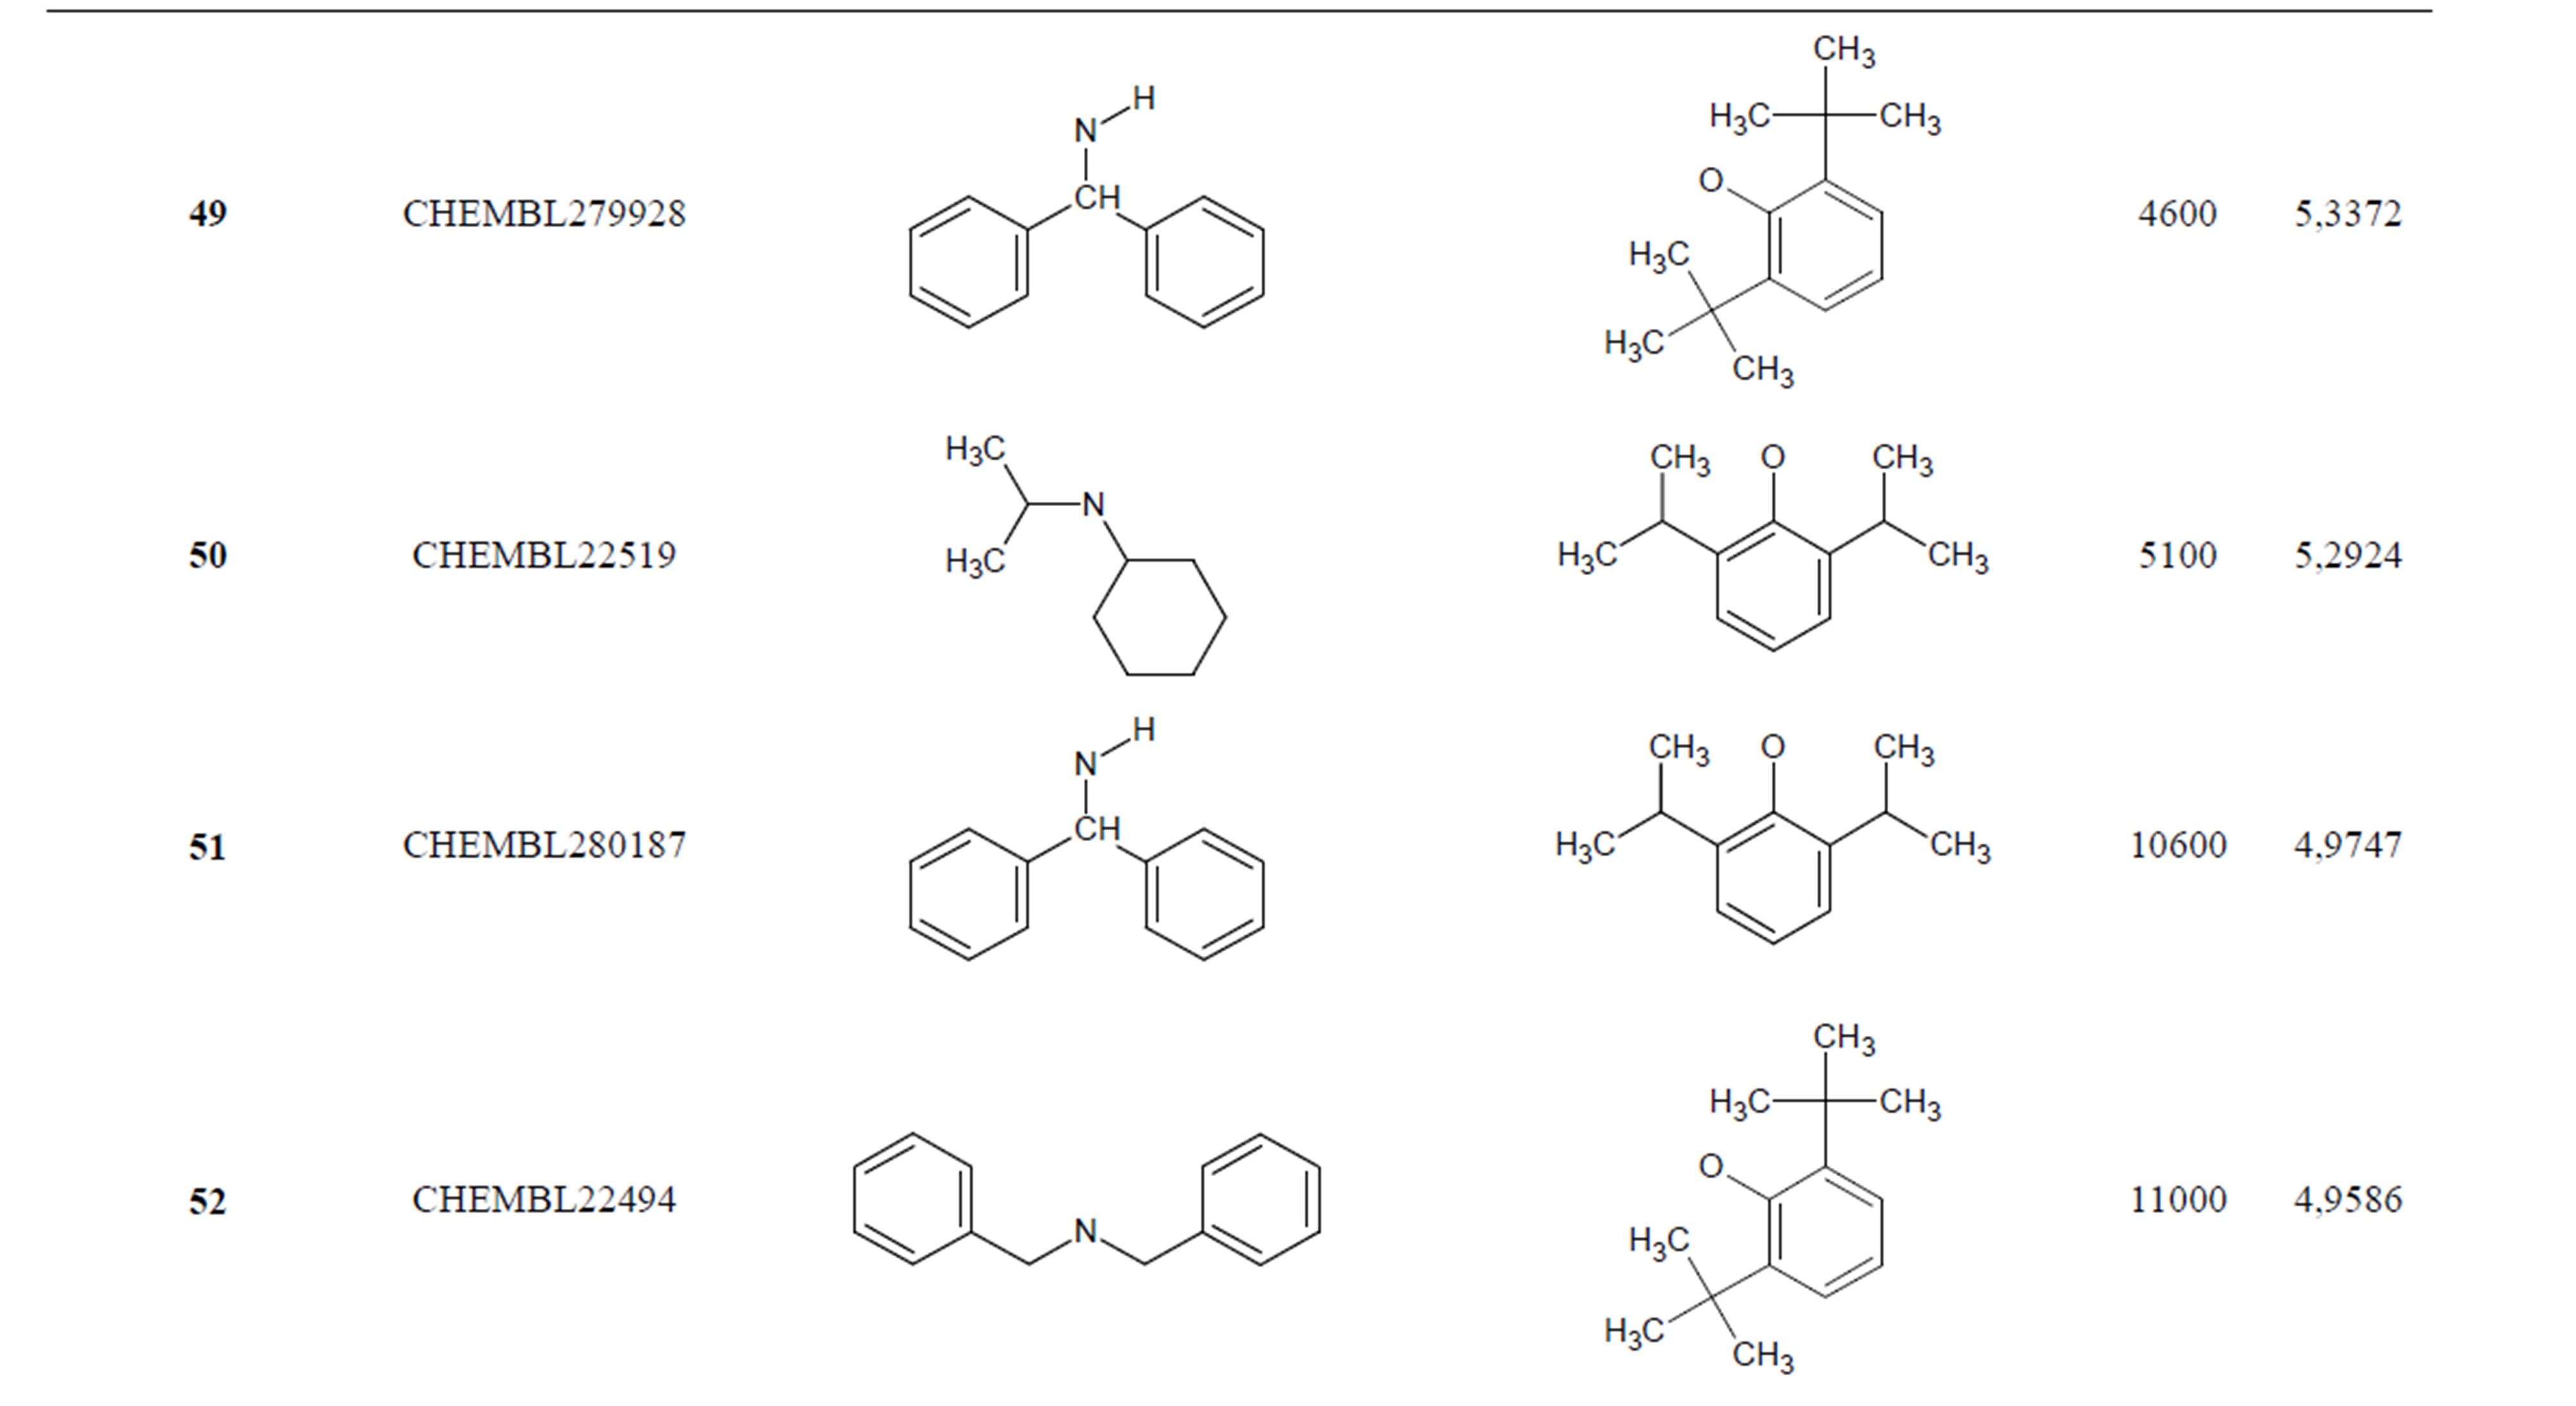
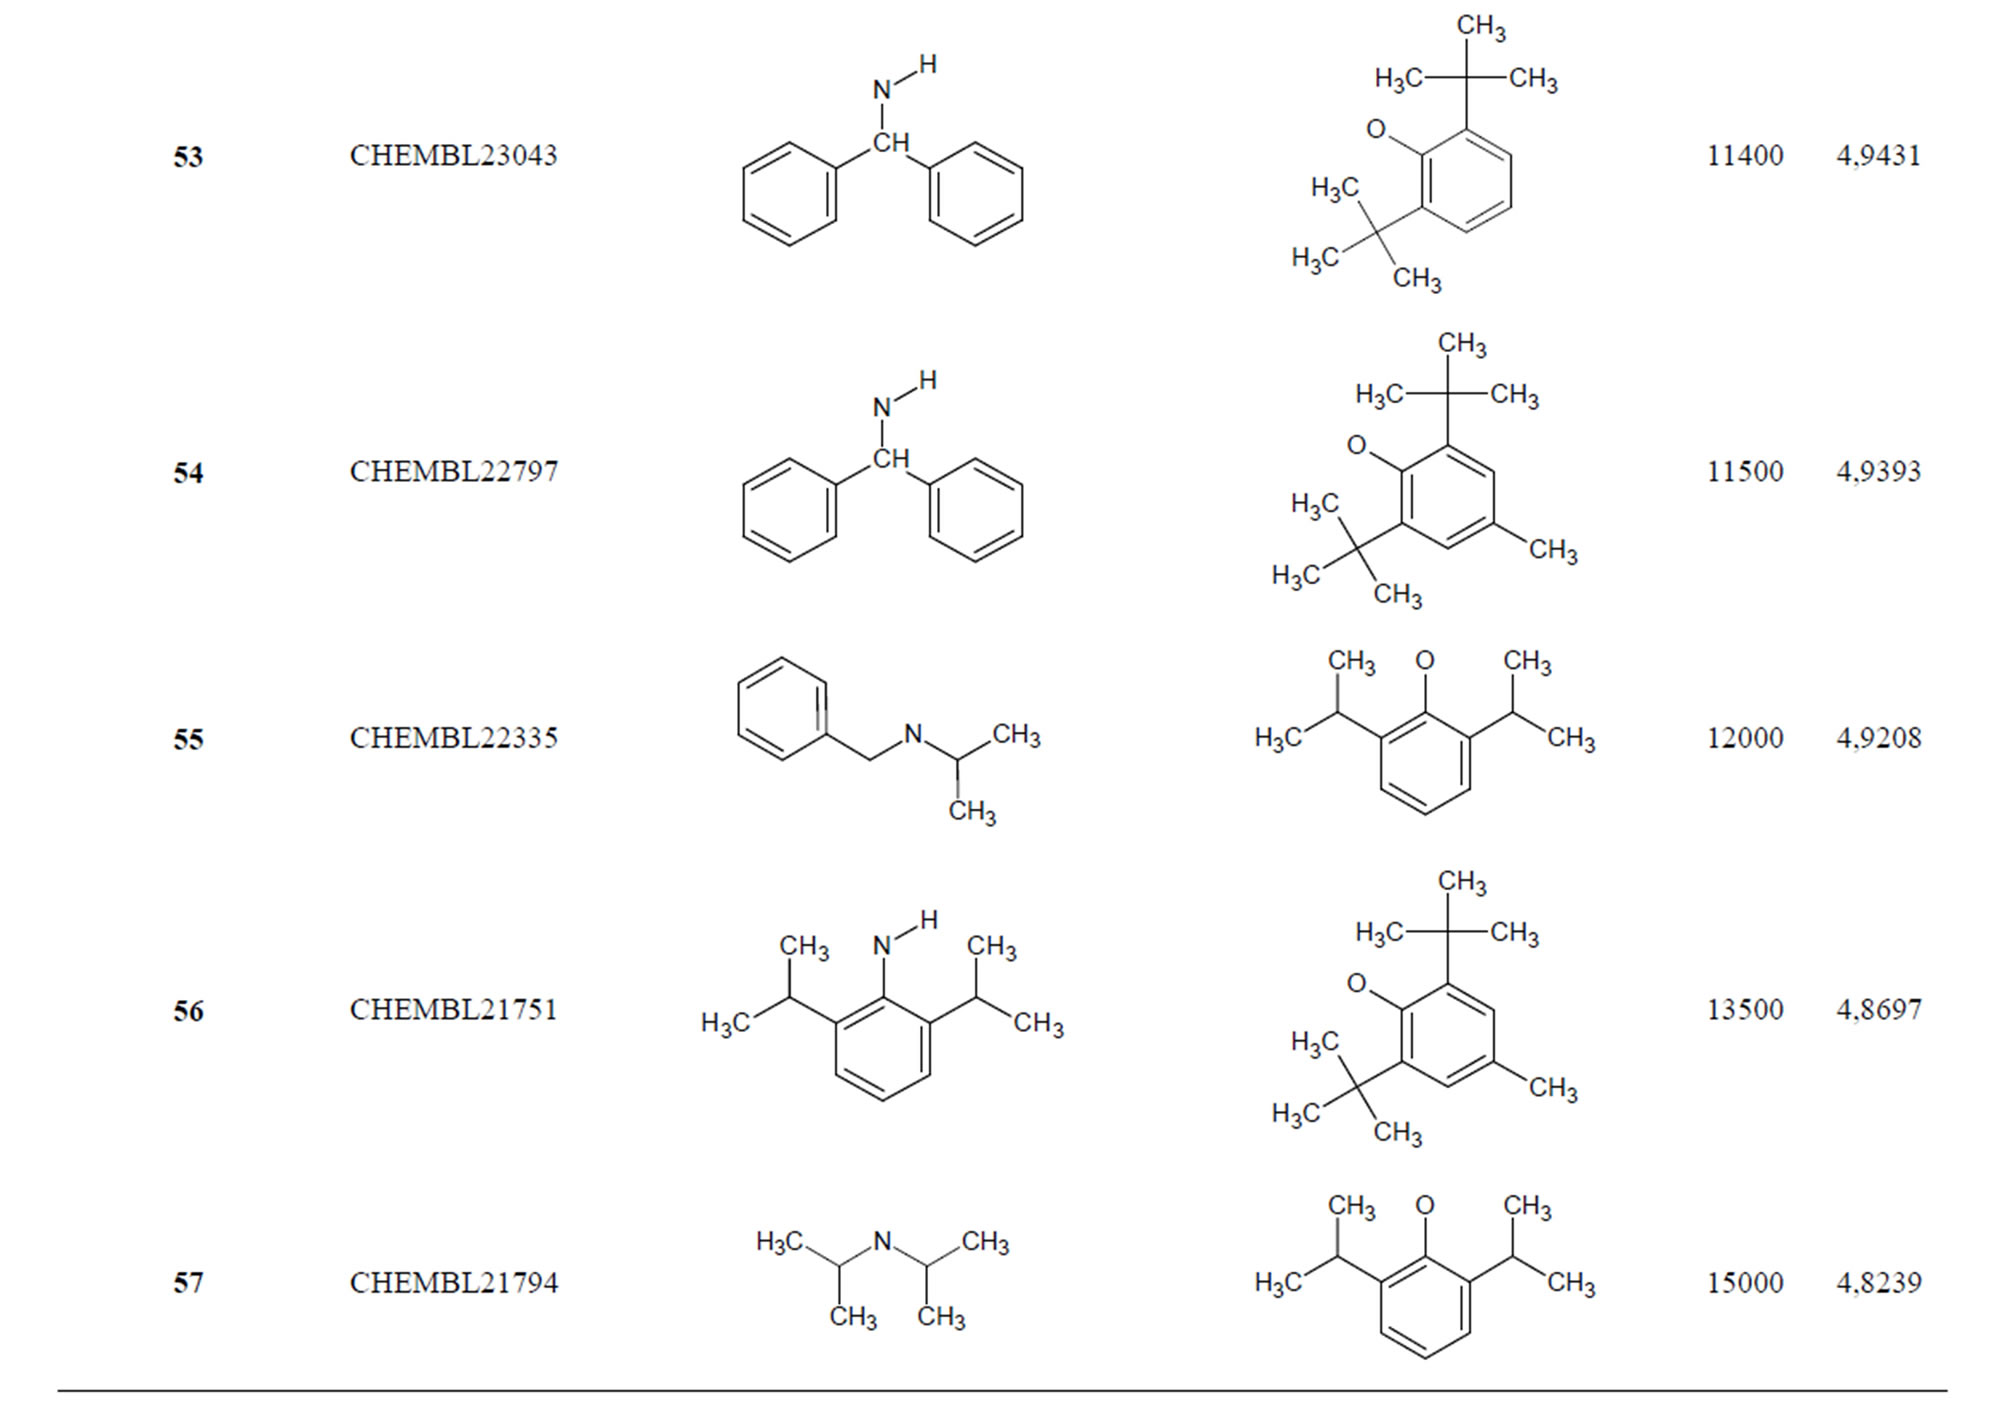
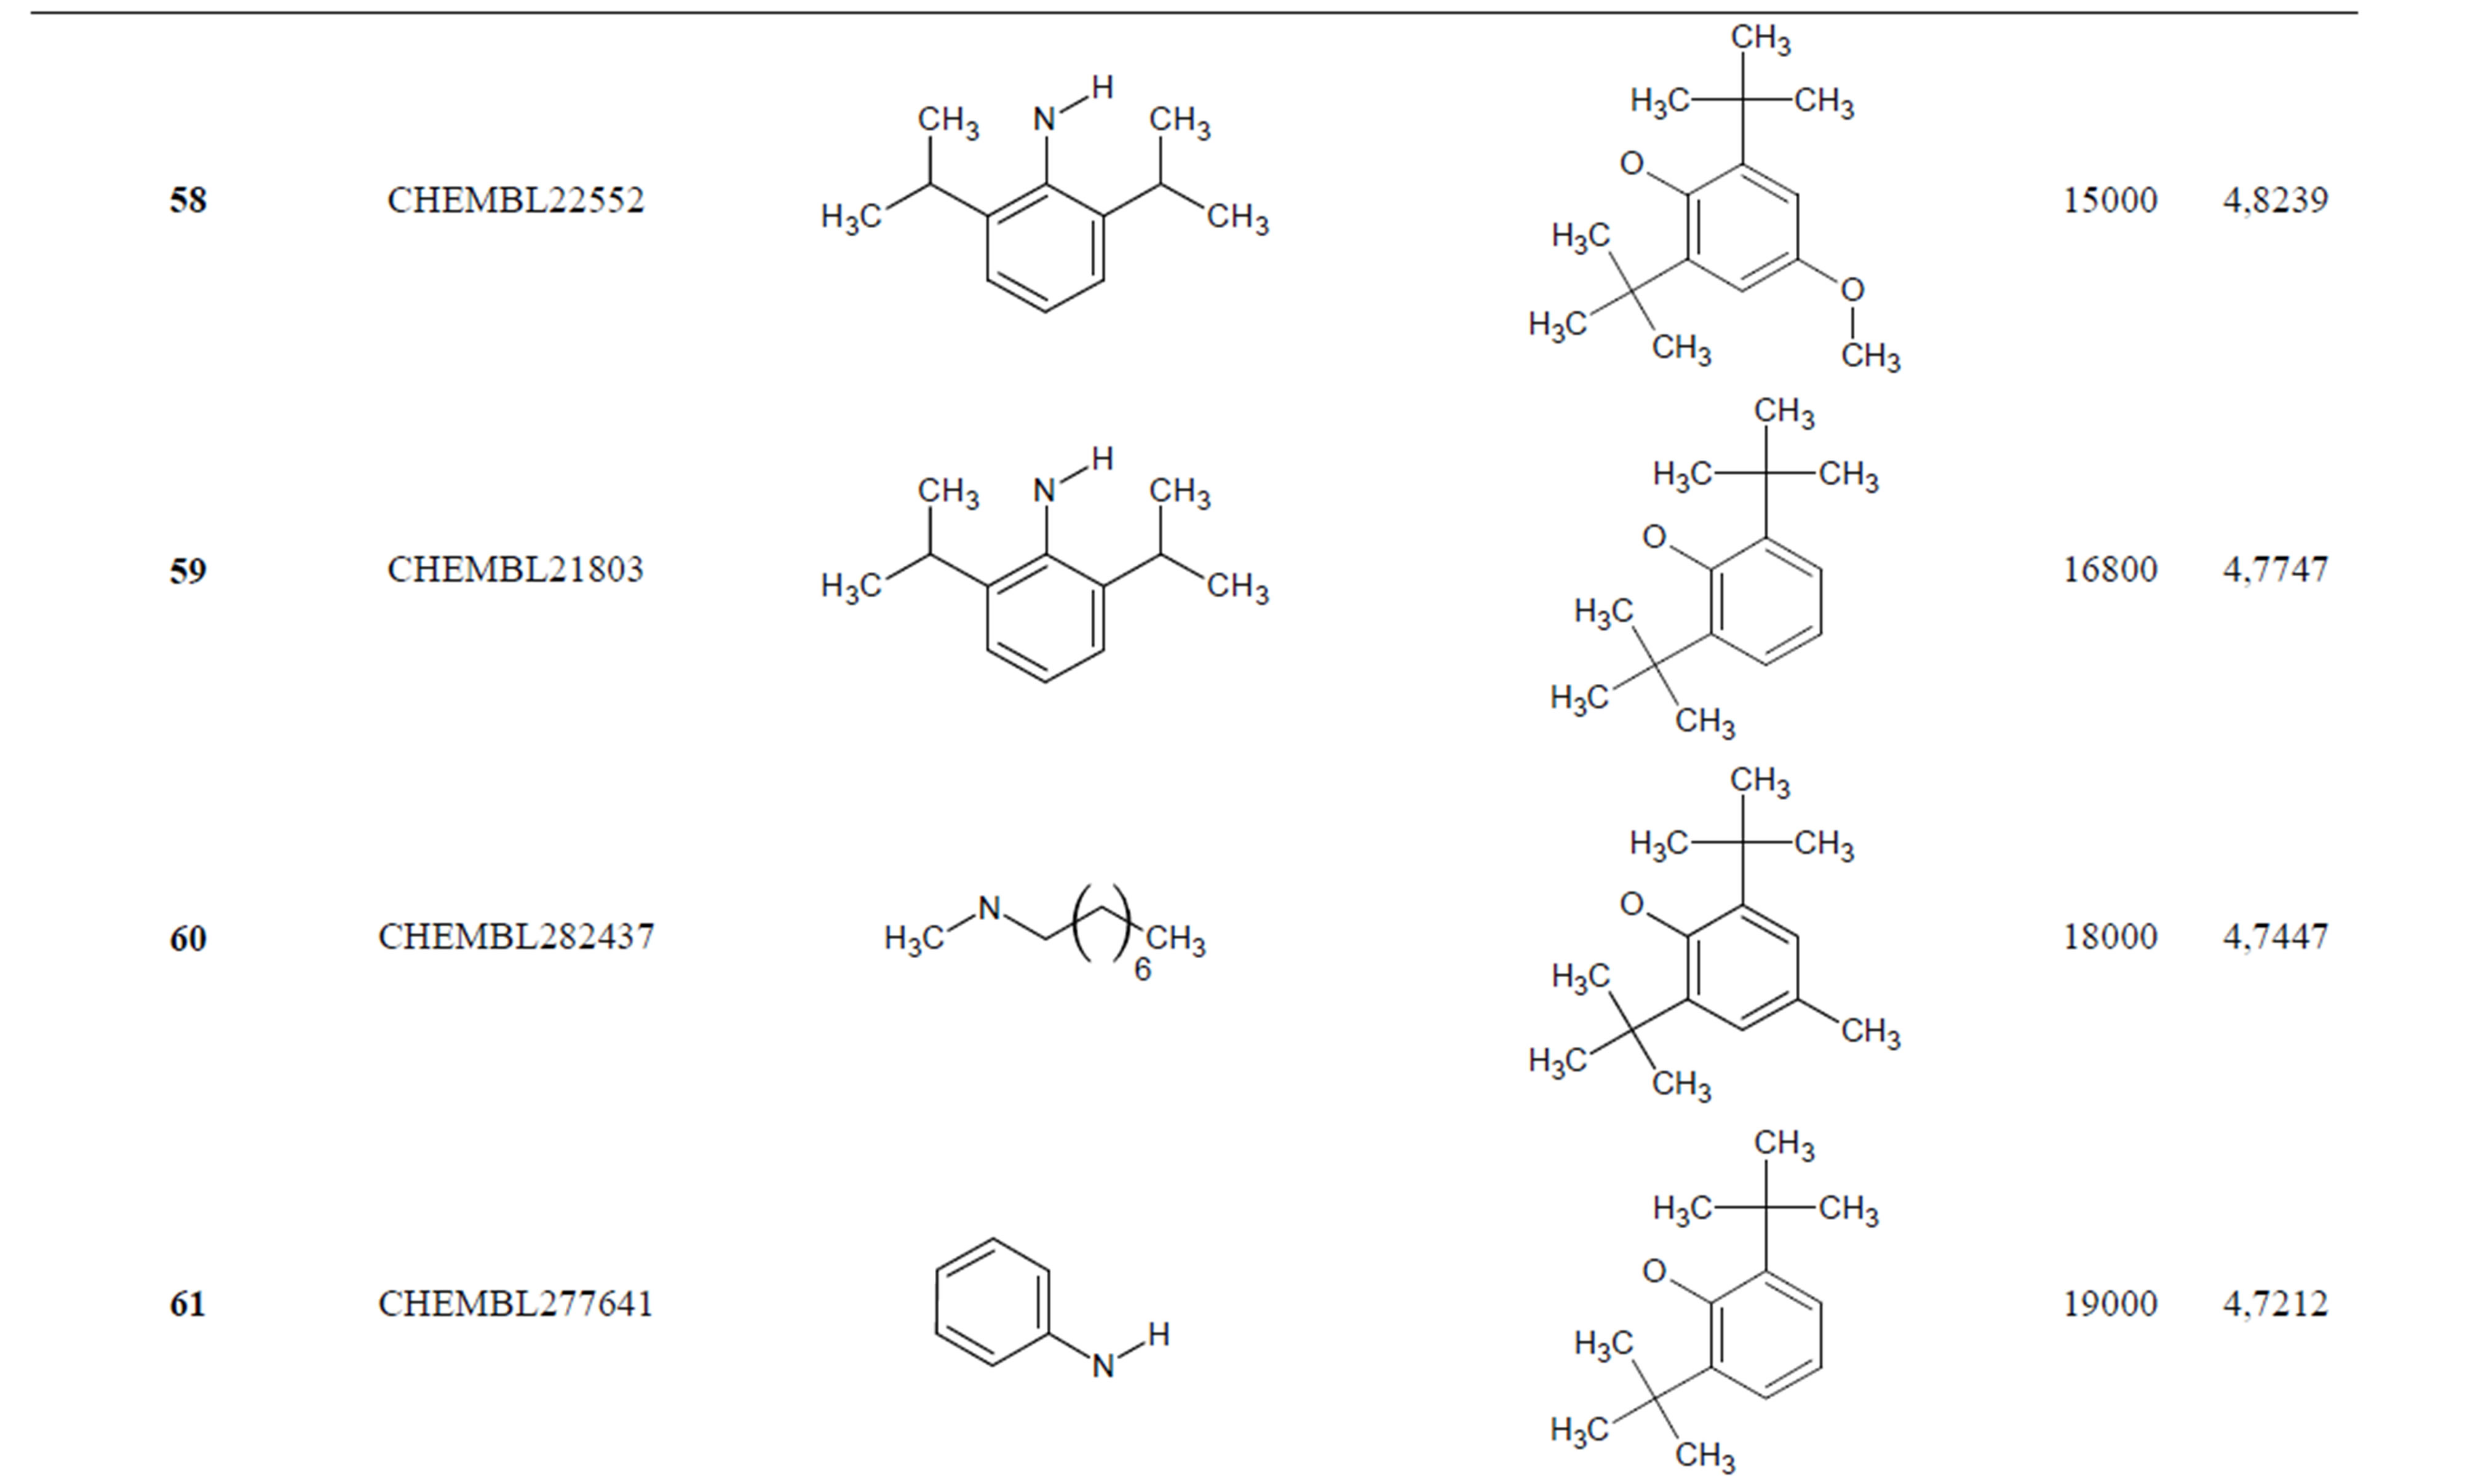
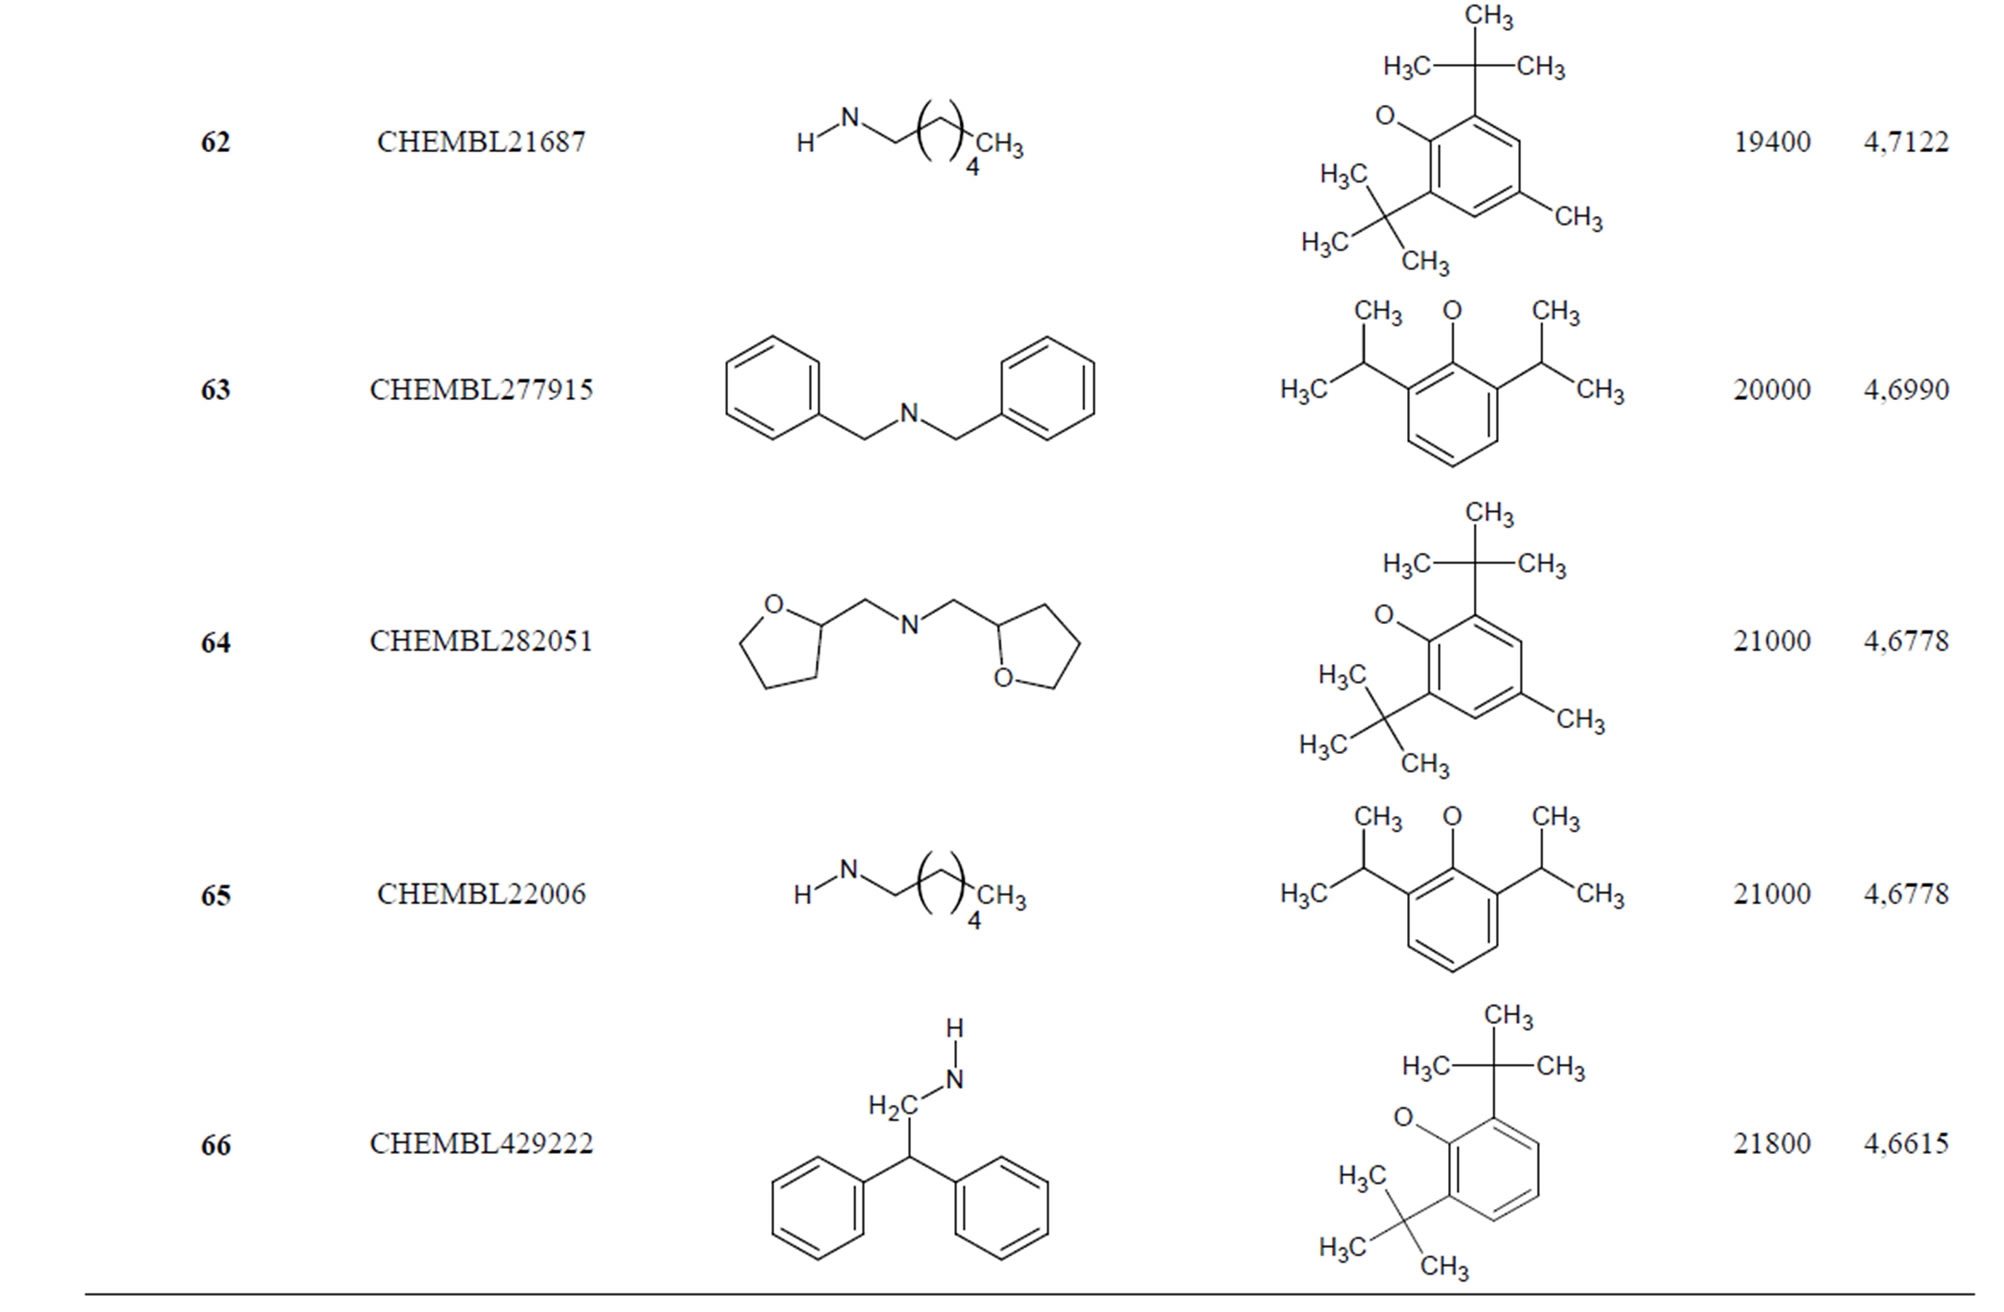
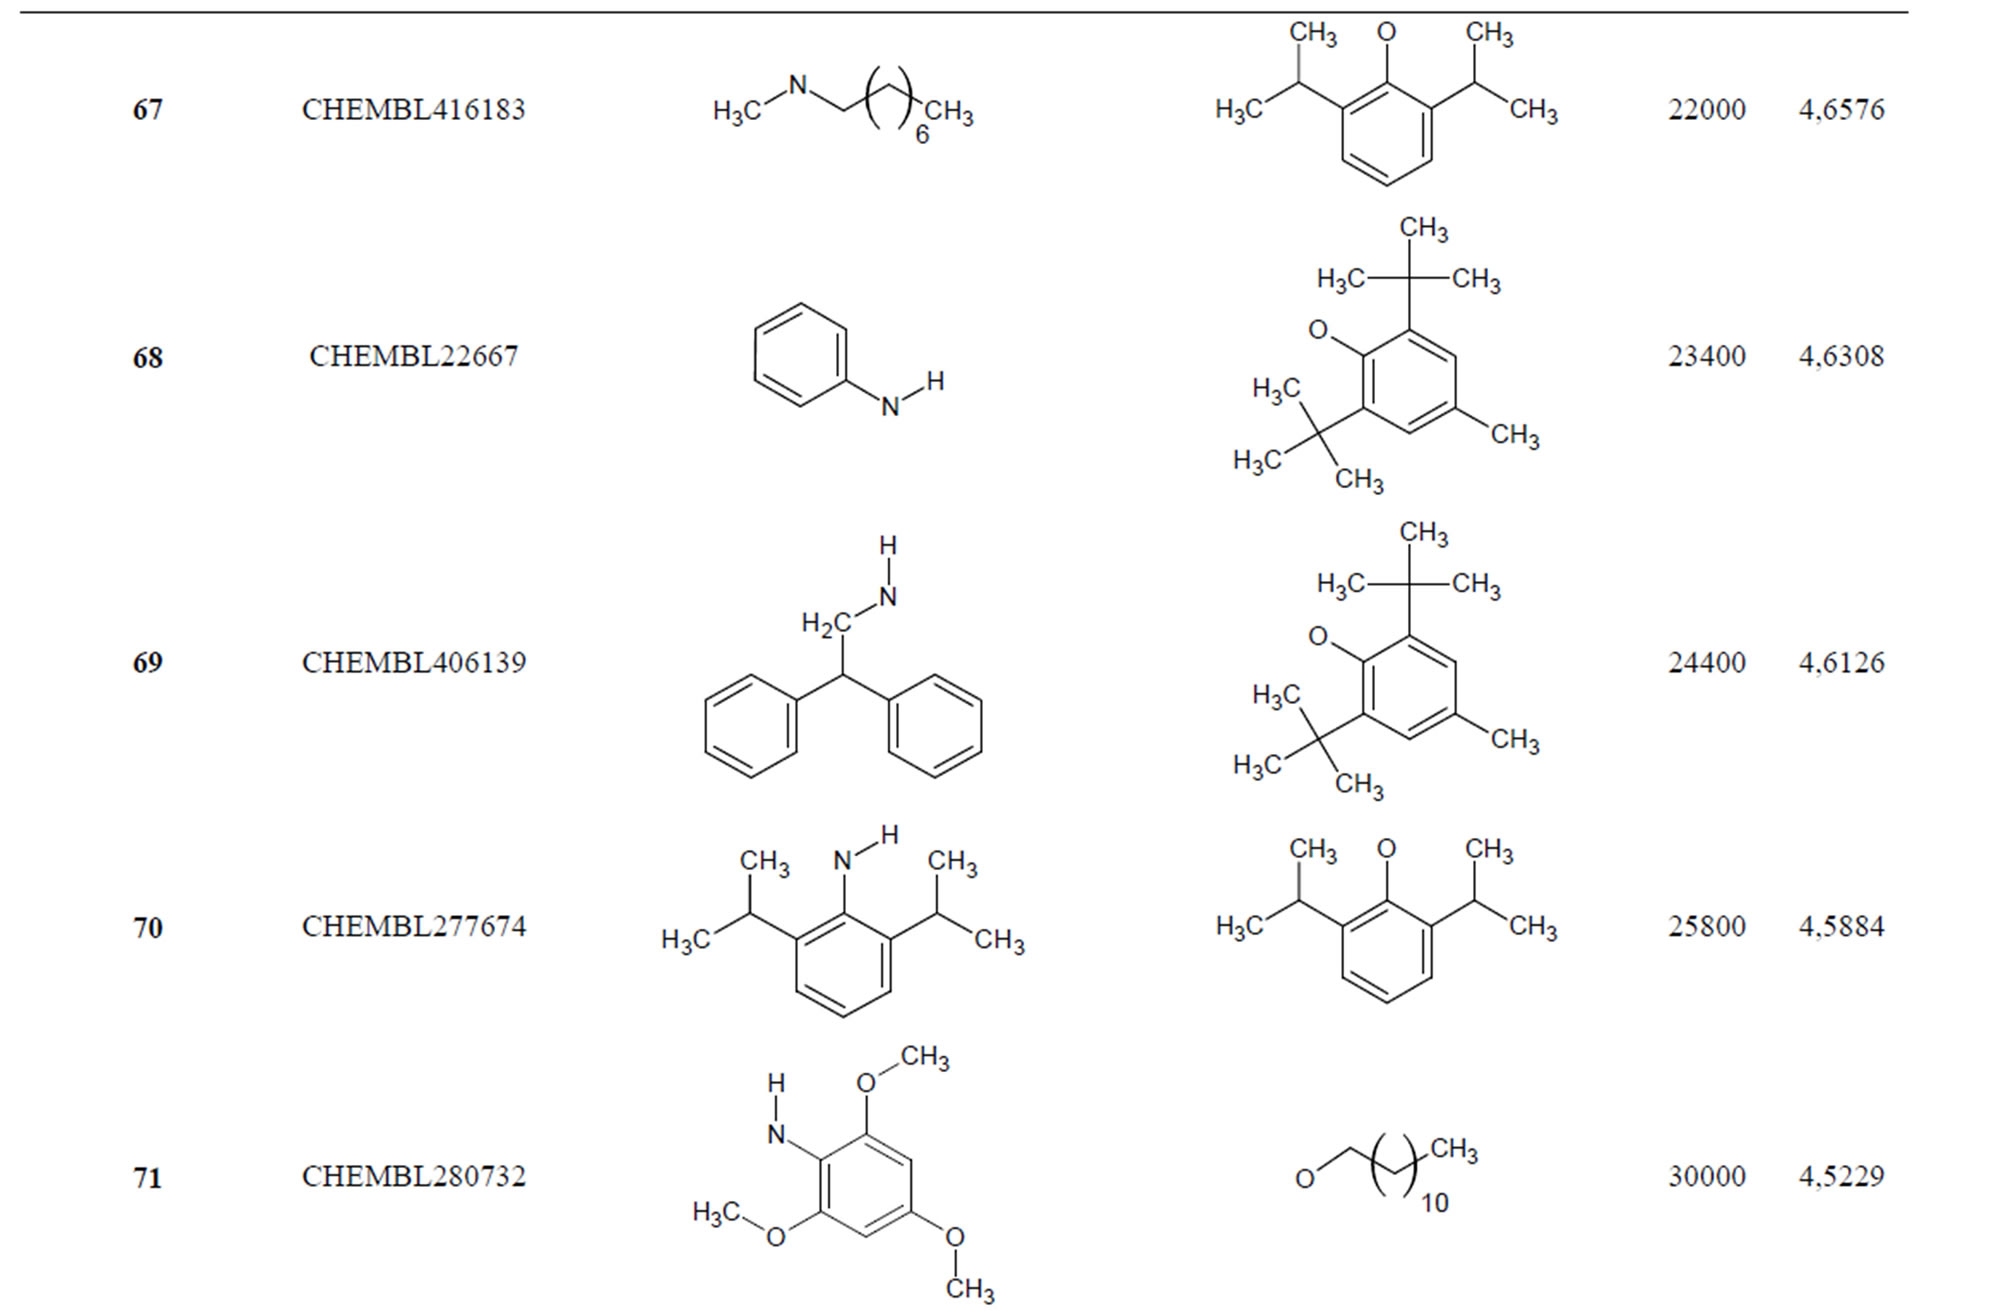
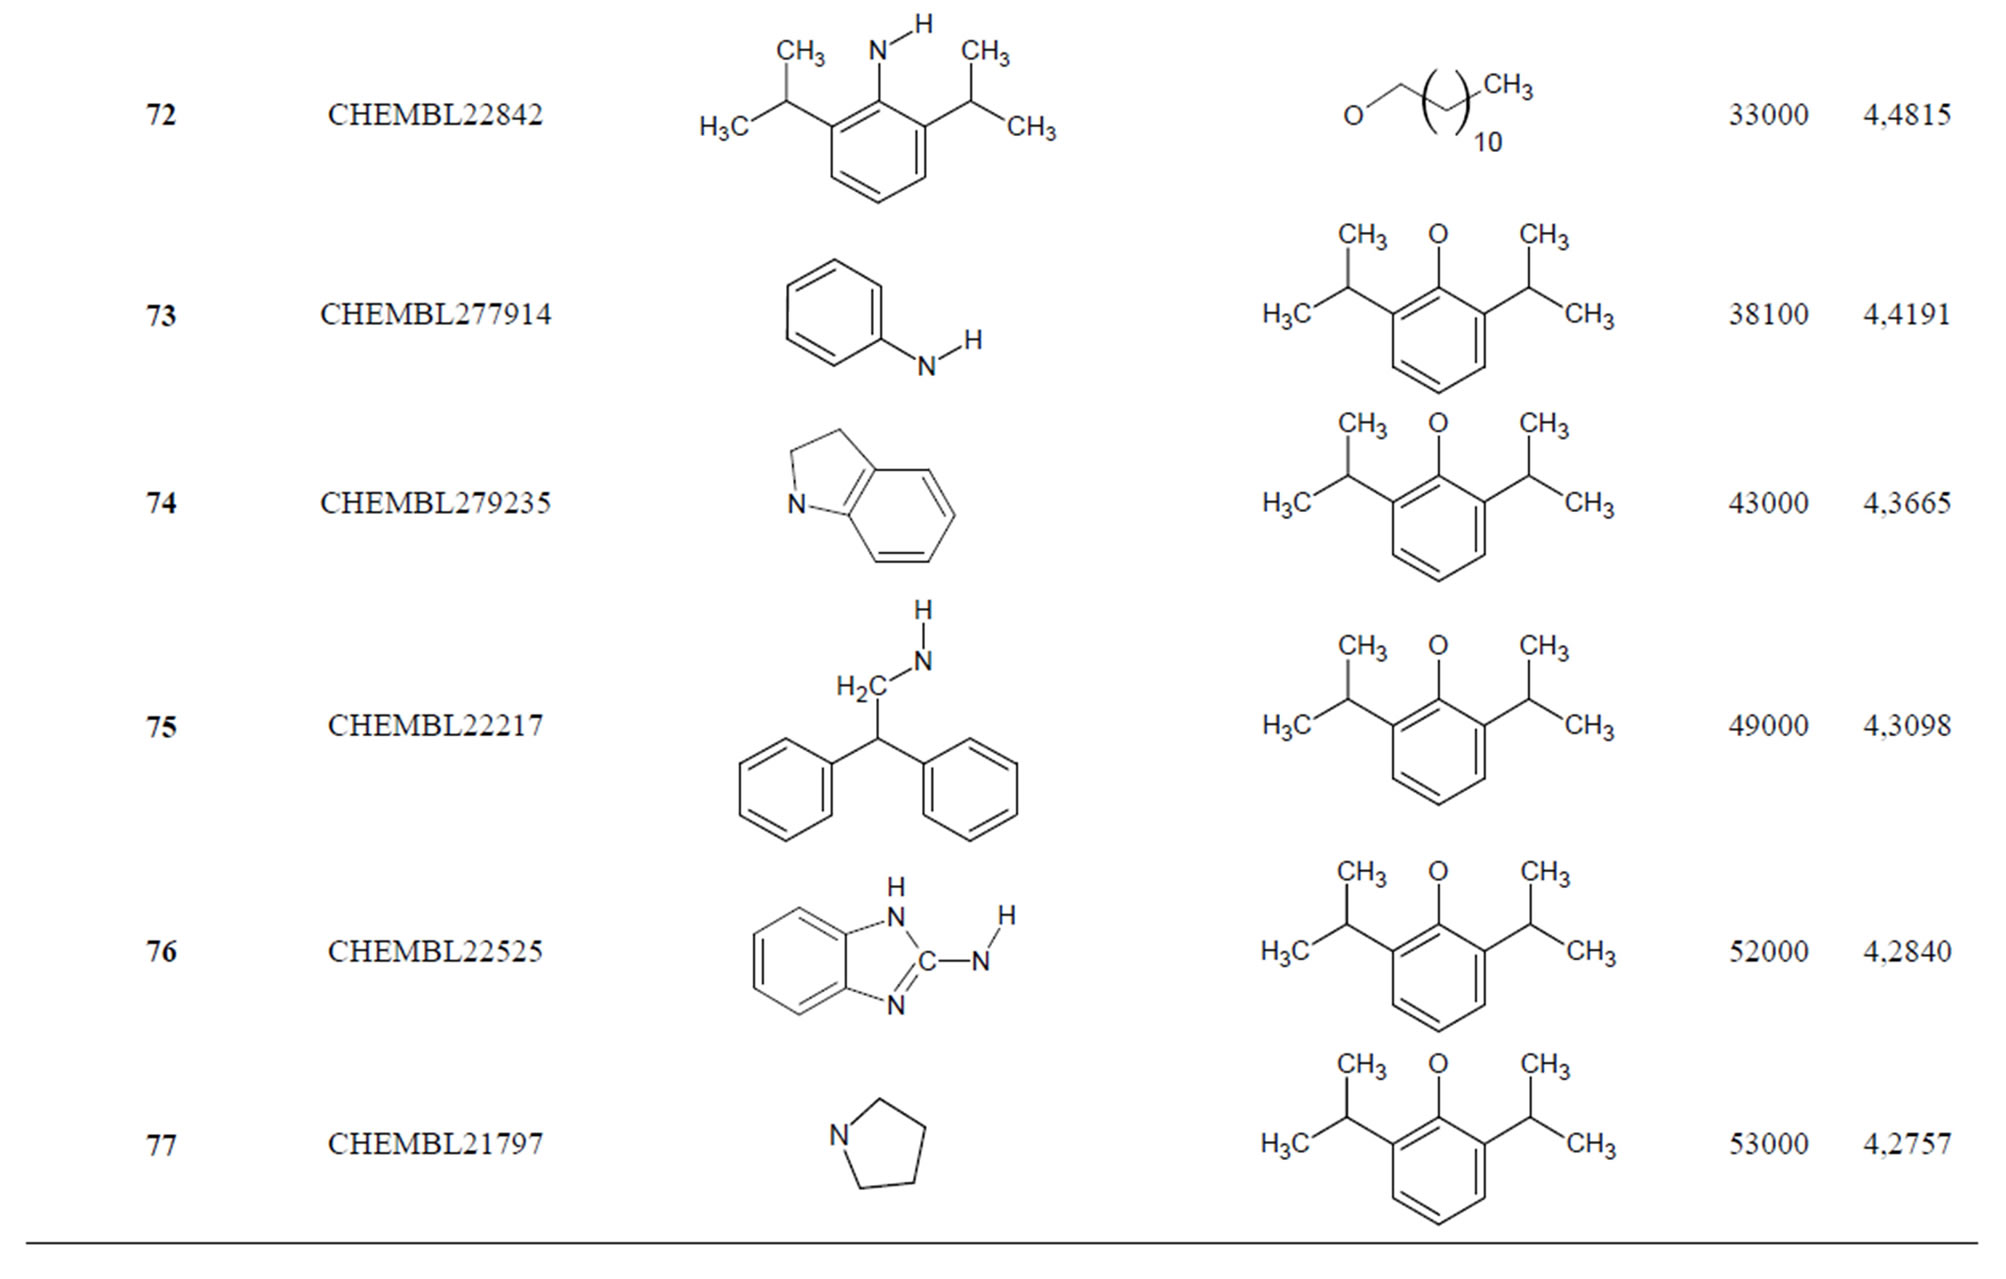
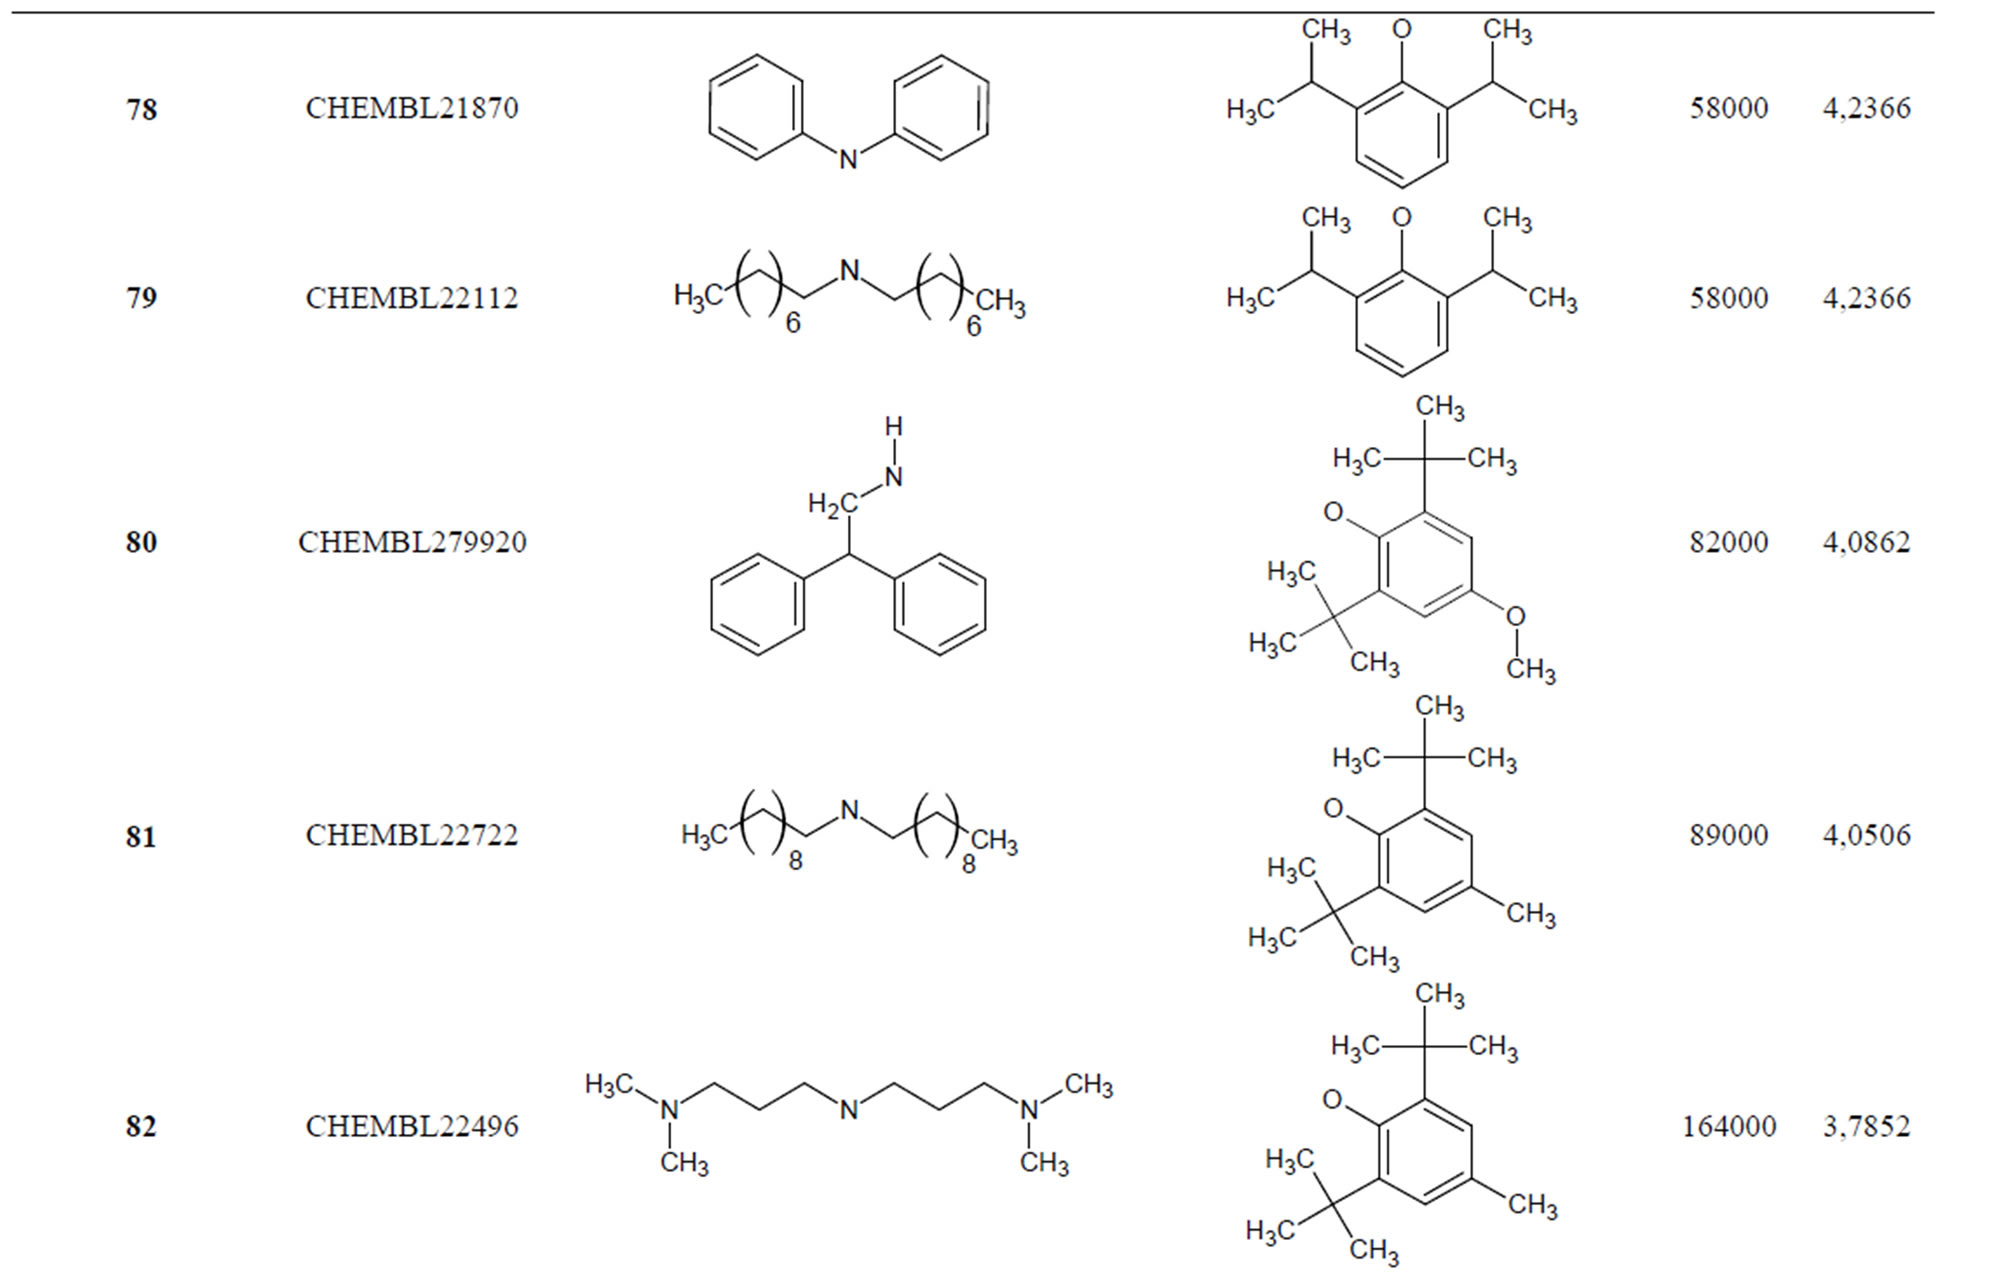
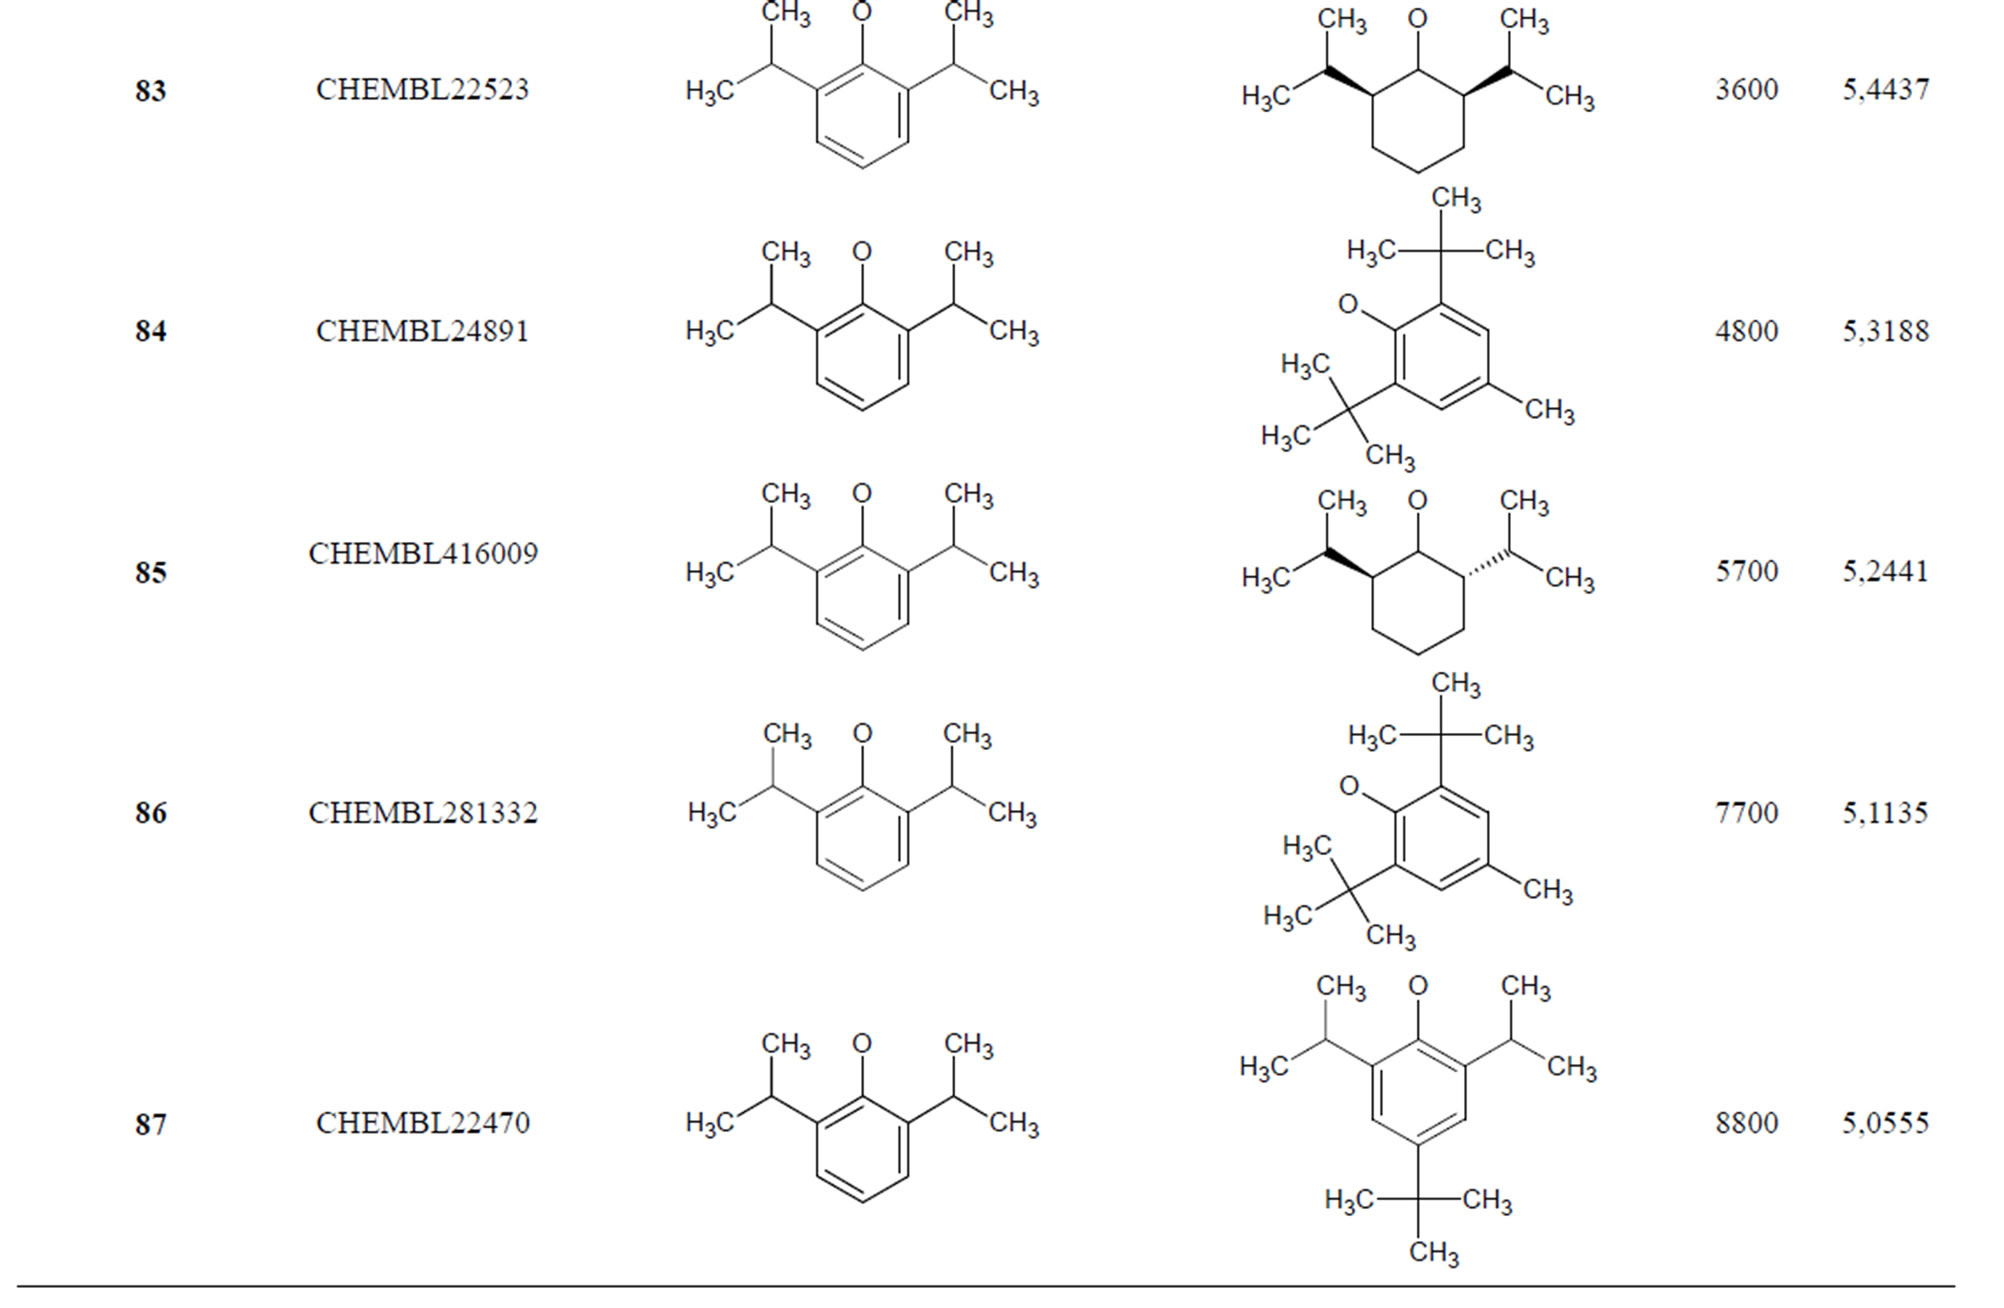
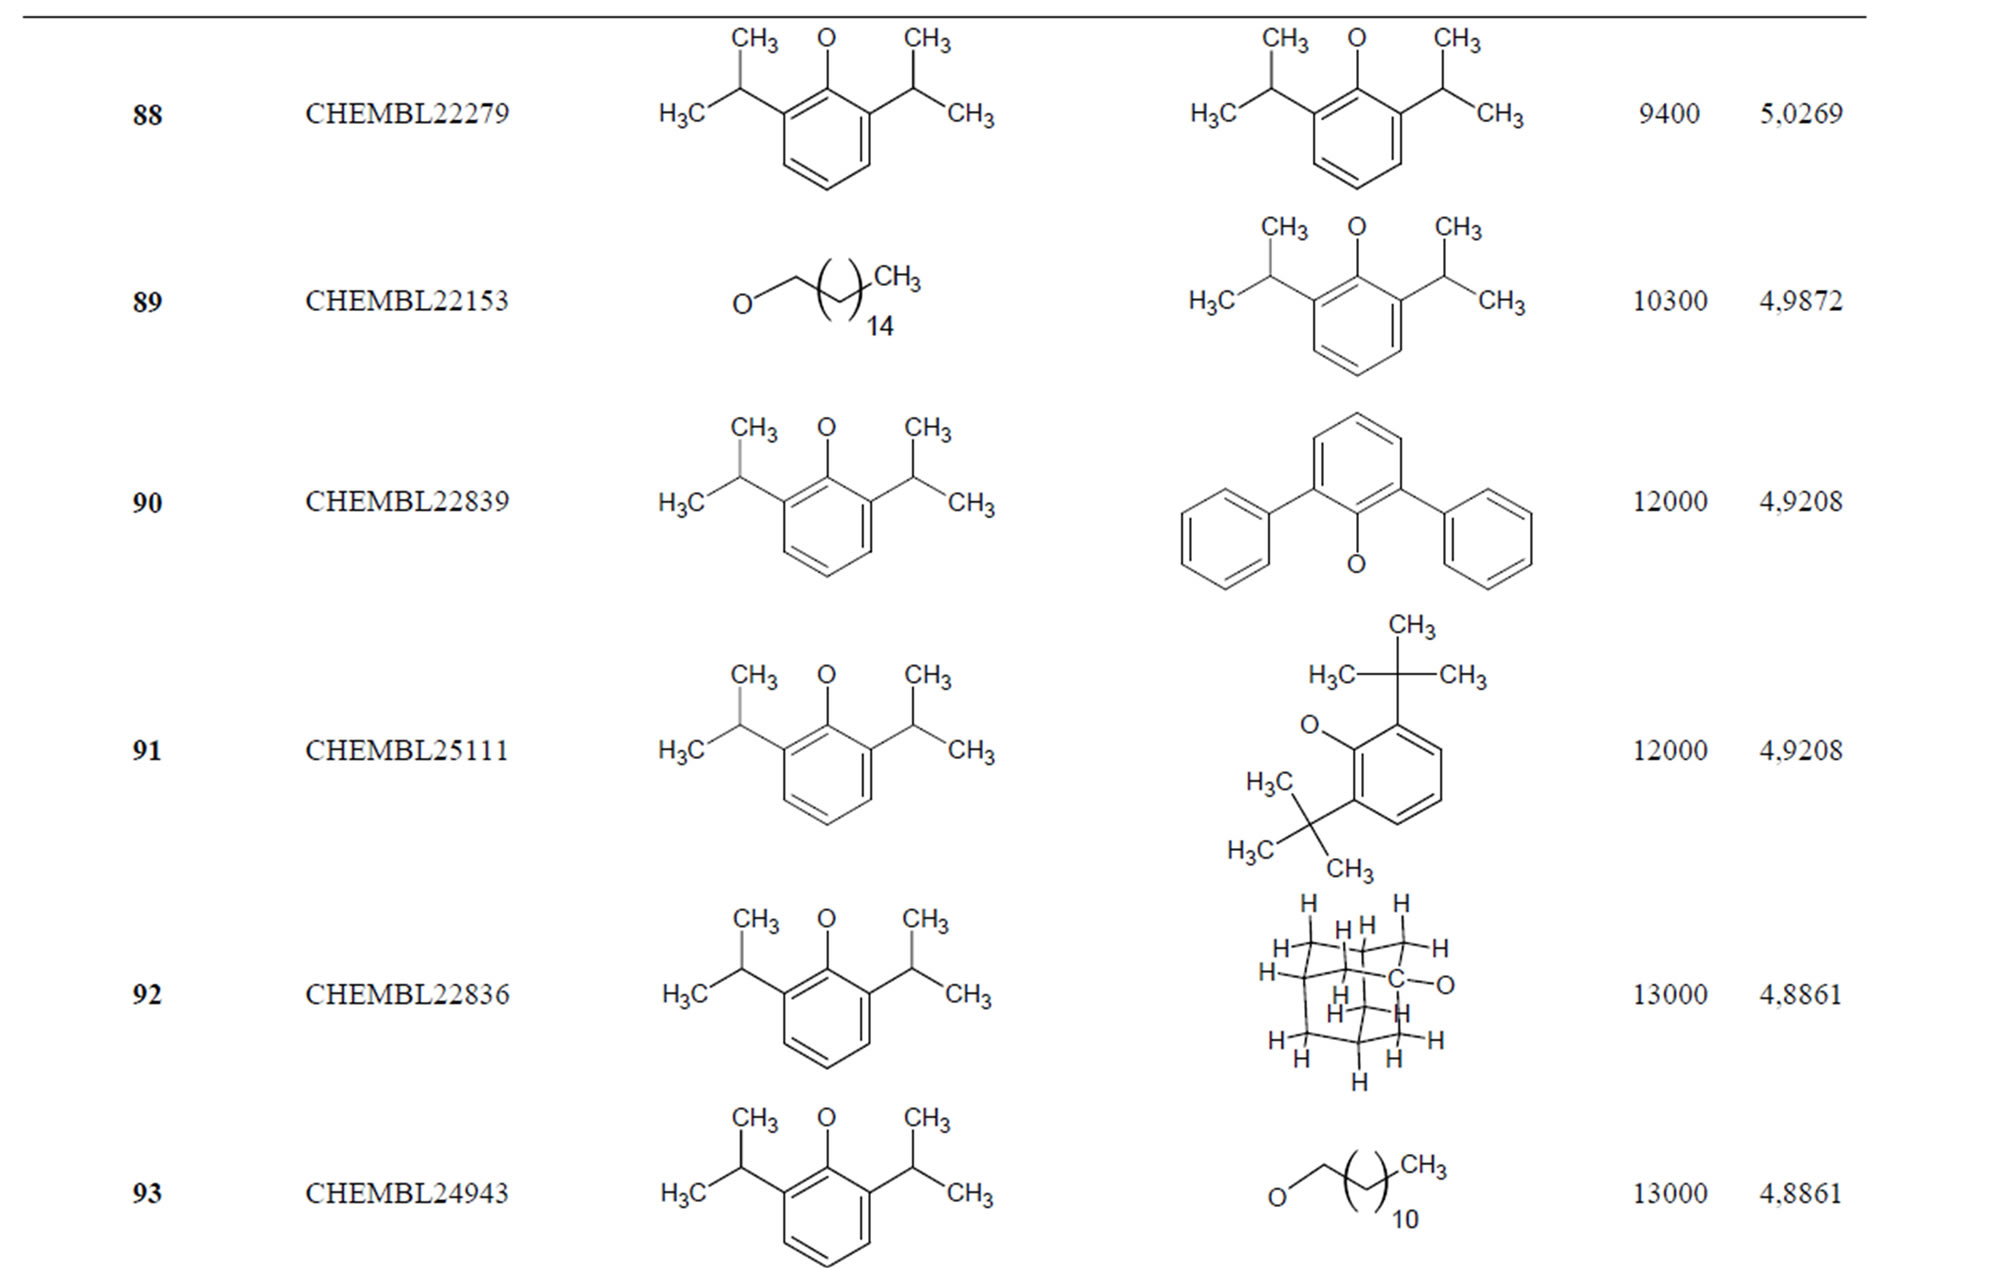
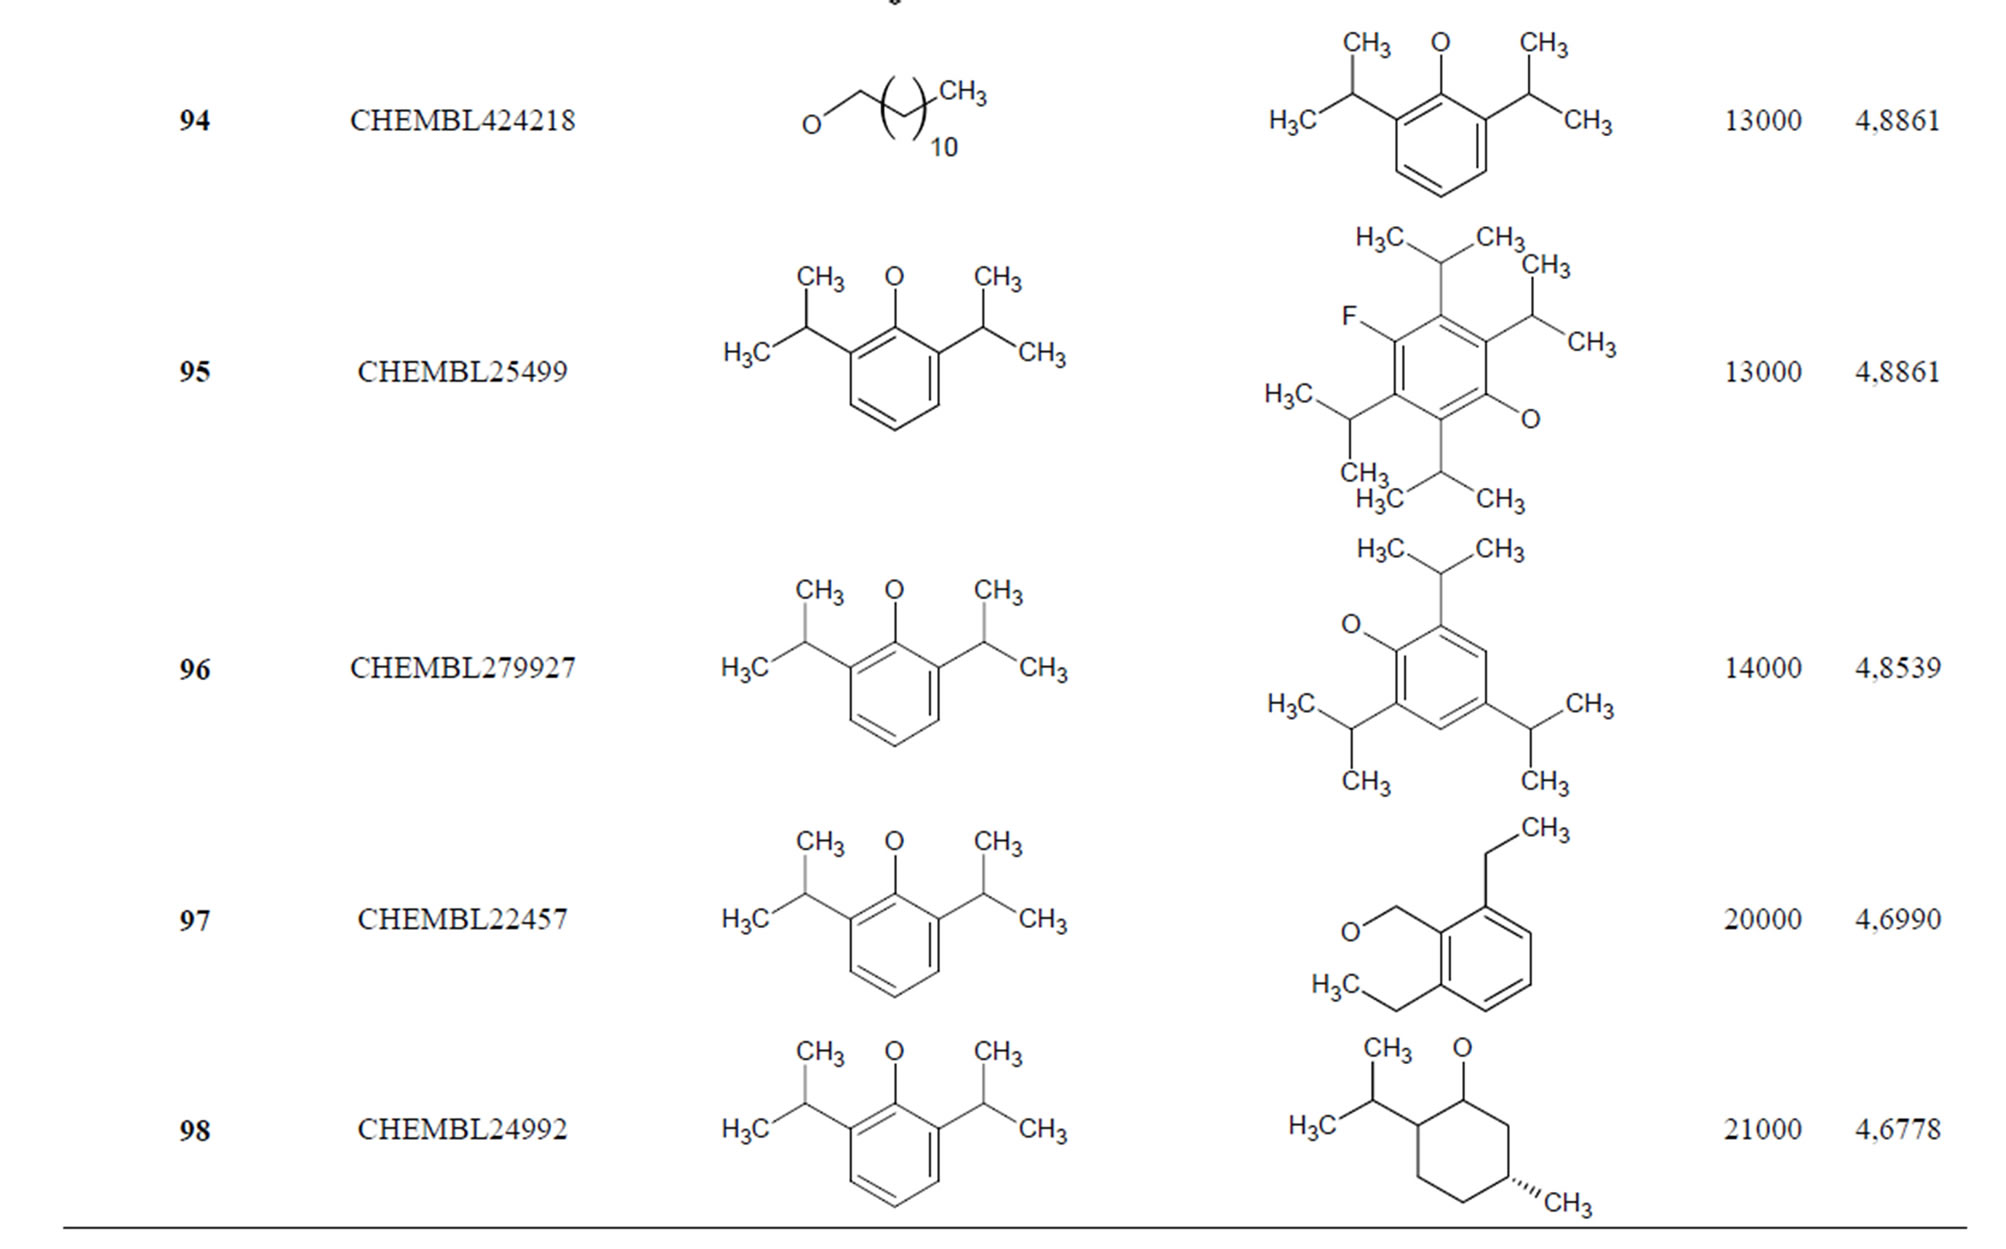
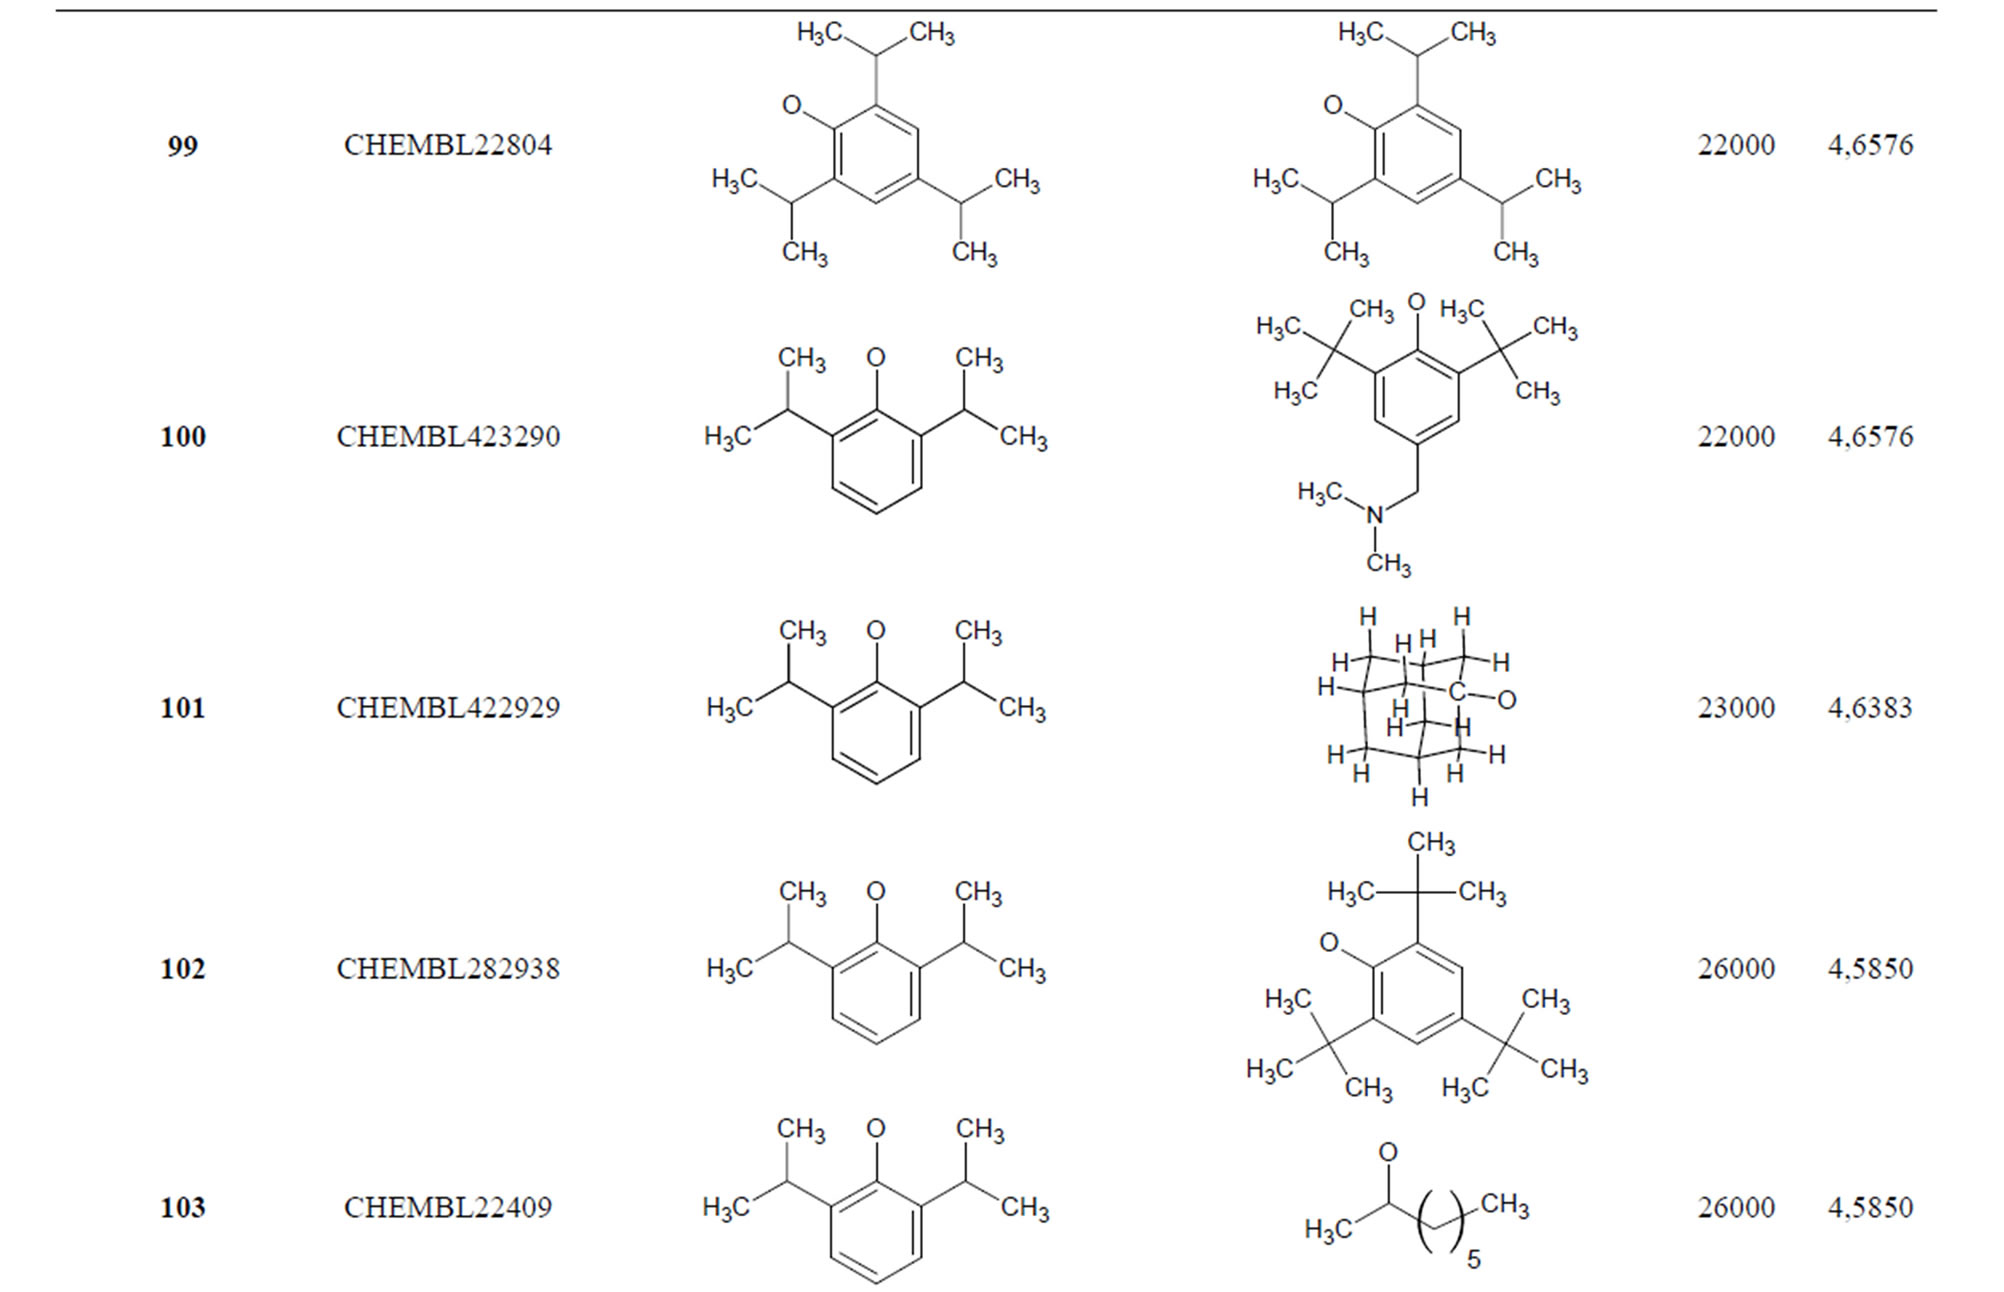
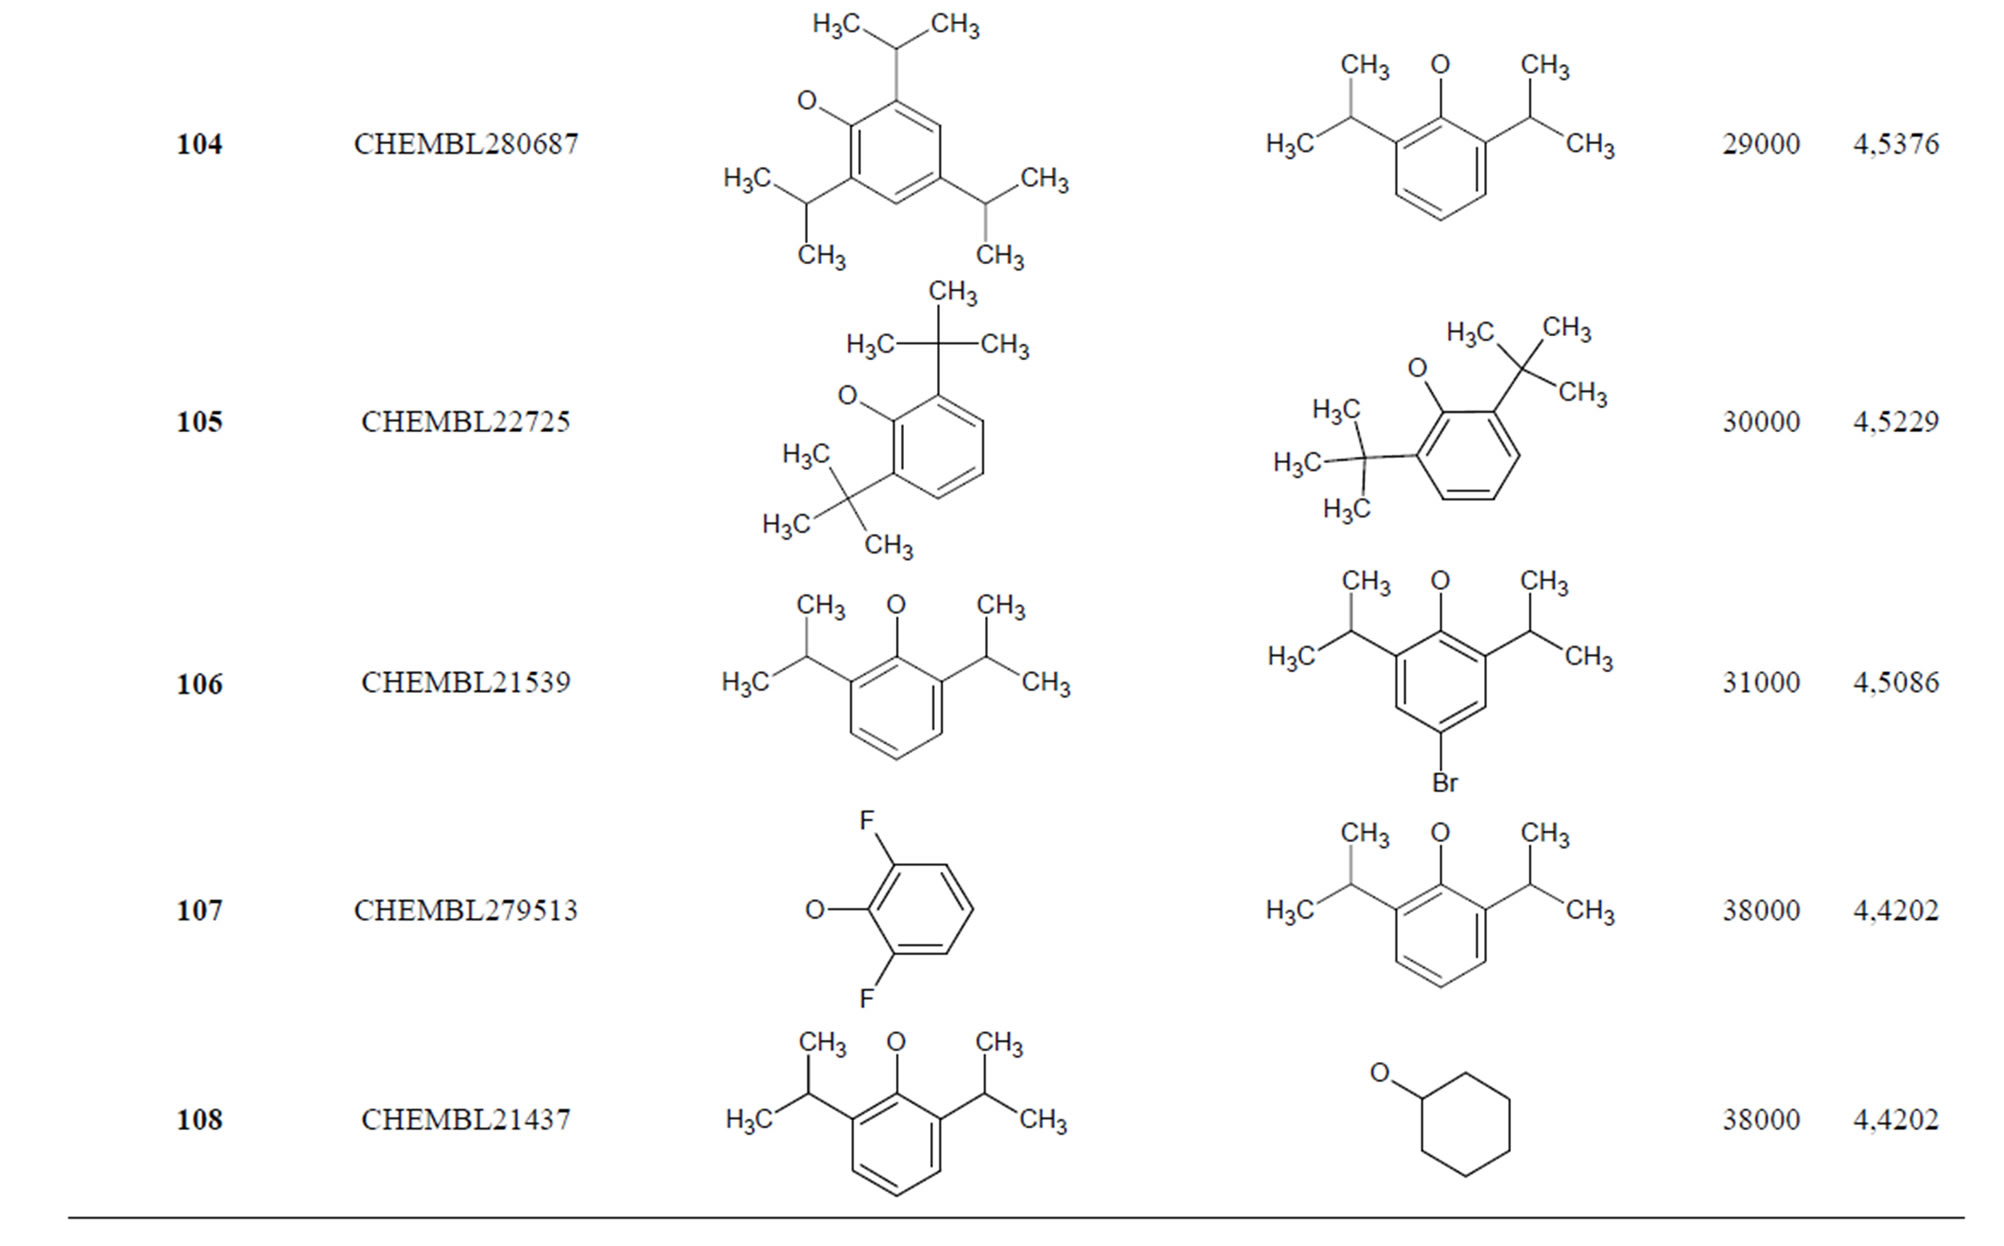
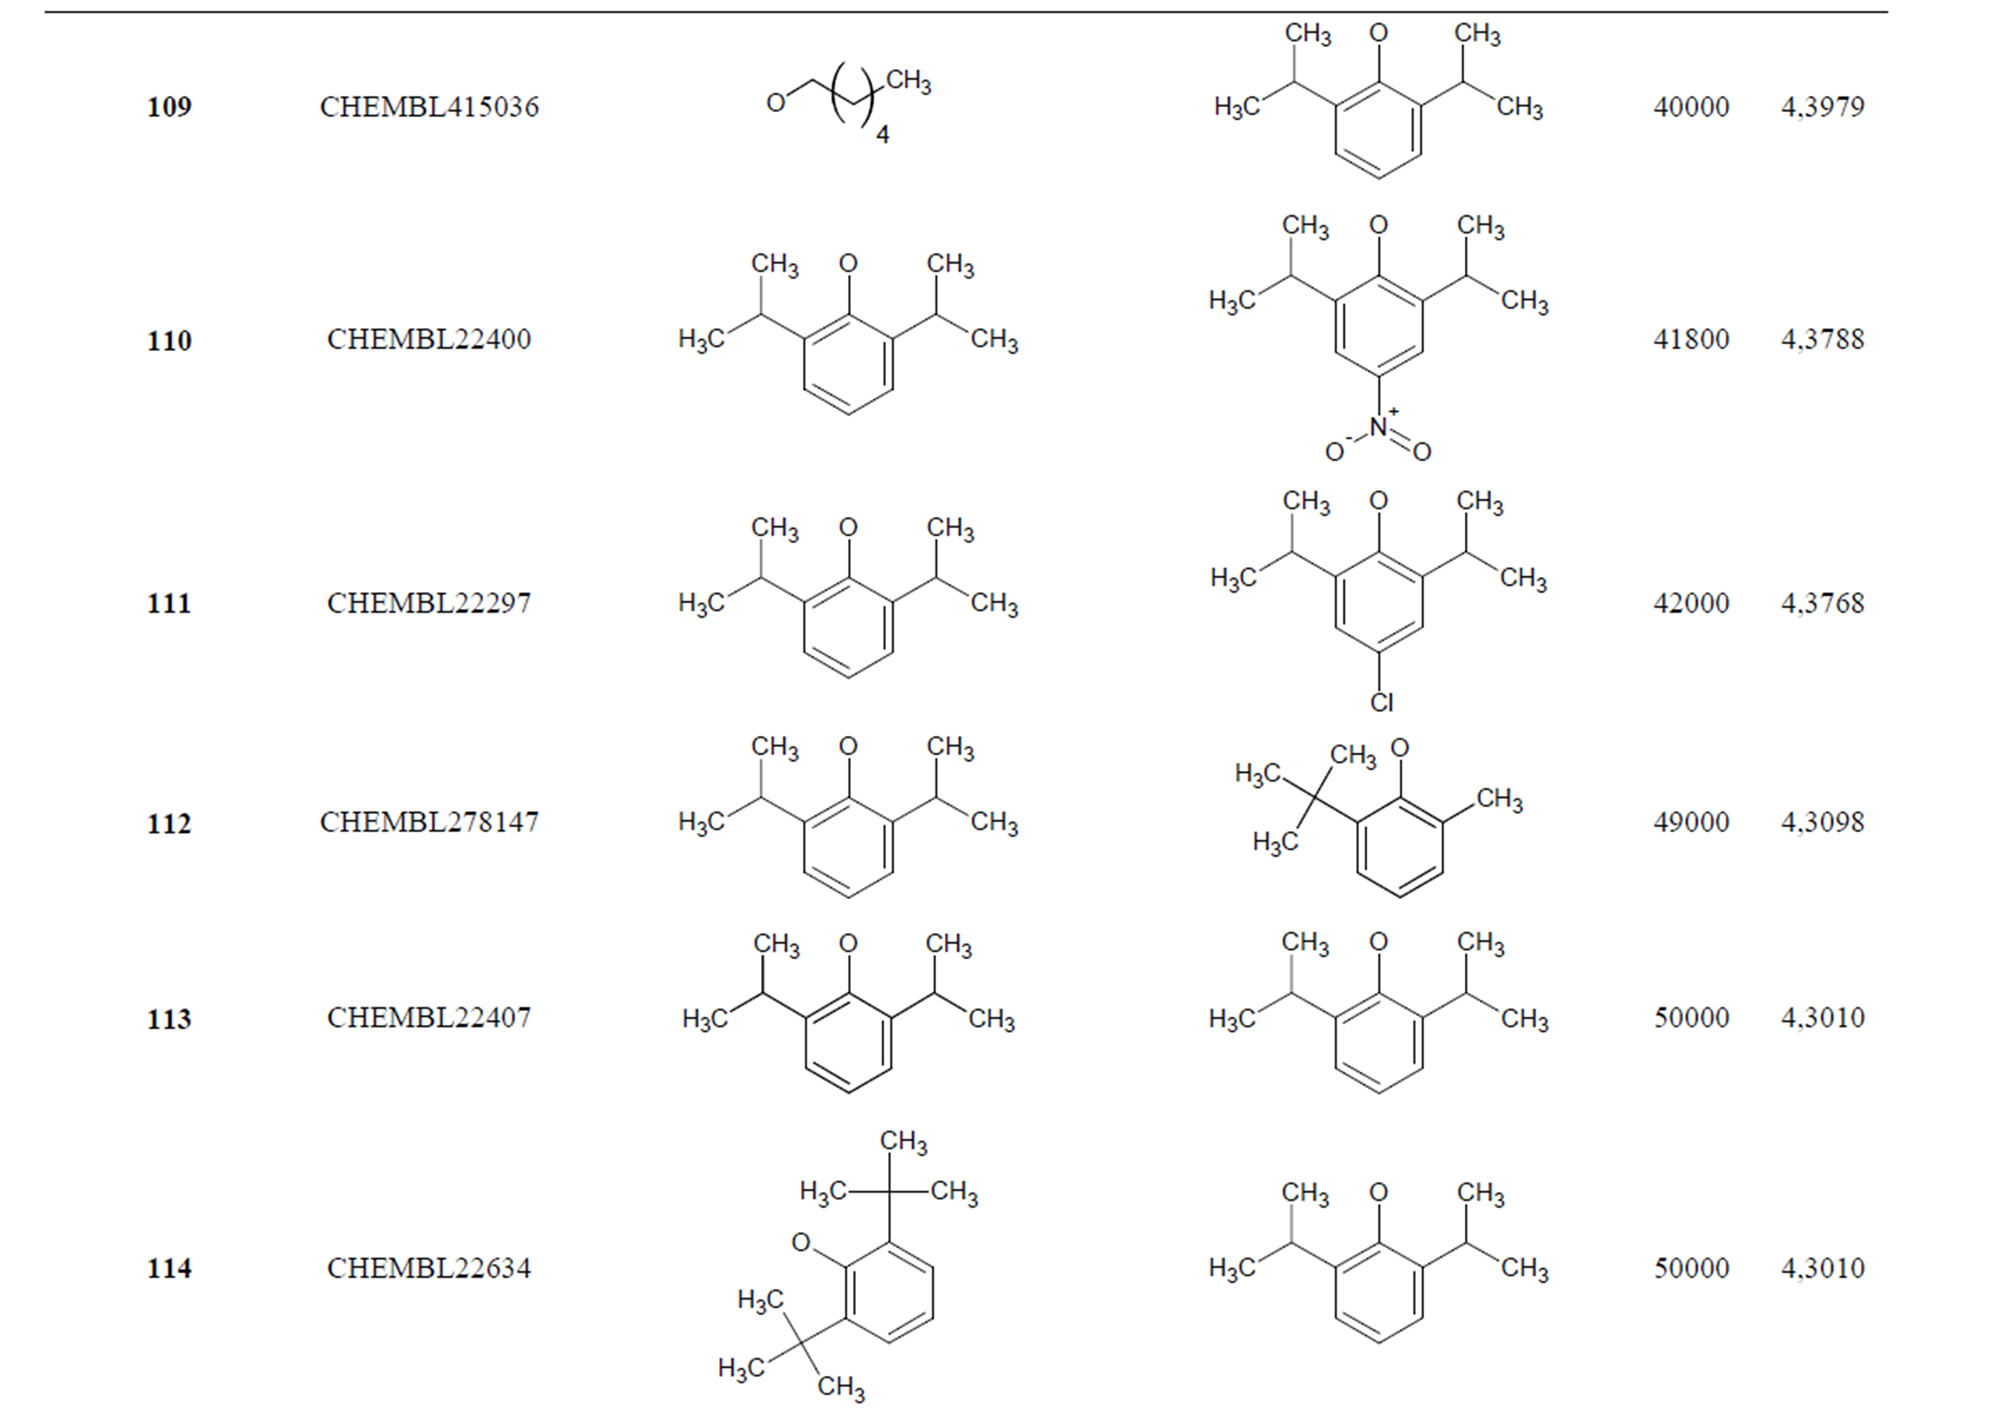

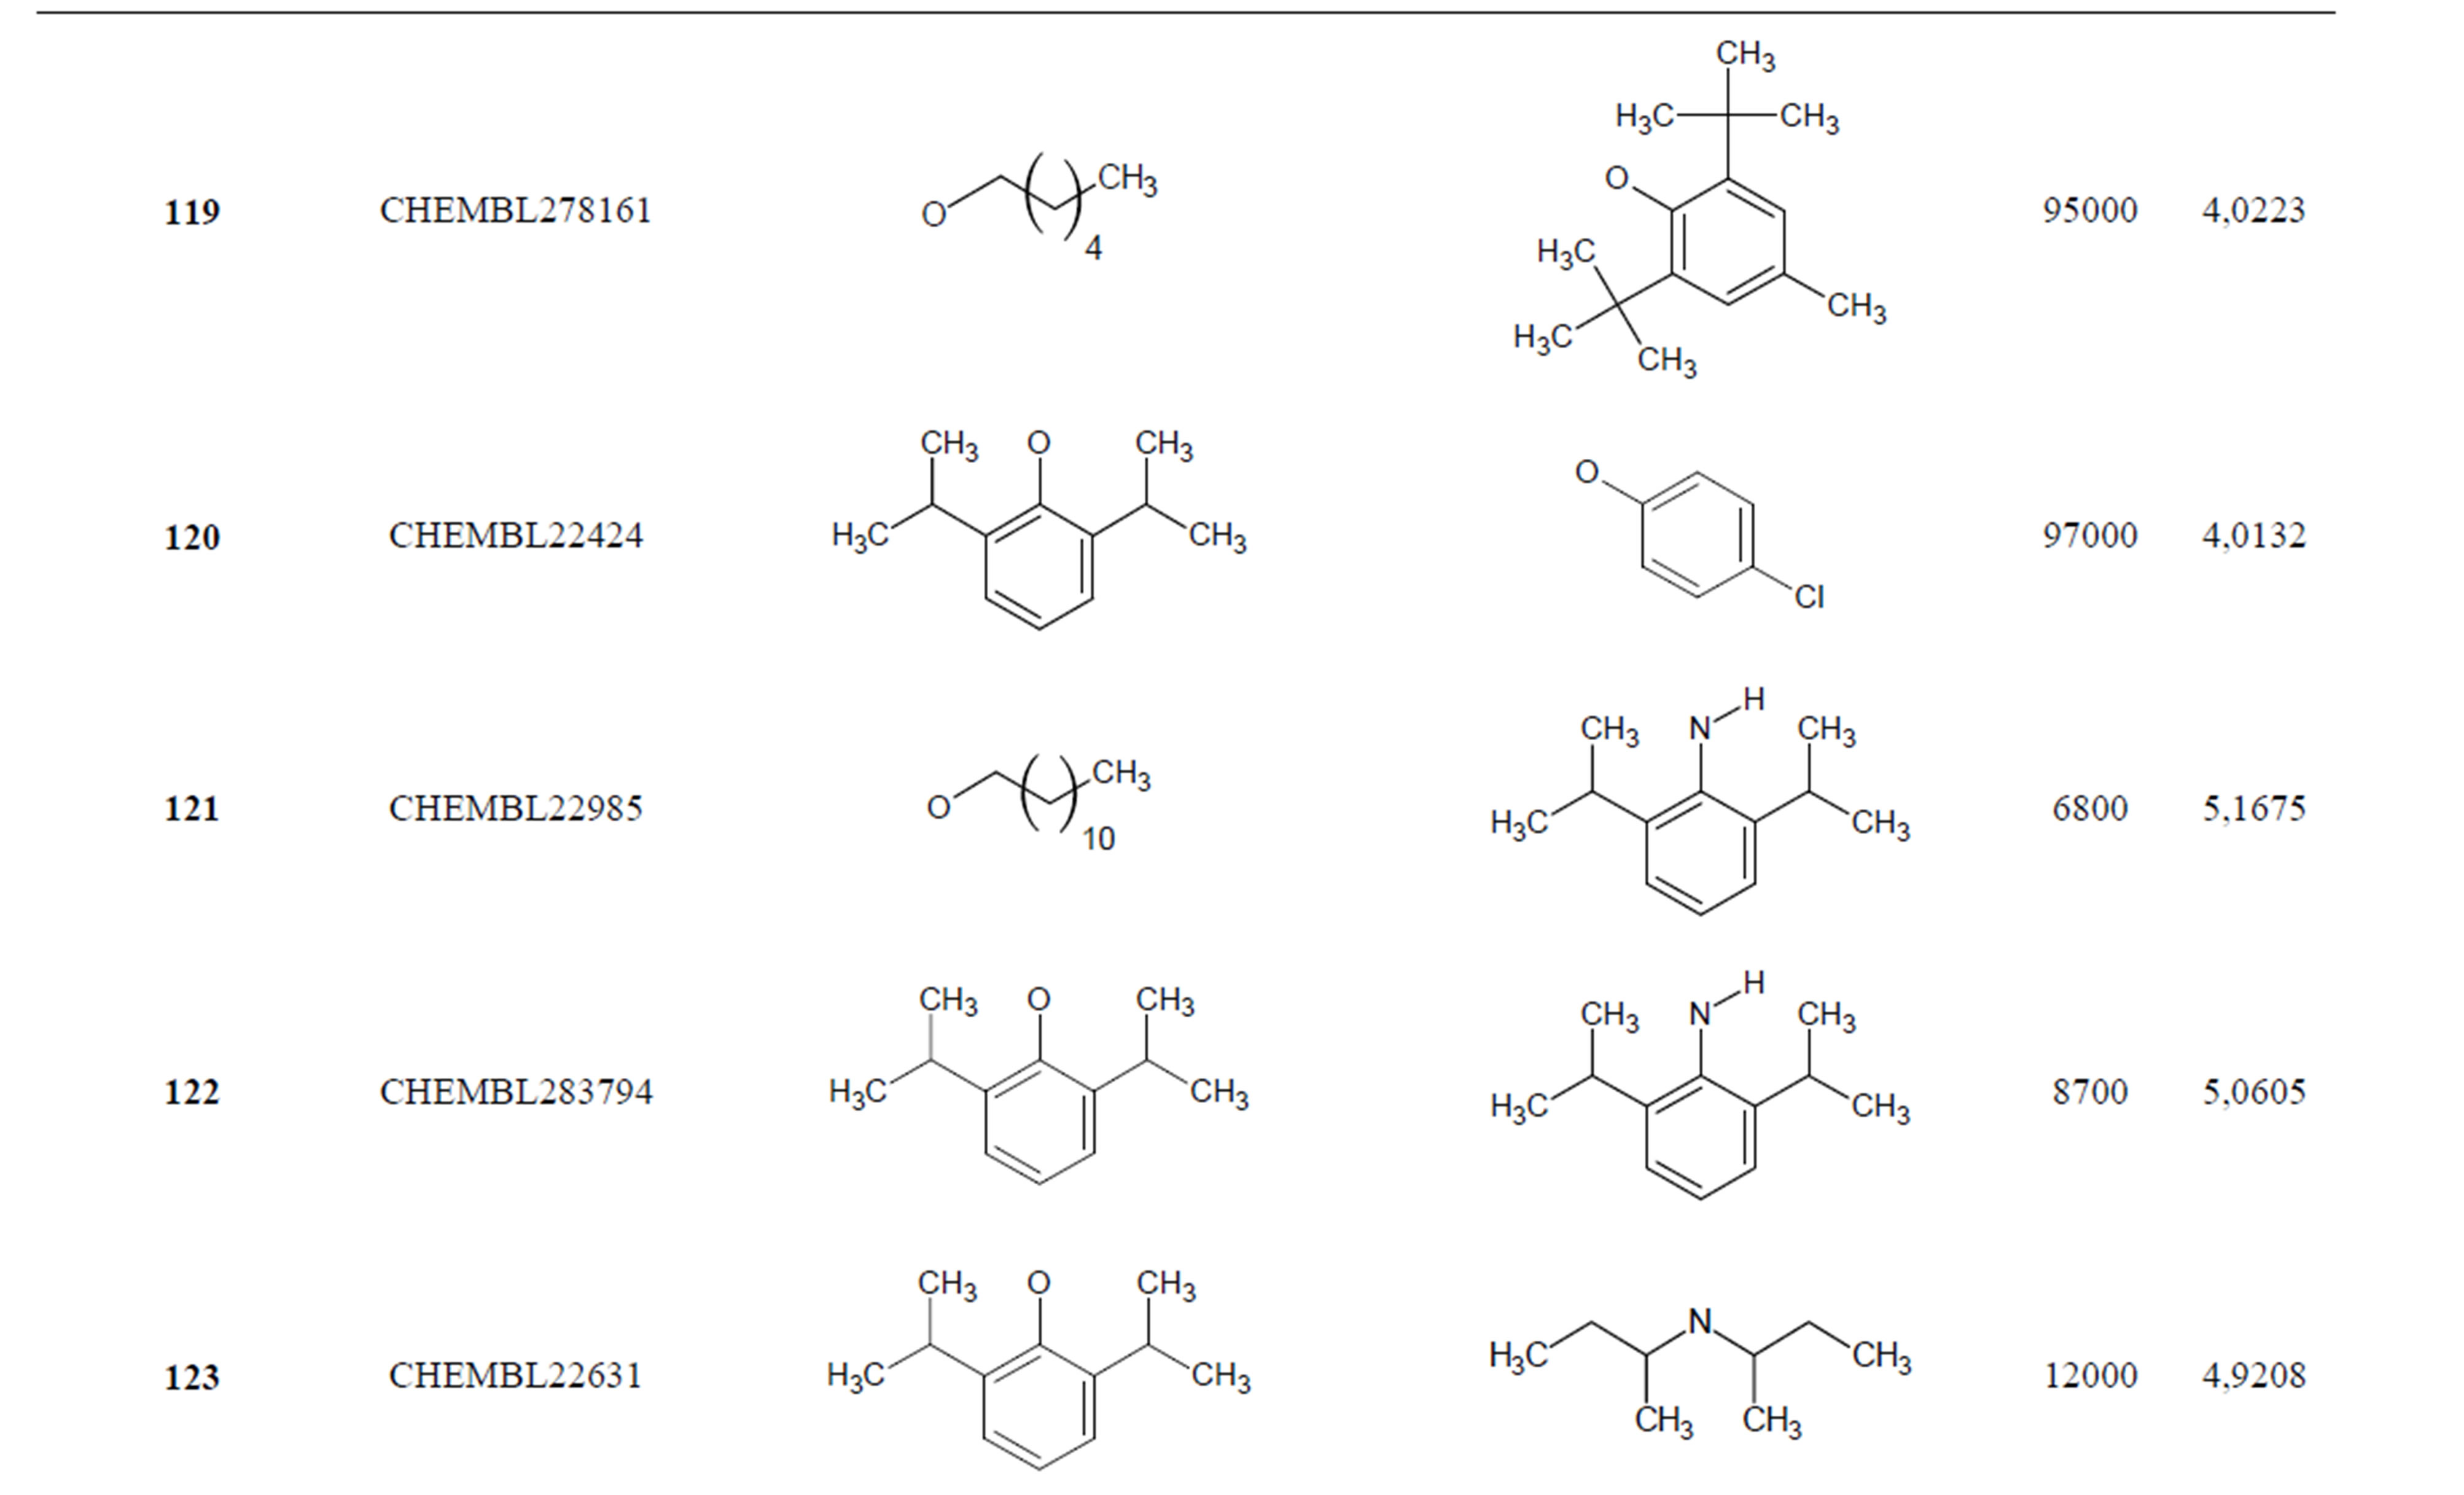
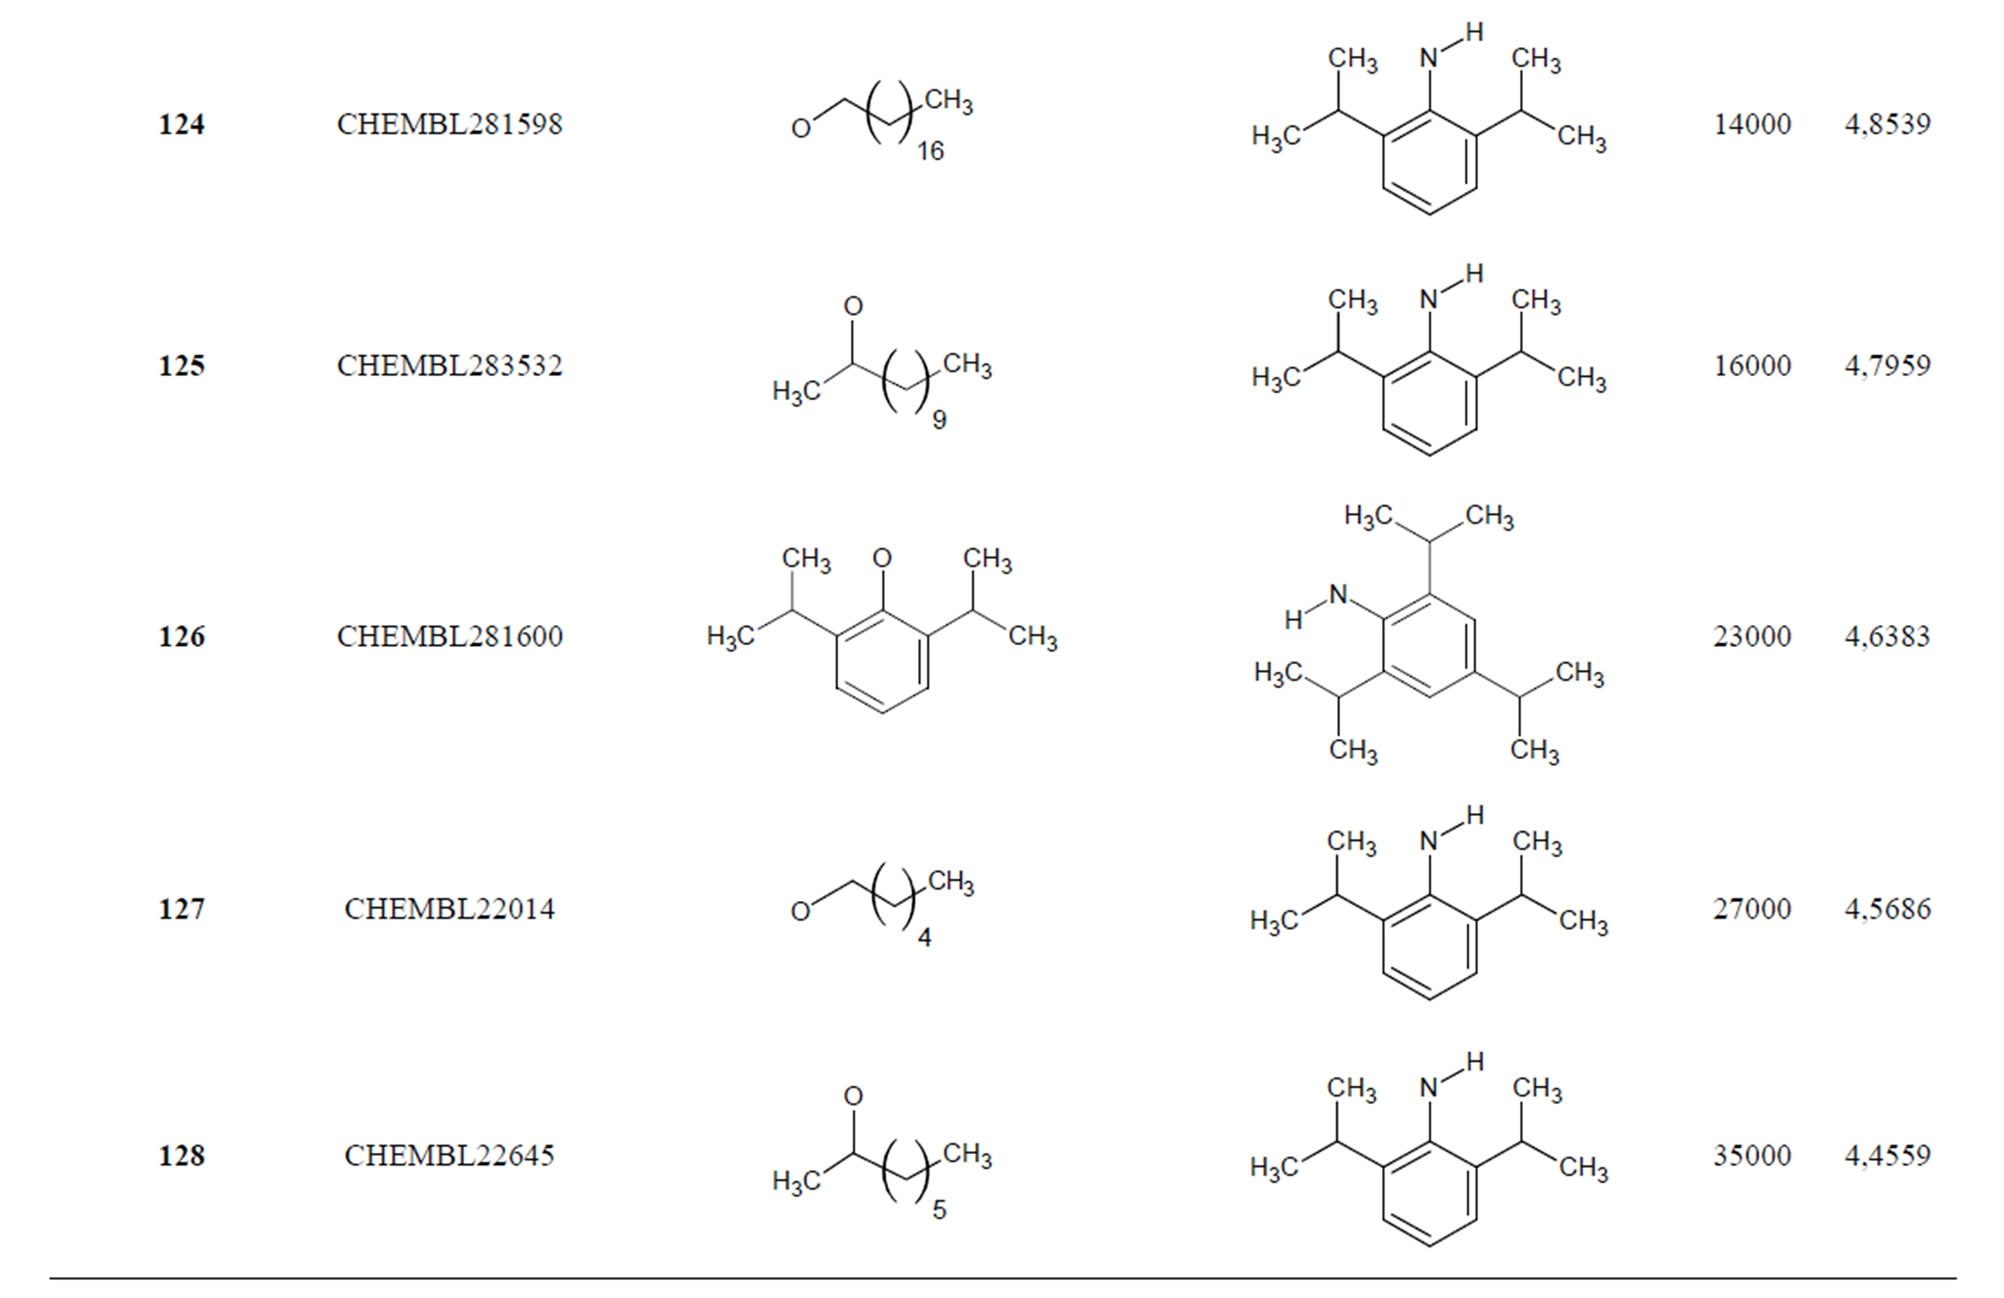
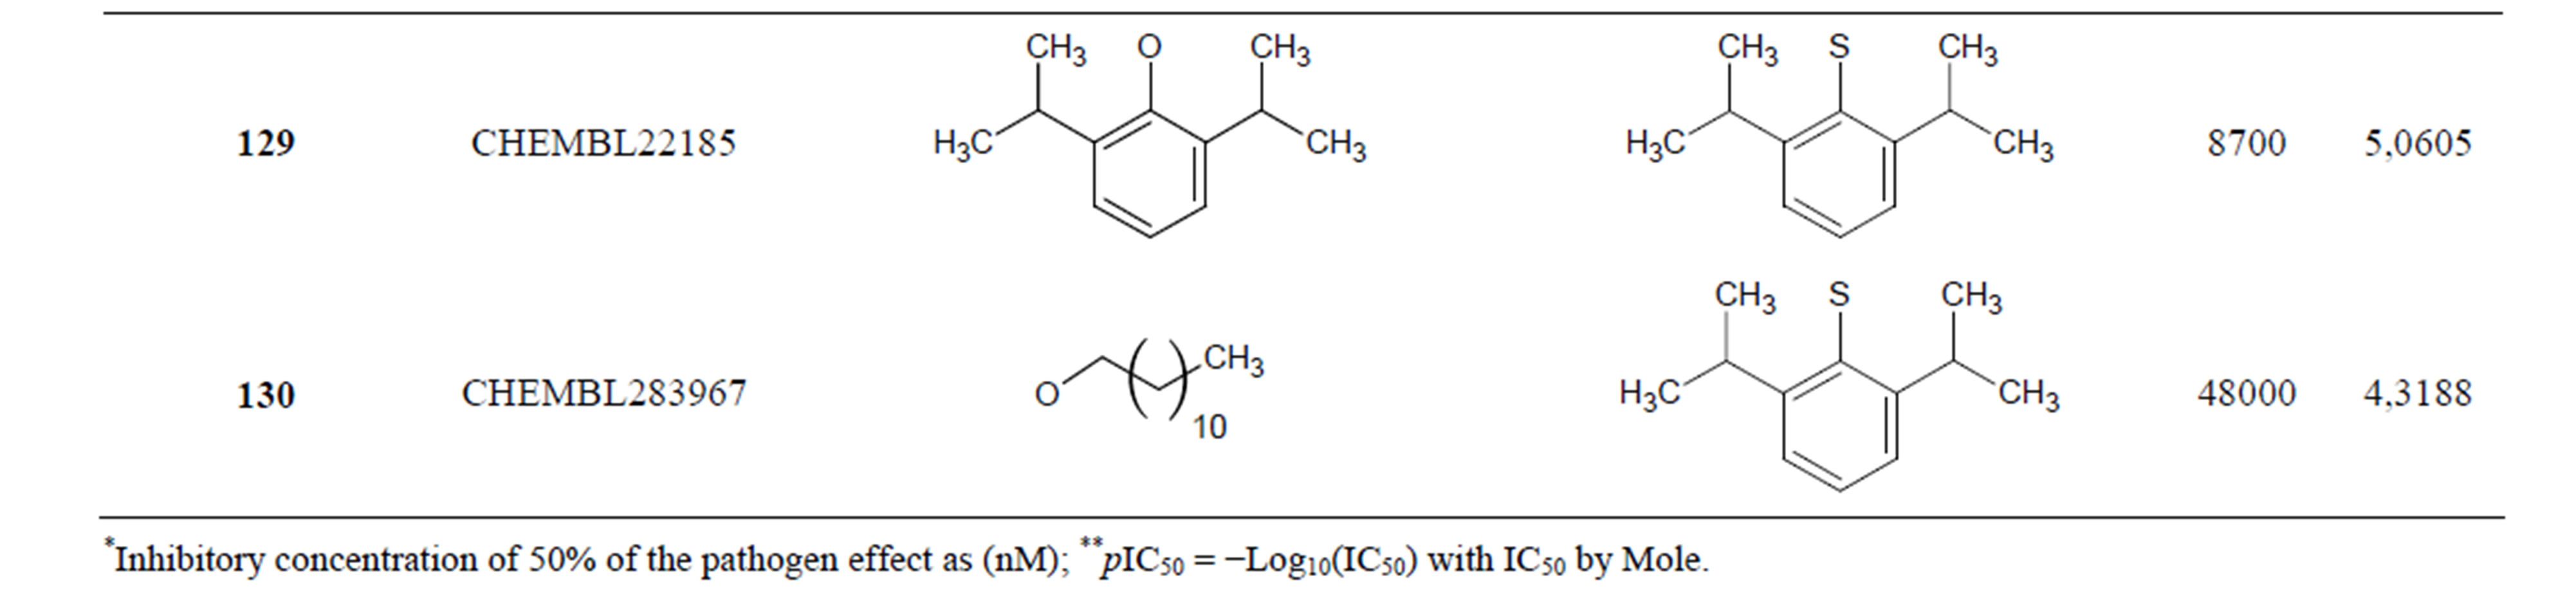
Table 1. Chemical structure representation of 130 N-CSI analogs (Family F) with the experimental value of IC50.
All of our molecular descriptors were calculated using the MMP32 Pro and Dragon packages. Some chemical parameters including molecular volume, molecular surface area, hydration energy and molecular polarizability were calculated using the ChemOffice v12 Software. The Gaussian program was employed for calculation of different quantum chemical descriptors including dipole moment, local charges, HOMO and LUMO energies.
2.2. Variable Selection and 2D-QSAR Model Generation
For each family of N-CSI derivatives (Figure 1), separate linear and nonlinear QSAR models were constructed. The development of QSAR equations has been done with two different methods: stepwise multiple linear regression and fitting function with artificial neural network. The selection of significant descriptors, which constructs a relationship between the biological activity data and the molecular structures, is an important step in QSAR modeling. Selection of significant descriptors was performed trough the following steps:
1) The calculated descriptors were collected in a data matrix, whose number of rows and columns were the number of molecules and descriptors, respectively. First the descriptors were checked for constant or near constant values and those detected were removed from the original data matrix. The correlation of descriptors with each other’s and with the activity data was determined.
2) The input variable in MLR must not be highly correlated. Among the collinear descriptors detected (r > 0.8) one with the highest correlation with the activity was retained and the rest were omitted.
3) The selected descriptors from each class and the experimentally inhibition of SOAT data were analyzed by the stepwise regression with SATISTICA 8.0 Software.
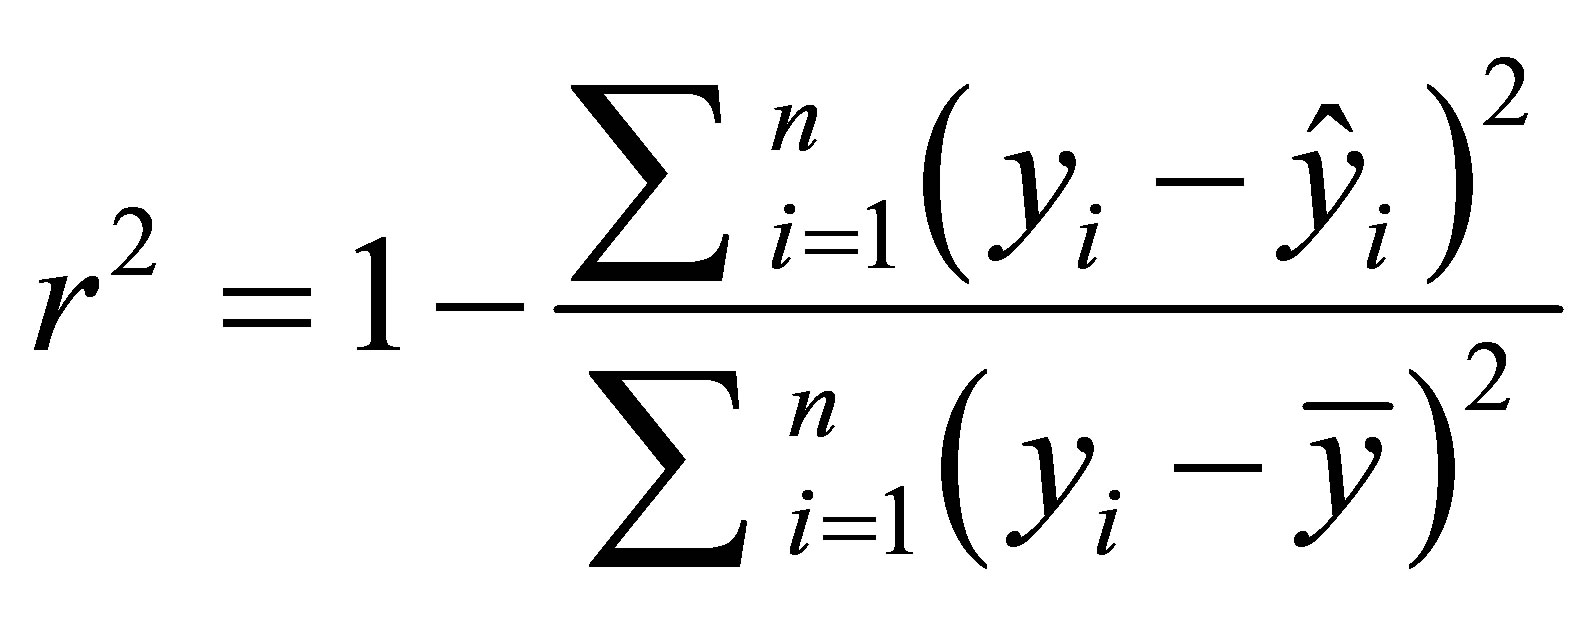
Multiple linear regression was used to generate linear models between the inhibitory activity and the molecular descriptors. With consideration of large number of descriptors used in this study, we have used forward and backward stepwise algorithms to select the pertinent descriptors [19]. The predictive activity of the model is quantified in terms of r2 which is defined as Equation 1.
Equation 1:
 .
.
In this equation yi and  are the predicted and the experimental values of the target property for the observation i respectively. The mean value of target property is noted as
 ![]() and r2 is the internal correlation coefficient.
and r2 is the internal correlation coefficient.
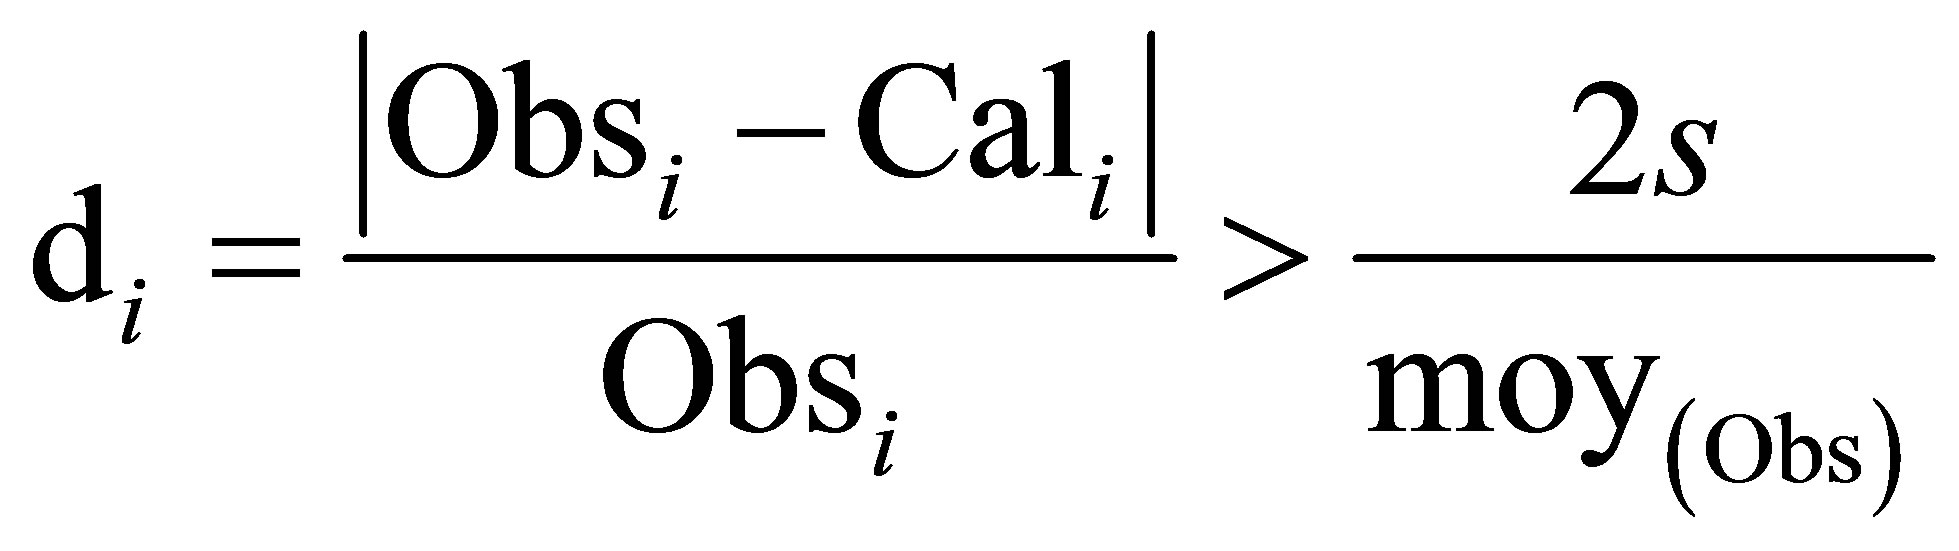
To keep around 5% of the experimental error, we take away the molecules having di higher than  as defined in Equation 2.
Equation 2:
 with:
with:
 : The mean of the observed activity values.
s: Standard deviation.
OBsi : Observed value of the activity for the i case.
Cali: Calculated value of the activity for the i case.
Leave-one-out (LOO) cross-validation was used to evaluate the predictive ability of the models. The crossvalidated coefficient q2 was calculated using Equation 3 as follows:
Equation 3:
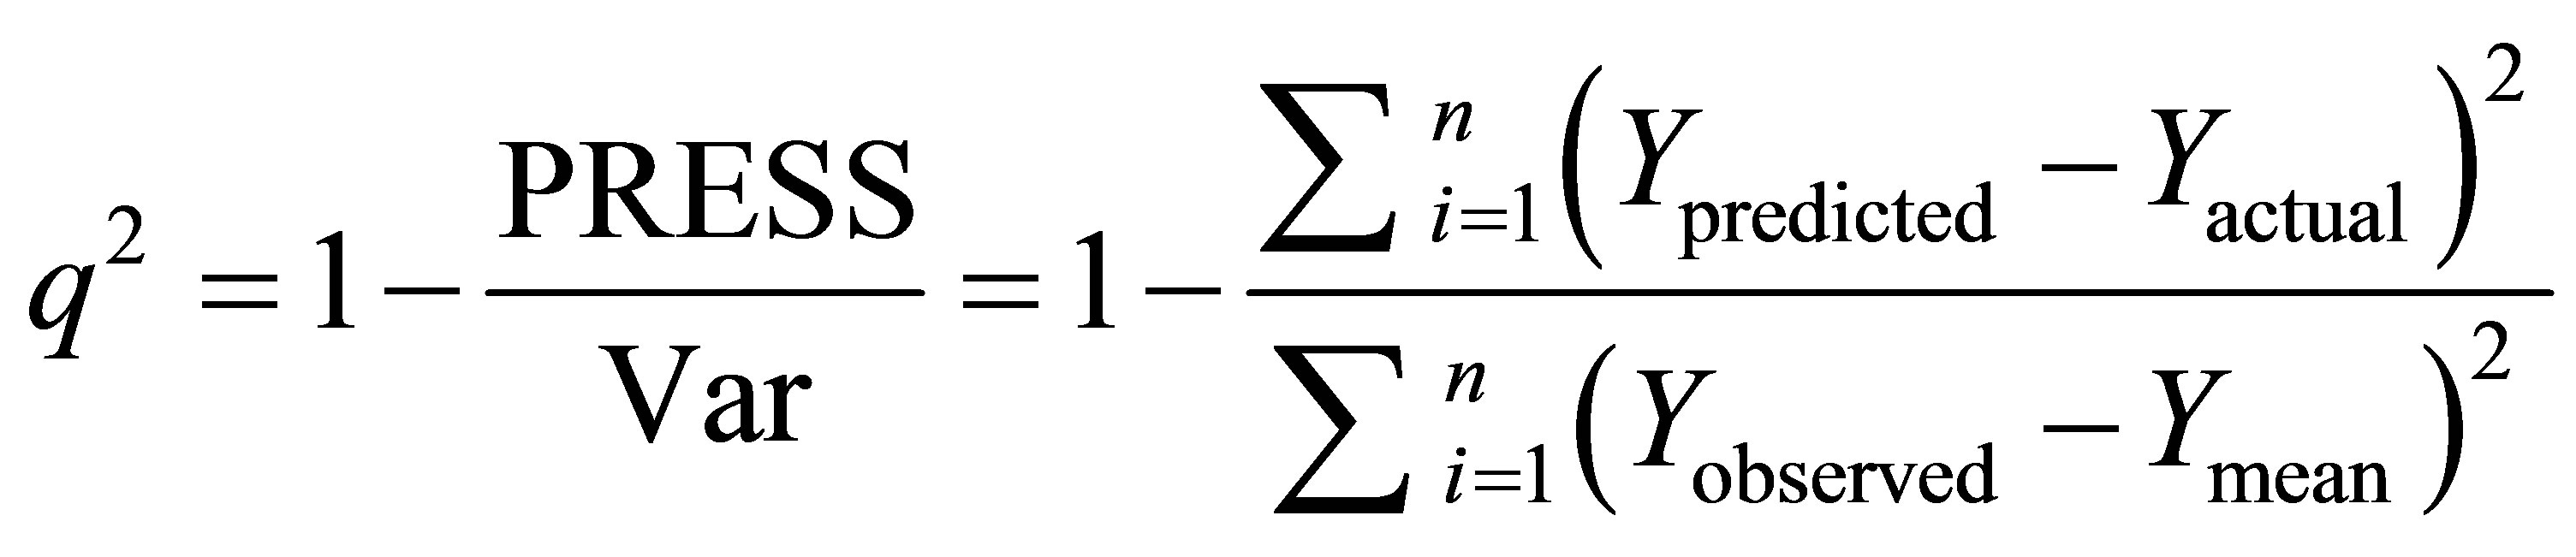 where Ypredicted, Yactual and Ymean are predicted, actual and mean values of the target property (pIC50), respectively.
  is the predictive sum of squares (PRESS). The optimum number of components used to derive the final regression models was the one that corresponds to the lowest PRESS value. In addition to the q2, the corresponding PRESS, the conventional correlation coefficient r2 and its standard errors s were also computed. To test the stability and robustness of the models, more rigorous statistical tests were performed by group cross-validation to eliminate the possibility of chance correlation.
The artificial neural network (ANN) consists of an input layer, an output layer and a number of hidden layers. At each node in a layer the information is received, stored, processed and communicated further to nodes in the next layer. All the weights are initialized to small random numeric values at the beginning of training. These weights are updated or modified iteratively using the generalized delta rule or steepest-gradient descent principle. The training process is stopped when no appreciable change is observed in the values associated with the connection links or some termination criterion is satisfied. Thus, the training of back-propagation network consists of two phases: a forward pass during which the processing of information occurs from the input layer to the output and a backward pass when the error from the output layer is propagated back to the input layer and the interconnections are modified. An example of a ANN topology is shown in Figure 2.
The contribution of descriptors  was estimated from the [n-m-1] neural network architecture
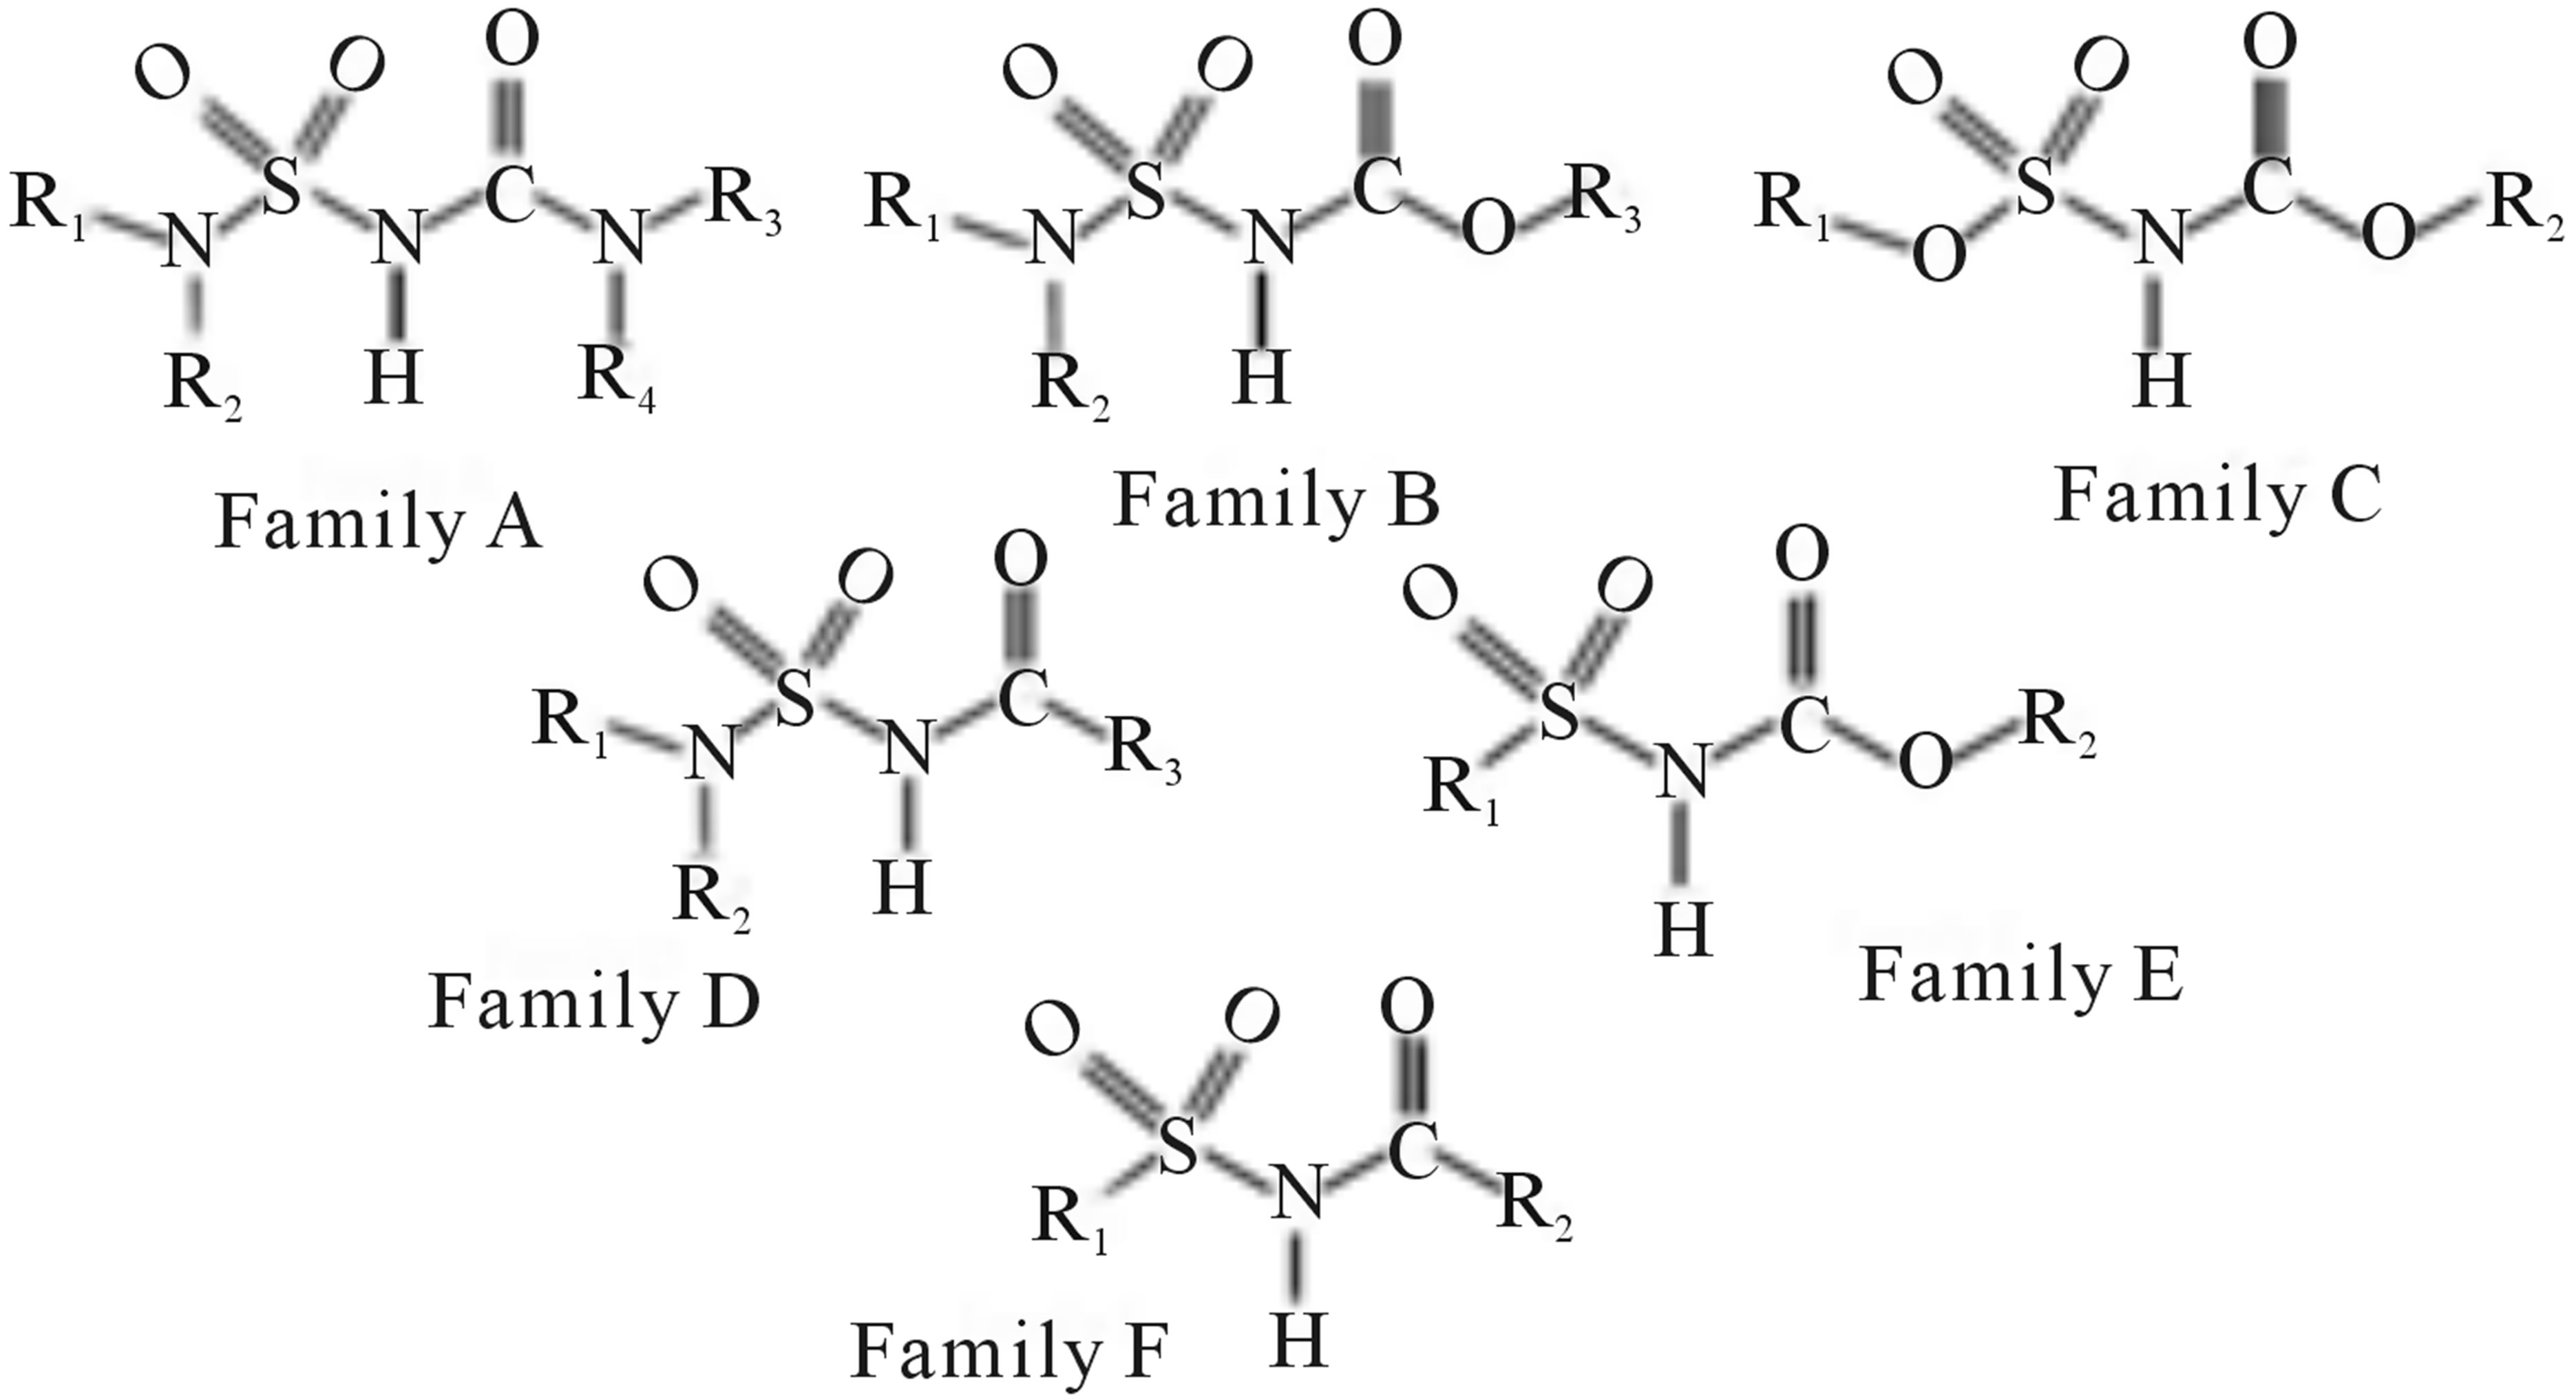
Figure 1. The family F represents the chemical structure of N-CSI analogs. The families A-E represent the sub-chemical structures with different radicals at each level.
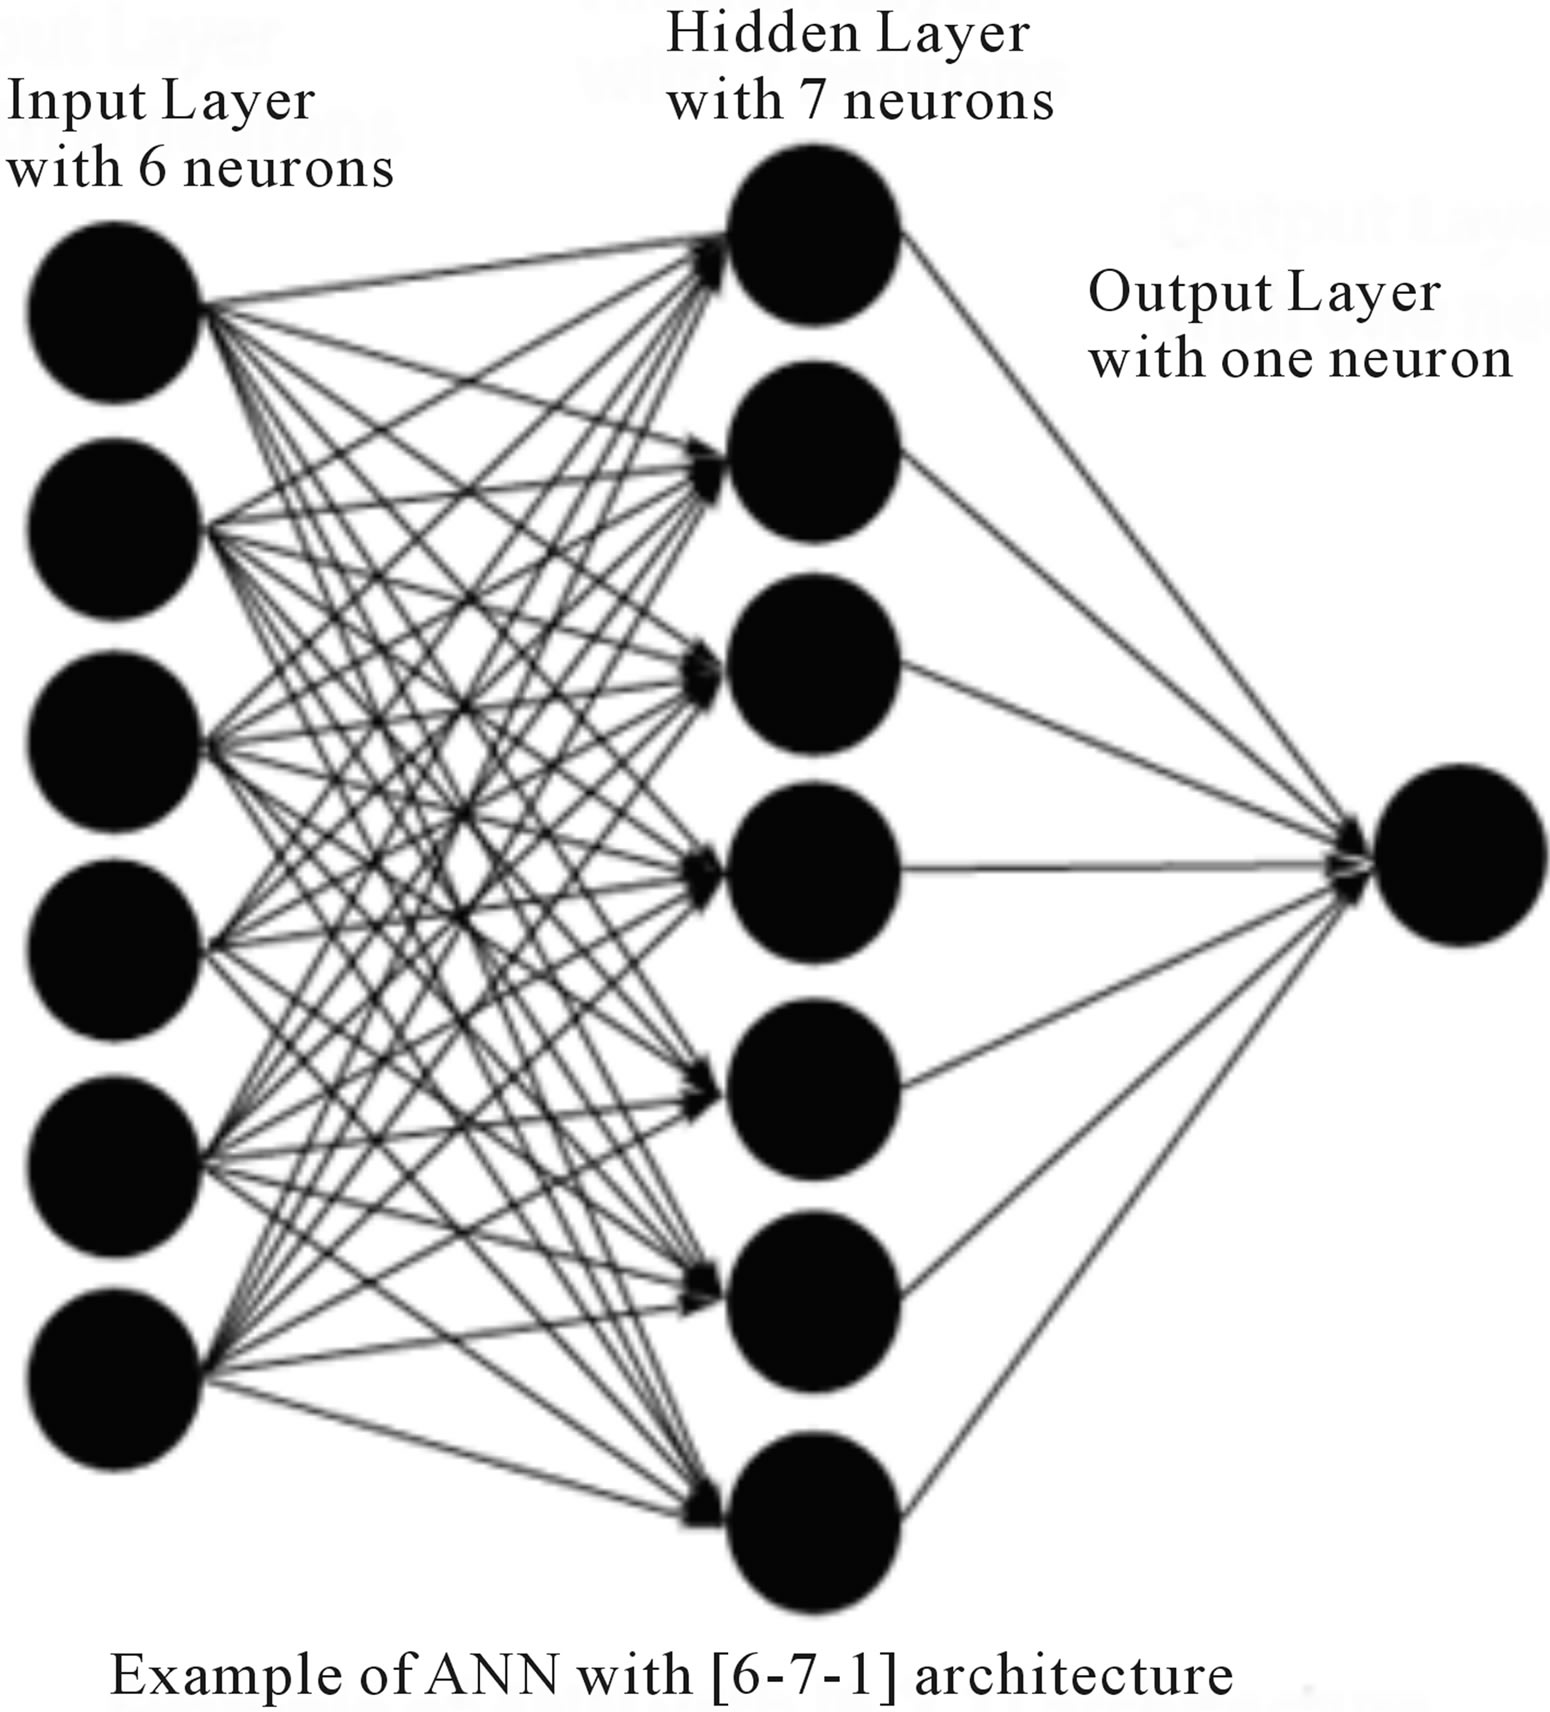
Figure 2. Example of artificial neural network with [6-7-1] architecture.
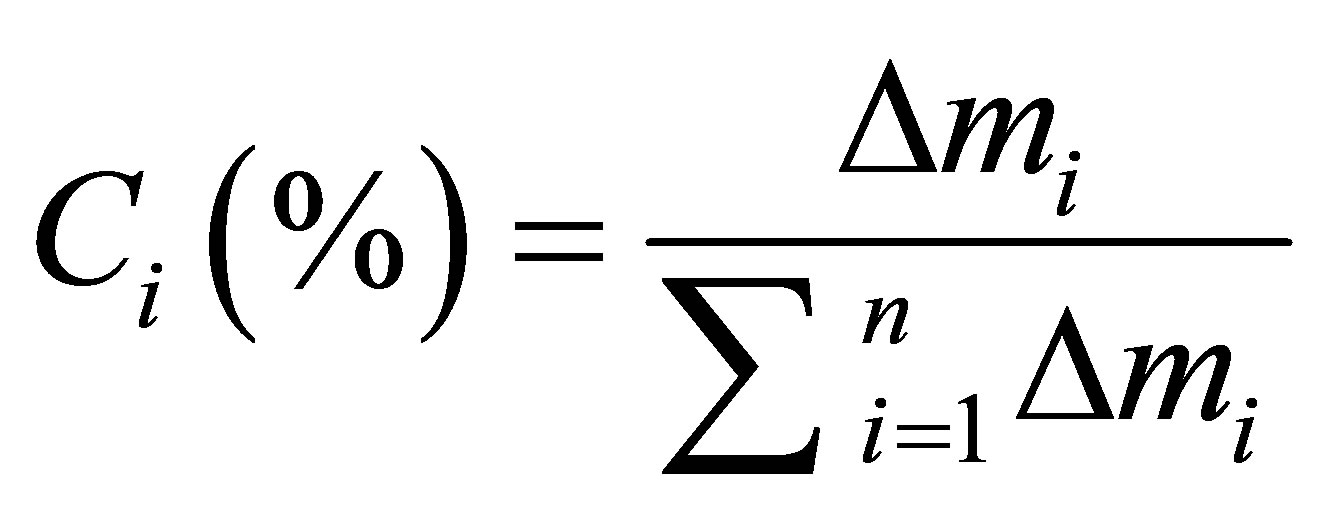
with n number of descriptors and m number of neurons in hidden layer. The descriptor under study was removed from the ANN calculated the output of each molecule as usual. The mean of the absolutes deviations value  between the observed activity and the predicted one for all compounds was determined. This process was reiterated for each descriptor. Finally, the contribution Ci of each descriptor i is given by Equation 4.
Equation 4:
 with:
with:
 : Mean value of absolutes deviations between predicted and calculated activity.
 : Sum of means values of absolutes deviations between predicted and calculated activity for n descriptors.
2.3. Alignment of Compounds and 3D Molecular Docking
All the dataset molecules were aligned (Figure 3) according to the binding models resulting from docking simulations. Each compound was docked within the ATP binding pocket of the active ACAT-1 site using the program Molegro [20]. The recently reported X-ray crystallographic structure (2.3 Å resolution; PDB accession code: 1WL4 and 1WL5) of ACAT-1 in complex with ATP (Figure 4) was chosen as template for SOAT-1
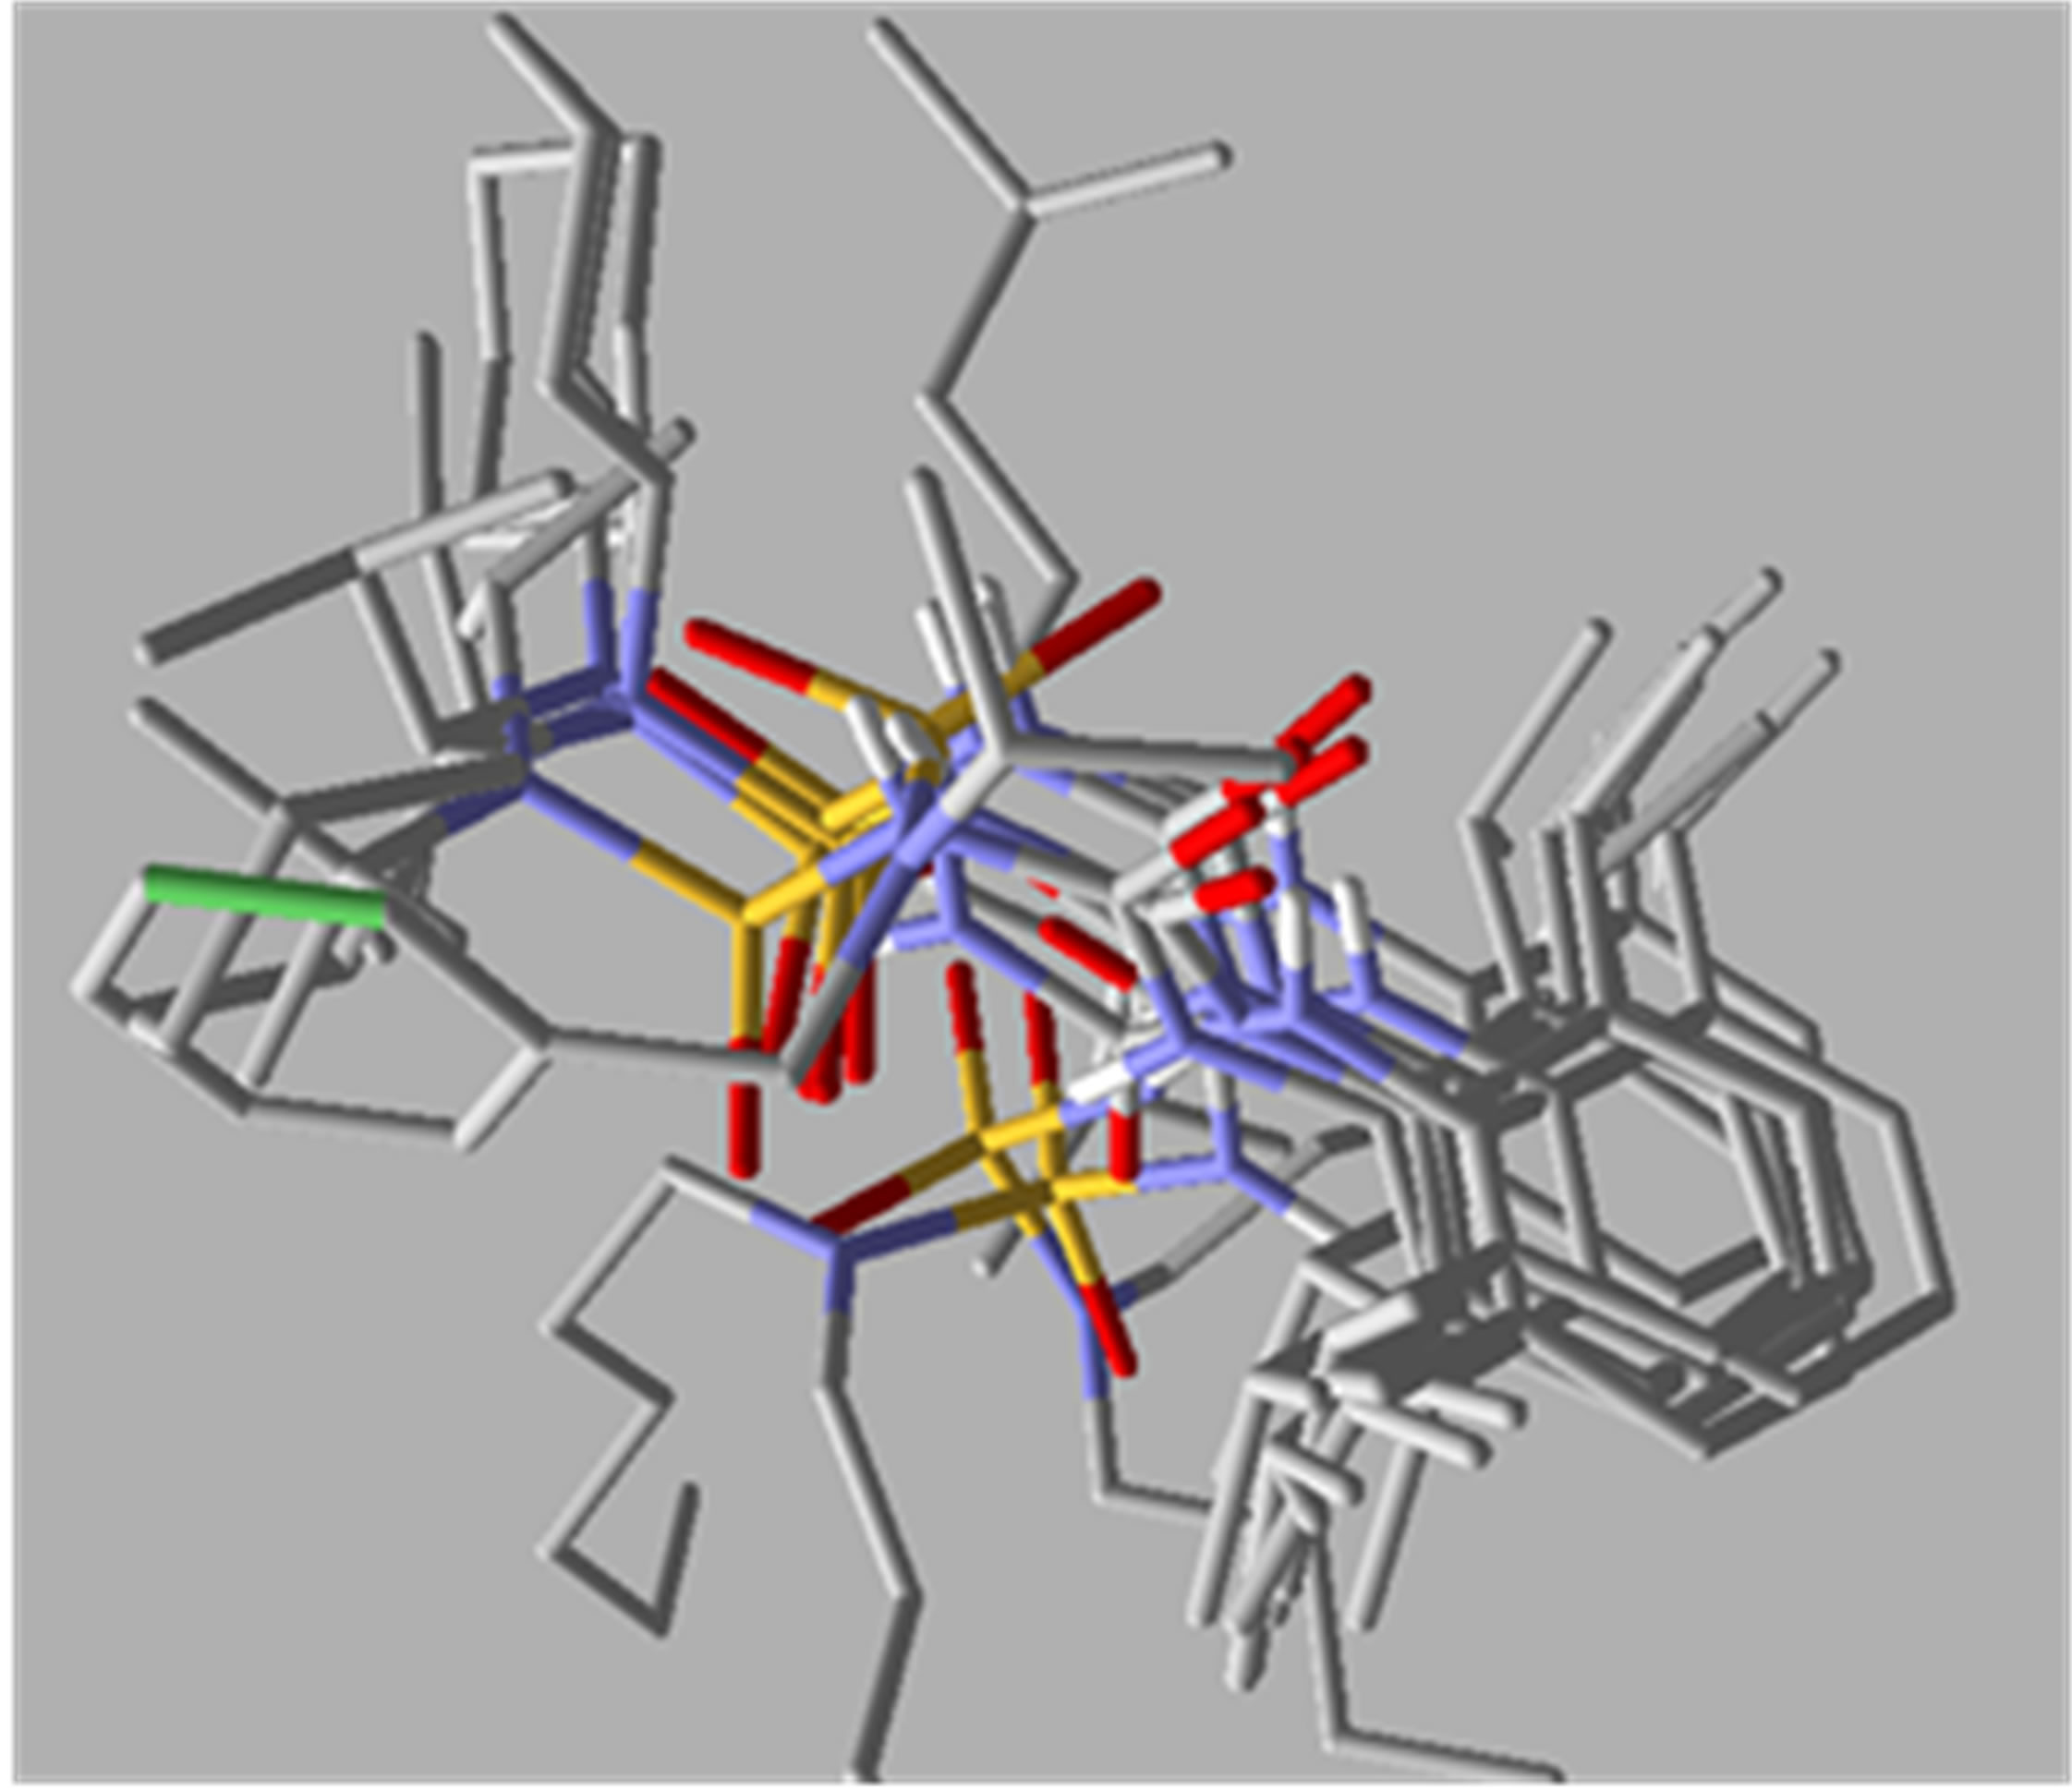
Figure 3. Alignment of the N-CSI analogs.
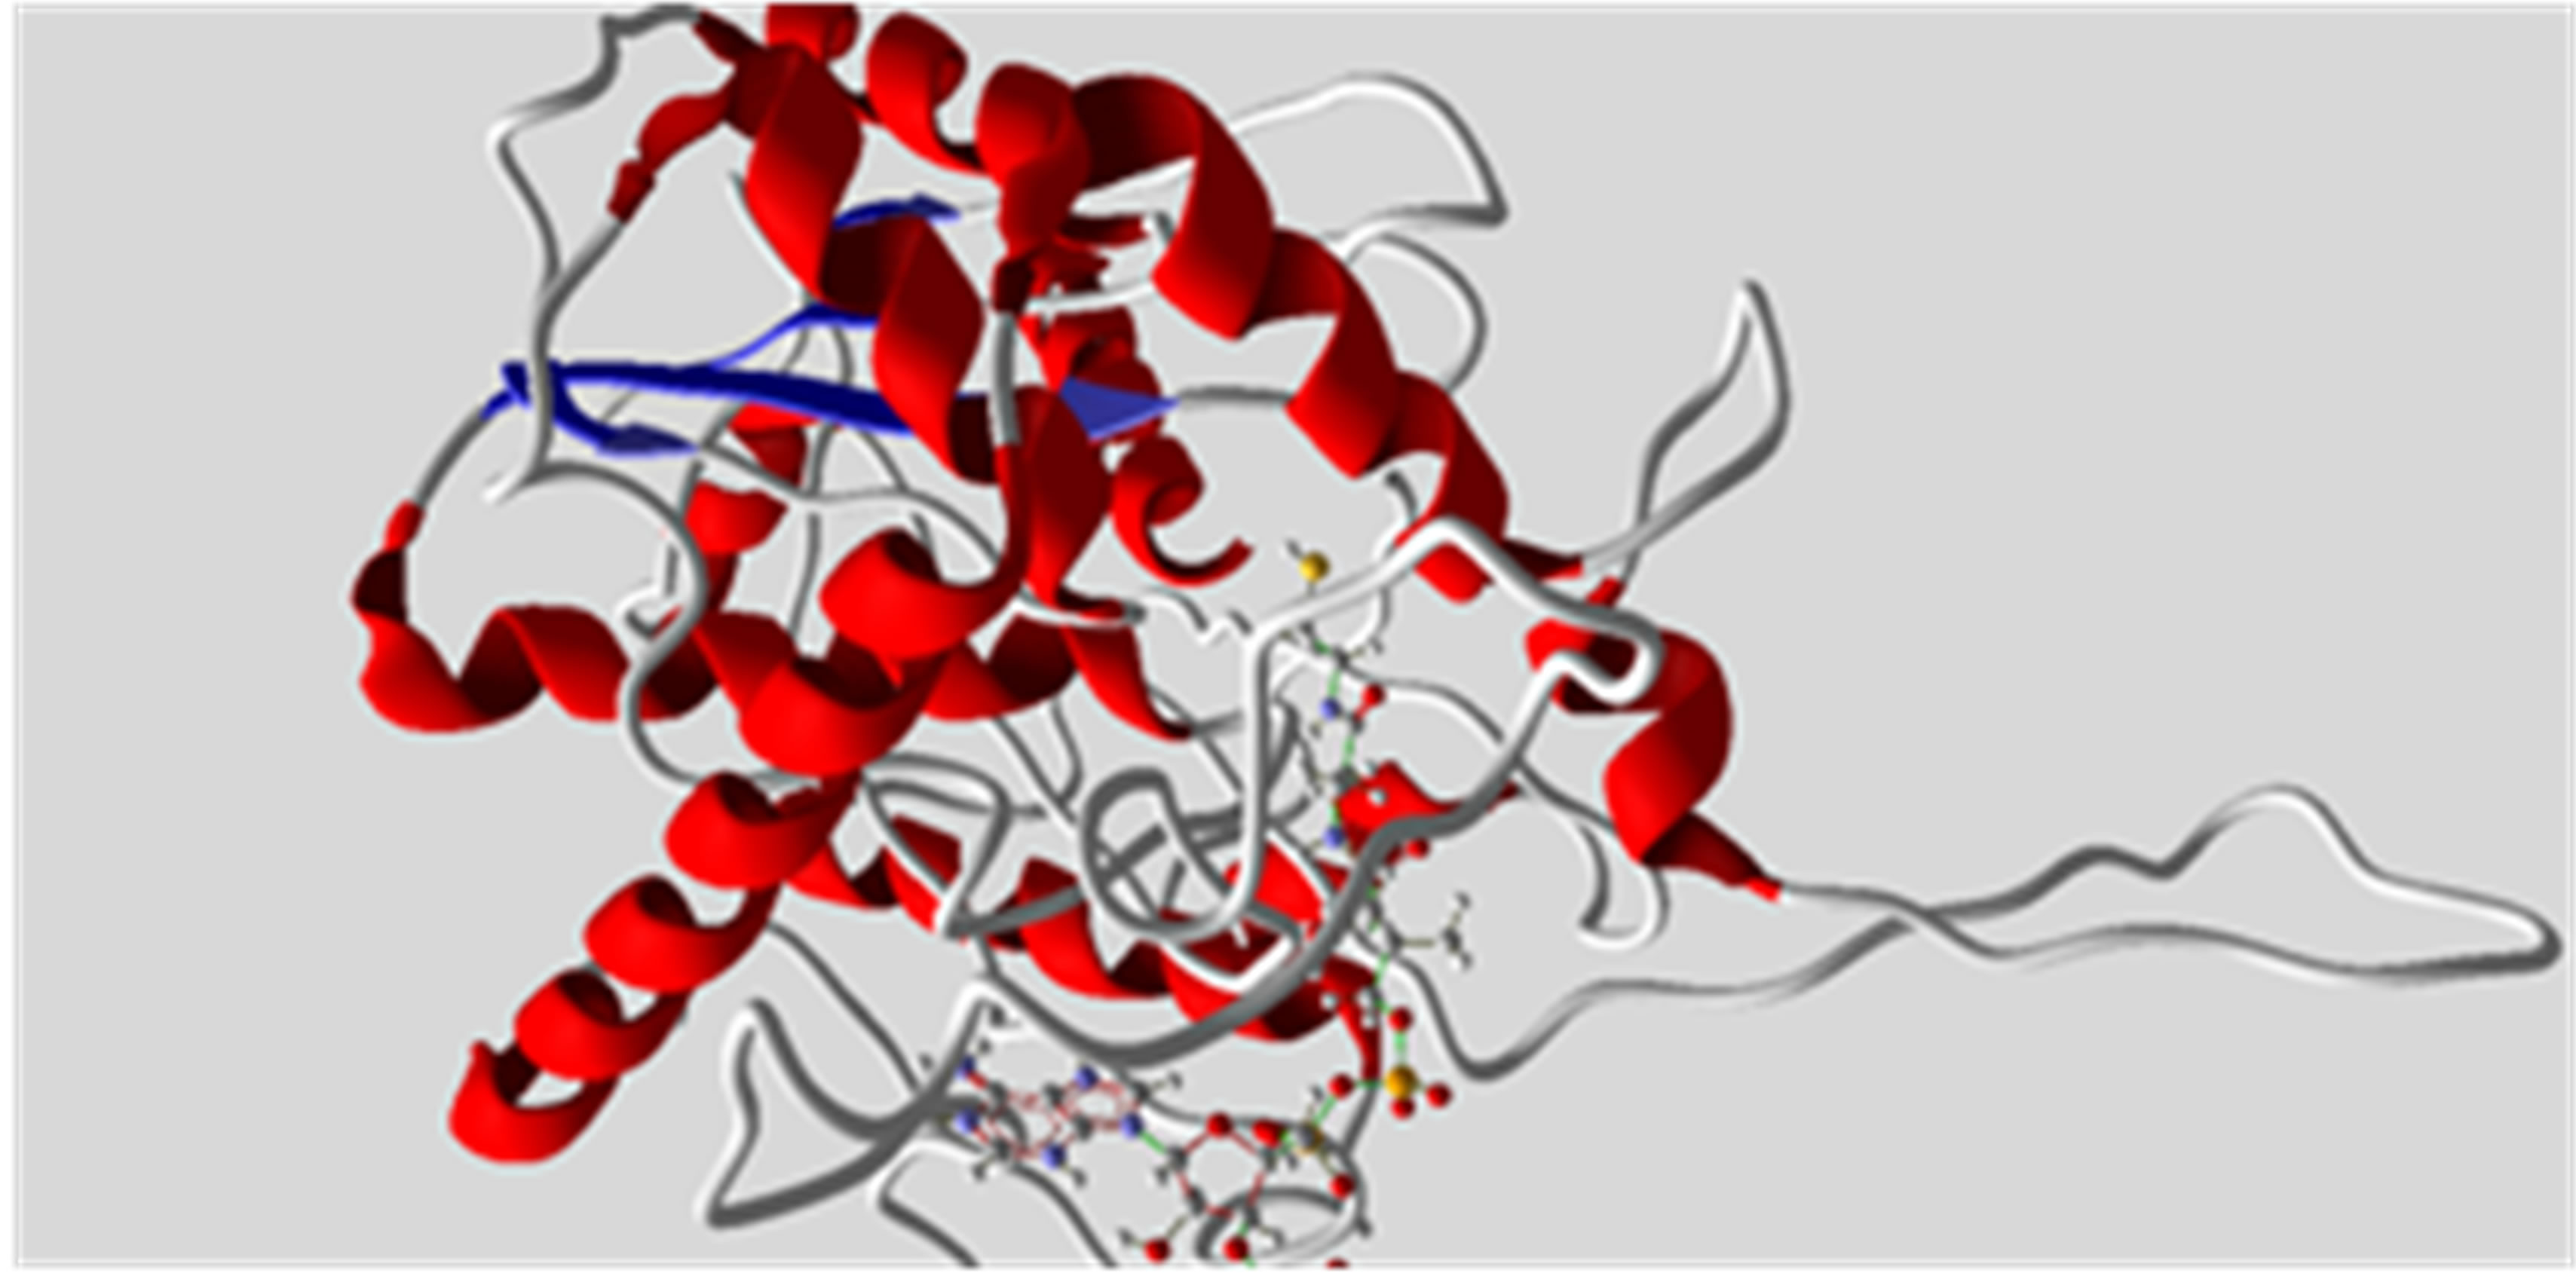
Figure 4. Representation of ACAT-1 from the X-ray data (PDB accession code: 1WL4 and 1WL5) in complex with ATP molecule.
target, based on resemblance between the co-crystallized ligand and the compounds under analysis. The X-ray structure was manipulated to prepare the input for Molegro calculations by removing both non-polar hydrogens and water molecules. The binding pocket was inserted into a grid box centred on the bound ligand and enclosing residues lying within about 11 Å from the ligand itself.
The Molegro program was used to add the hydrogens and establish the protonation state at the physiological pH for all the inhibitors, before adding the Gasteiger atomic charges. Finally, the rigid root and the rotatable bonds for each compound were defined using the module implemented on Molegro program. The MolDock algorithm was employed to explore the possible orientations and conformations of SOAT-1 inhibitors in the binding site. For each of the 100 independent runs, a maximum number of 1500,000 operations were performed with a population size of 200 individuals. Finally, the best ranked conformation of each molecule was selected. The scoring function and electronic, electrostatic and hydrophobicity interactions between ligand and analogs were deeply analyzed to extract the right and useful chemical information.
3. Results and Discussion
3.1. Physicochemical 2D-QSAR Studies of N-CSI Analogs
In order to study the effect of different levels of a radical analogues N-CSI, we divided the initial database (Family F) into two databases (Families D and E) while showing in each case a nitrogen atom and an oxygen atom in the basic skeleton. Then we divided the database (Families D and E) into three databases (Families A, B and C) to investigate further the effect and the nature of the atoms on the inhibitory activity of the enzyme SOAT-1.
For each database we have conducted a linear and nonlinear QSAR analysis to determine the nature of this relationship and the relevant physico-chemical descriptors. The specificity of this 2D-QSAR study is of using physicochemical descriptors to exploit chemical information for a useful design of new N-CSI generation analogs. The sets were devised into two groups using hierarchical ascending classification HAC to make groups with high similarity. Table 2 summarizes the final linear models equations of the datasets (Families A to F) for training and validation sets.
Tables 3 and 4 include the linear and nonlinear statistical results, respectively, for each database while mentioning the number of validated molecules n, the correlation coefficient r, the standard deviation s, the Fischer test F and the coefficient of cross-validation q2 with architecture of the neural network adopted.
The 2D-QSAR study of Family A, has allowed us to validate the hydrogen bond donor of radical R4 and the molecular width of the radical R1 as relevant descriptors with a contribution of 53% and 47% respectively. The Family B has allowed us to validate the lipophilicity of the radical R1 as relevant descriptor with a contribution of 100%. Finally, for the Family D, we have validated the molecular volume, lipophilicity and hydrogen bond donor molecule as relevant descriptors with a contribution of 0.85%, 20.79% and 78.36% respectively.
The 2D-QSAR study of Families A, B, and D allowed
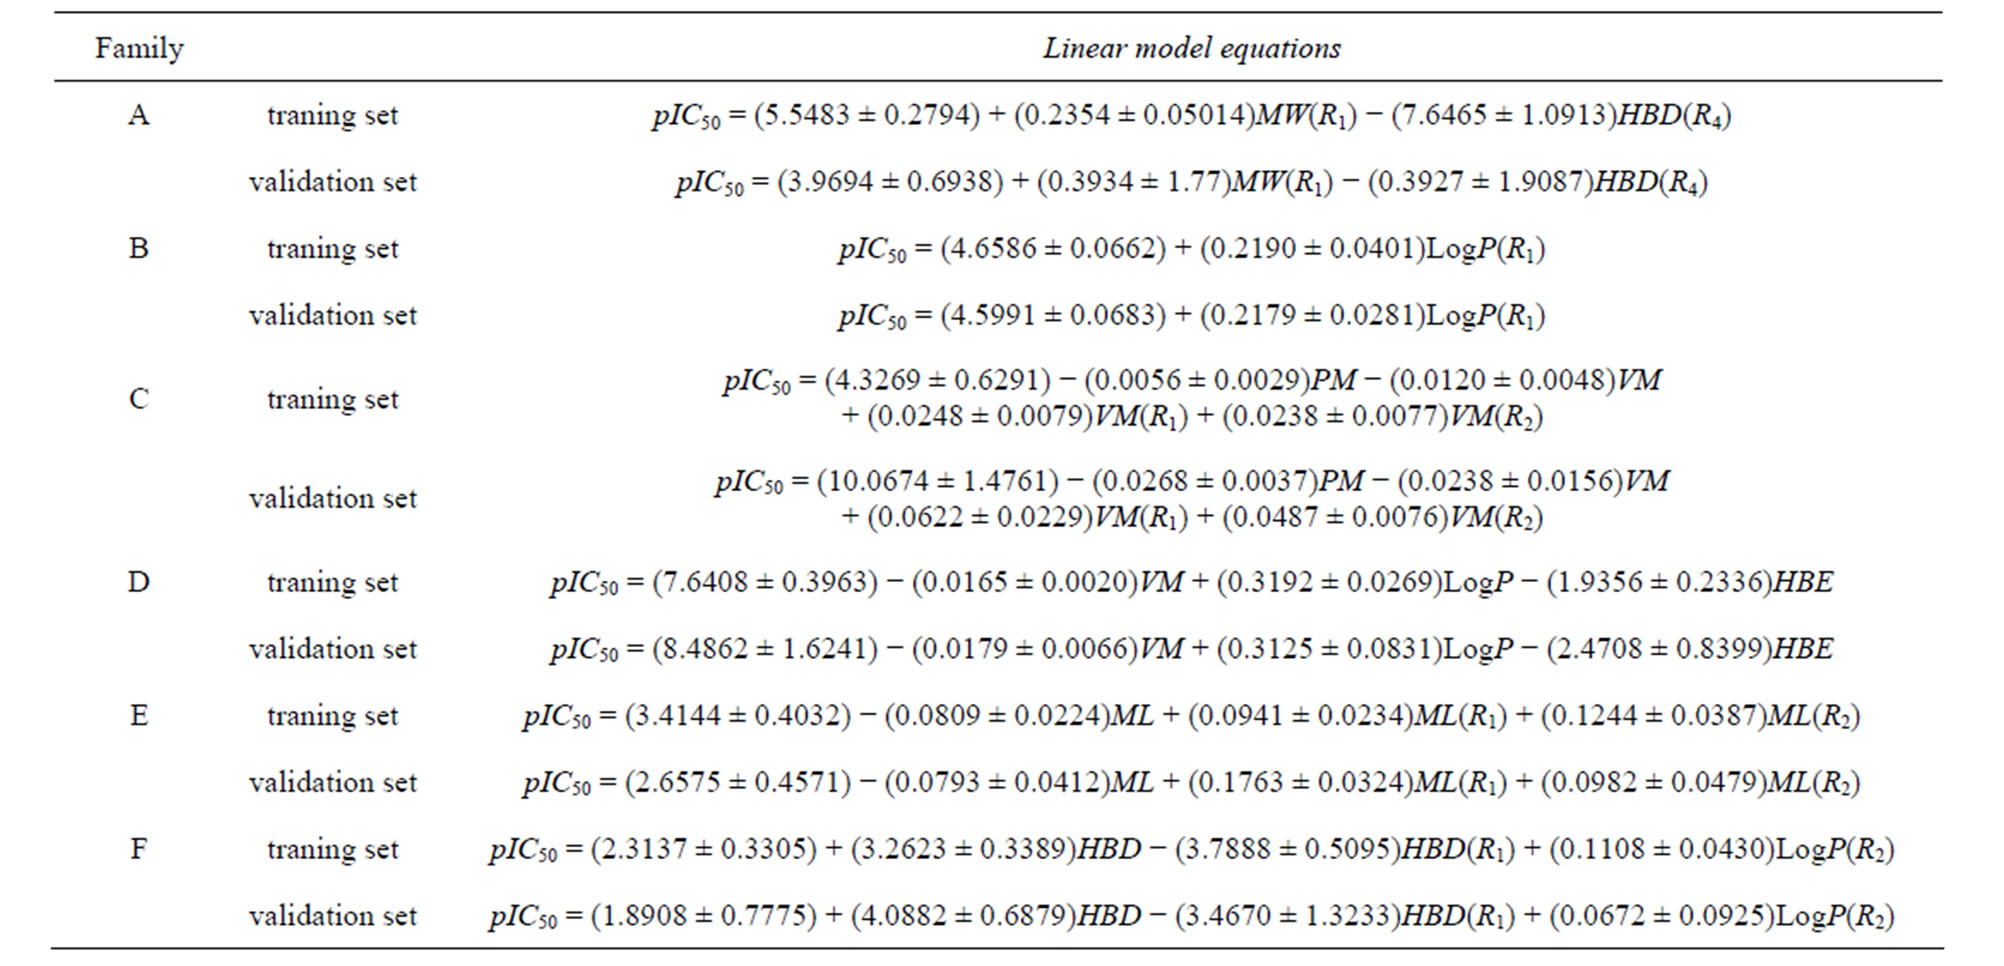
Table 2. Validated linear model equations of all datasets (Families A to F).
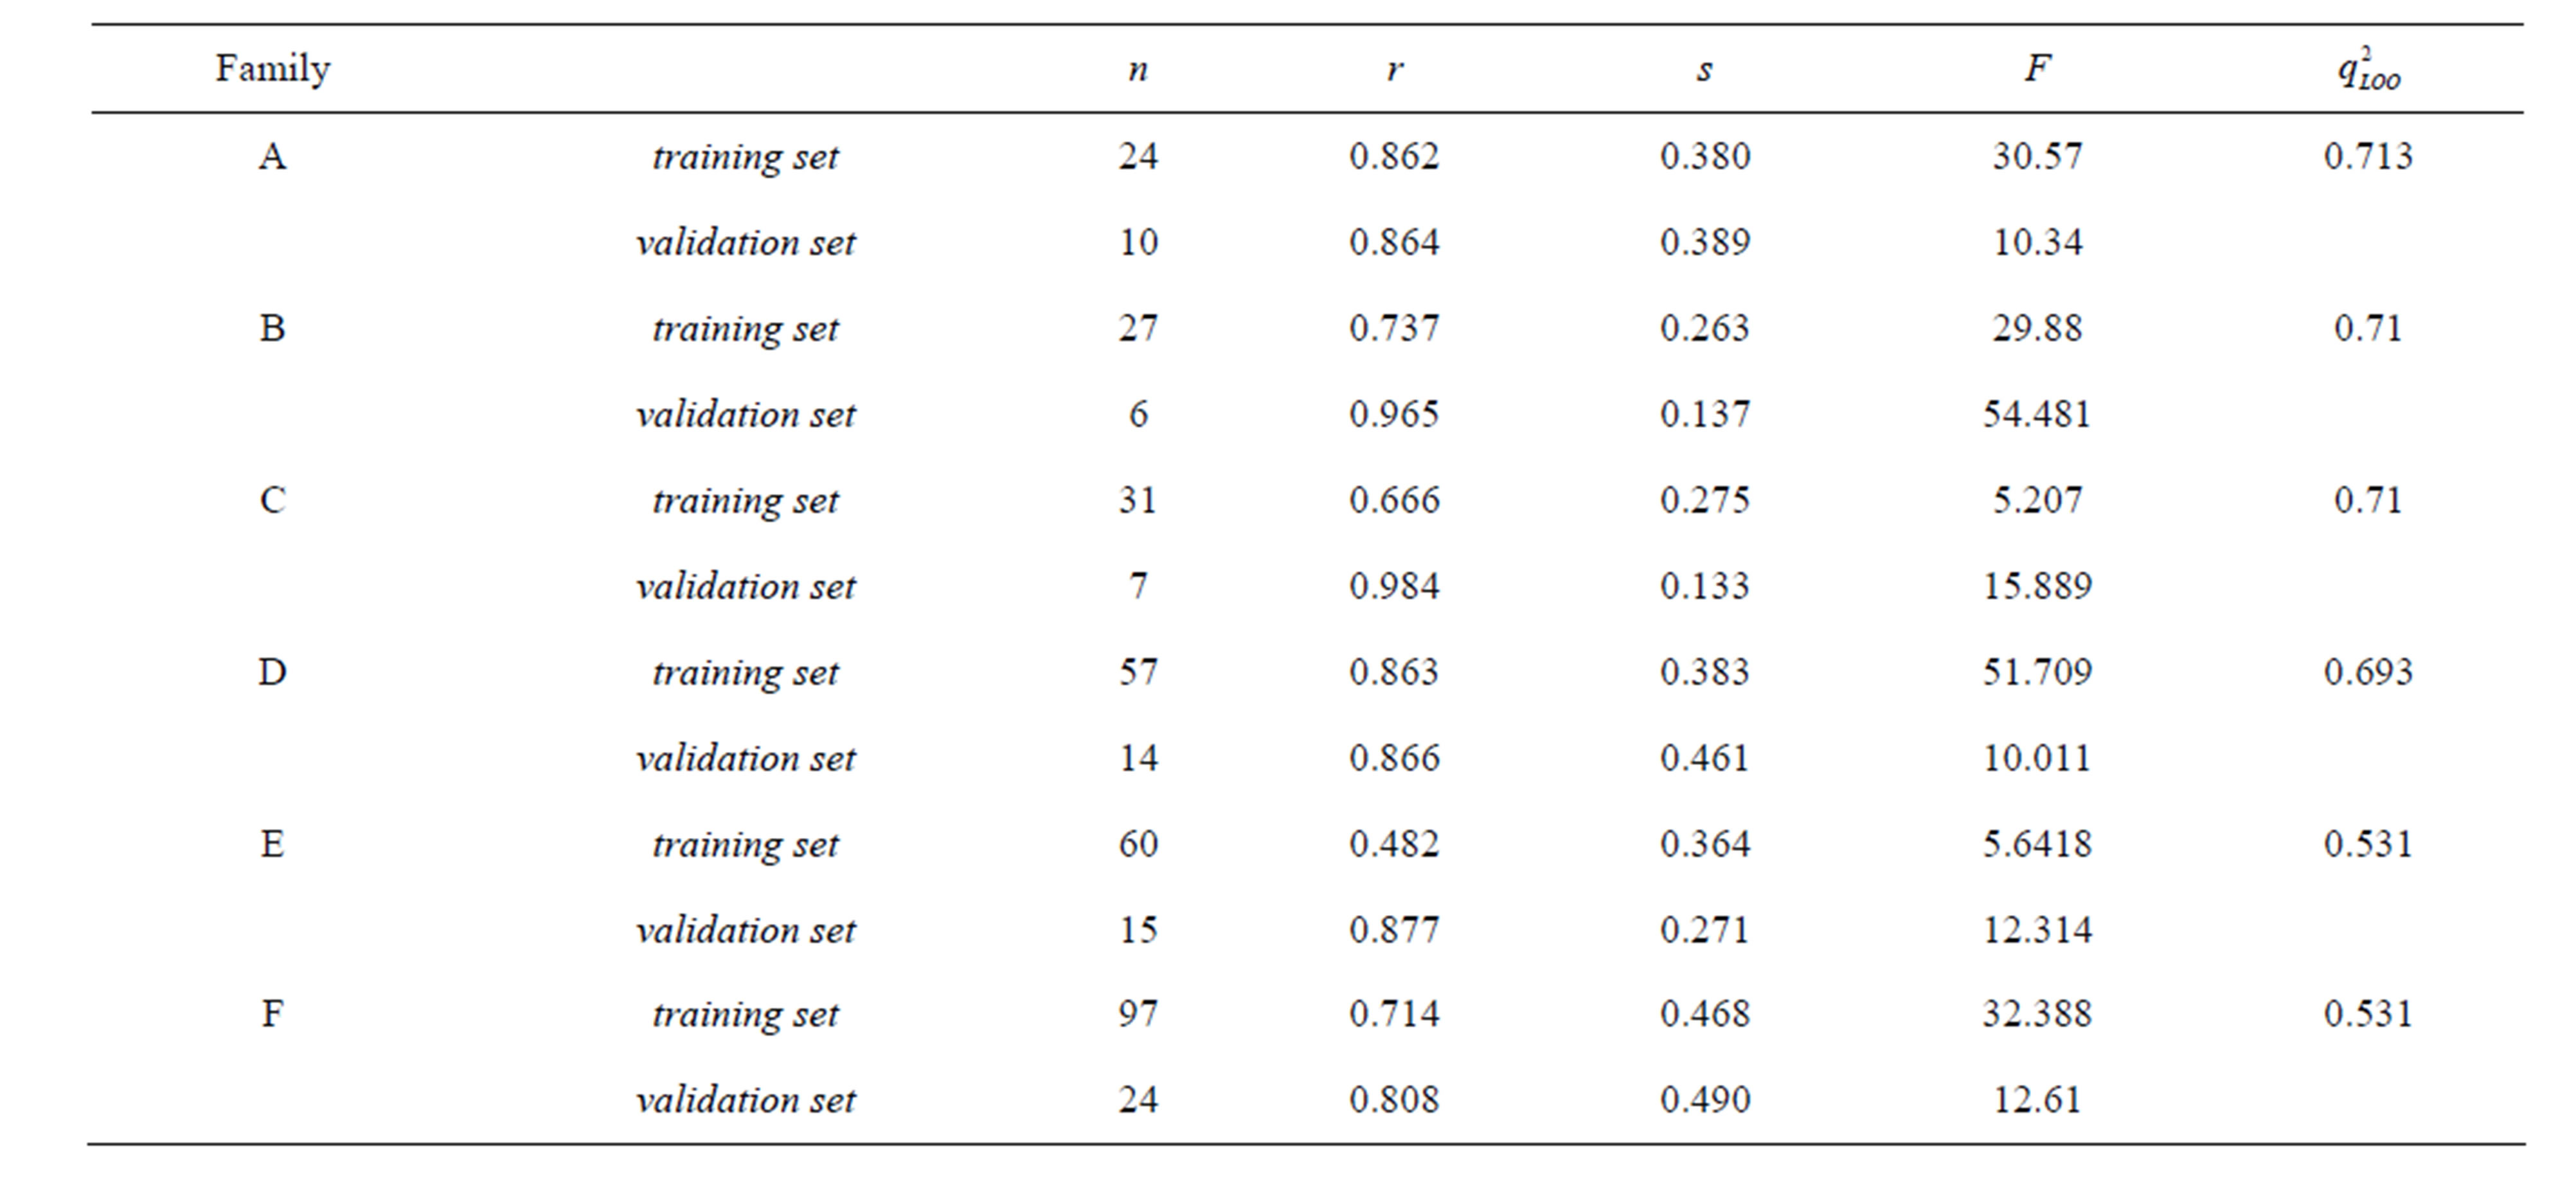
Table 3. Linear statistical results and leave-one-out cross-validation coefficient of all datasets (Families A to F).
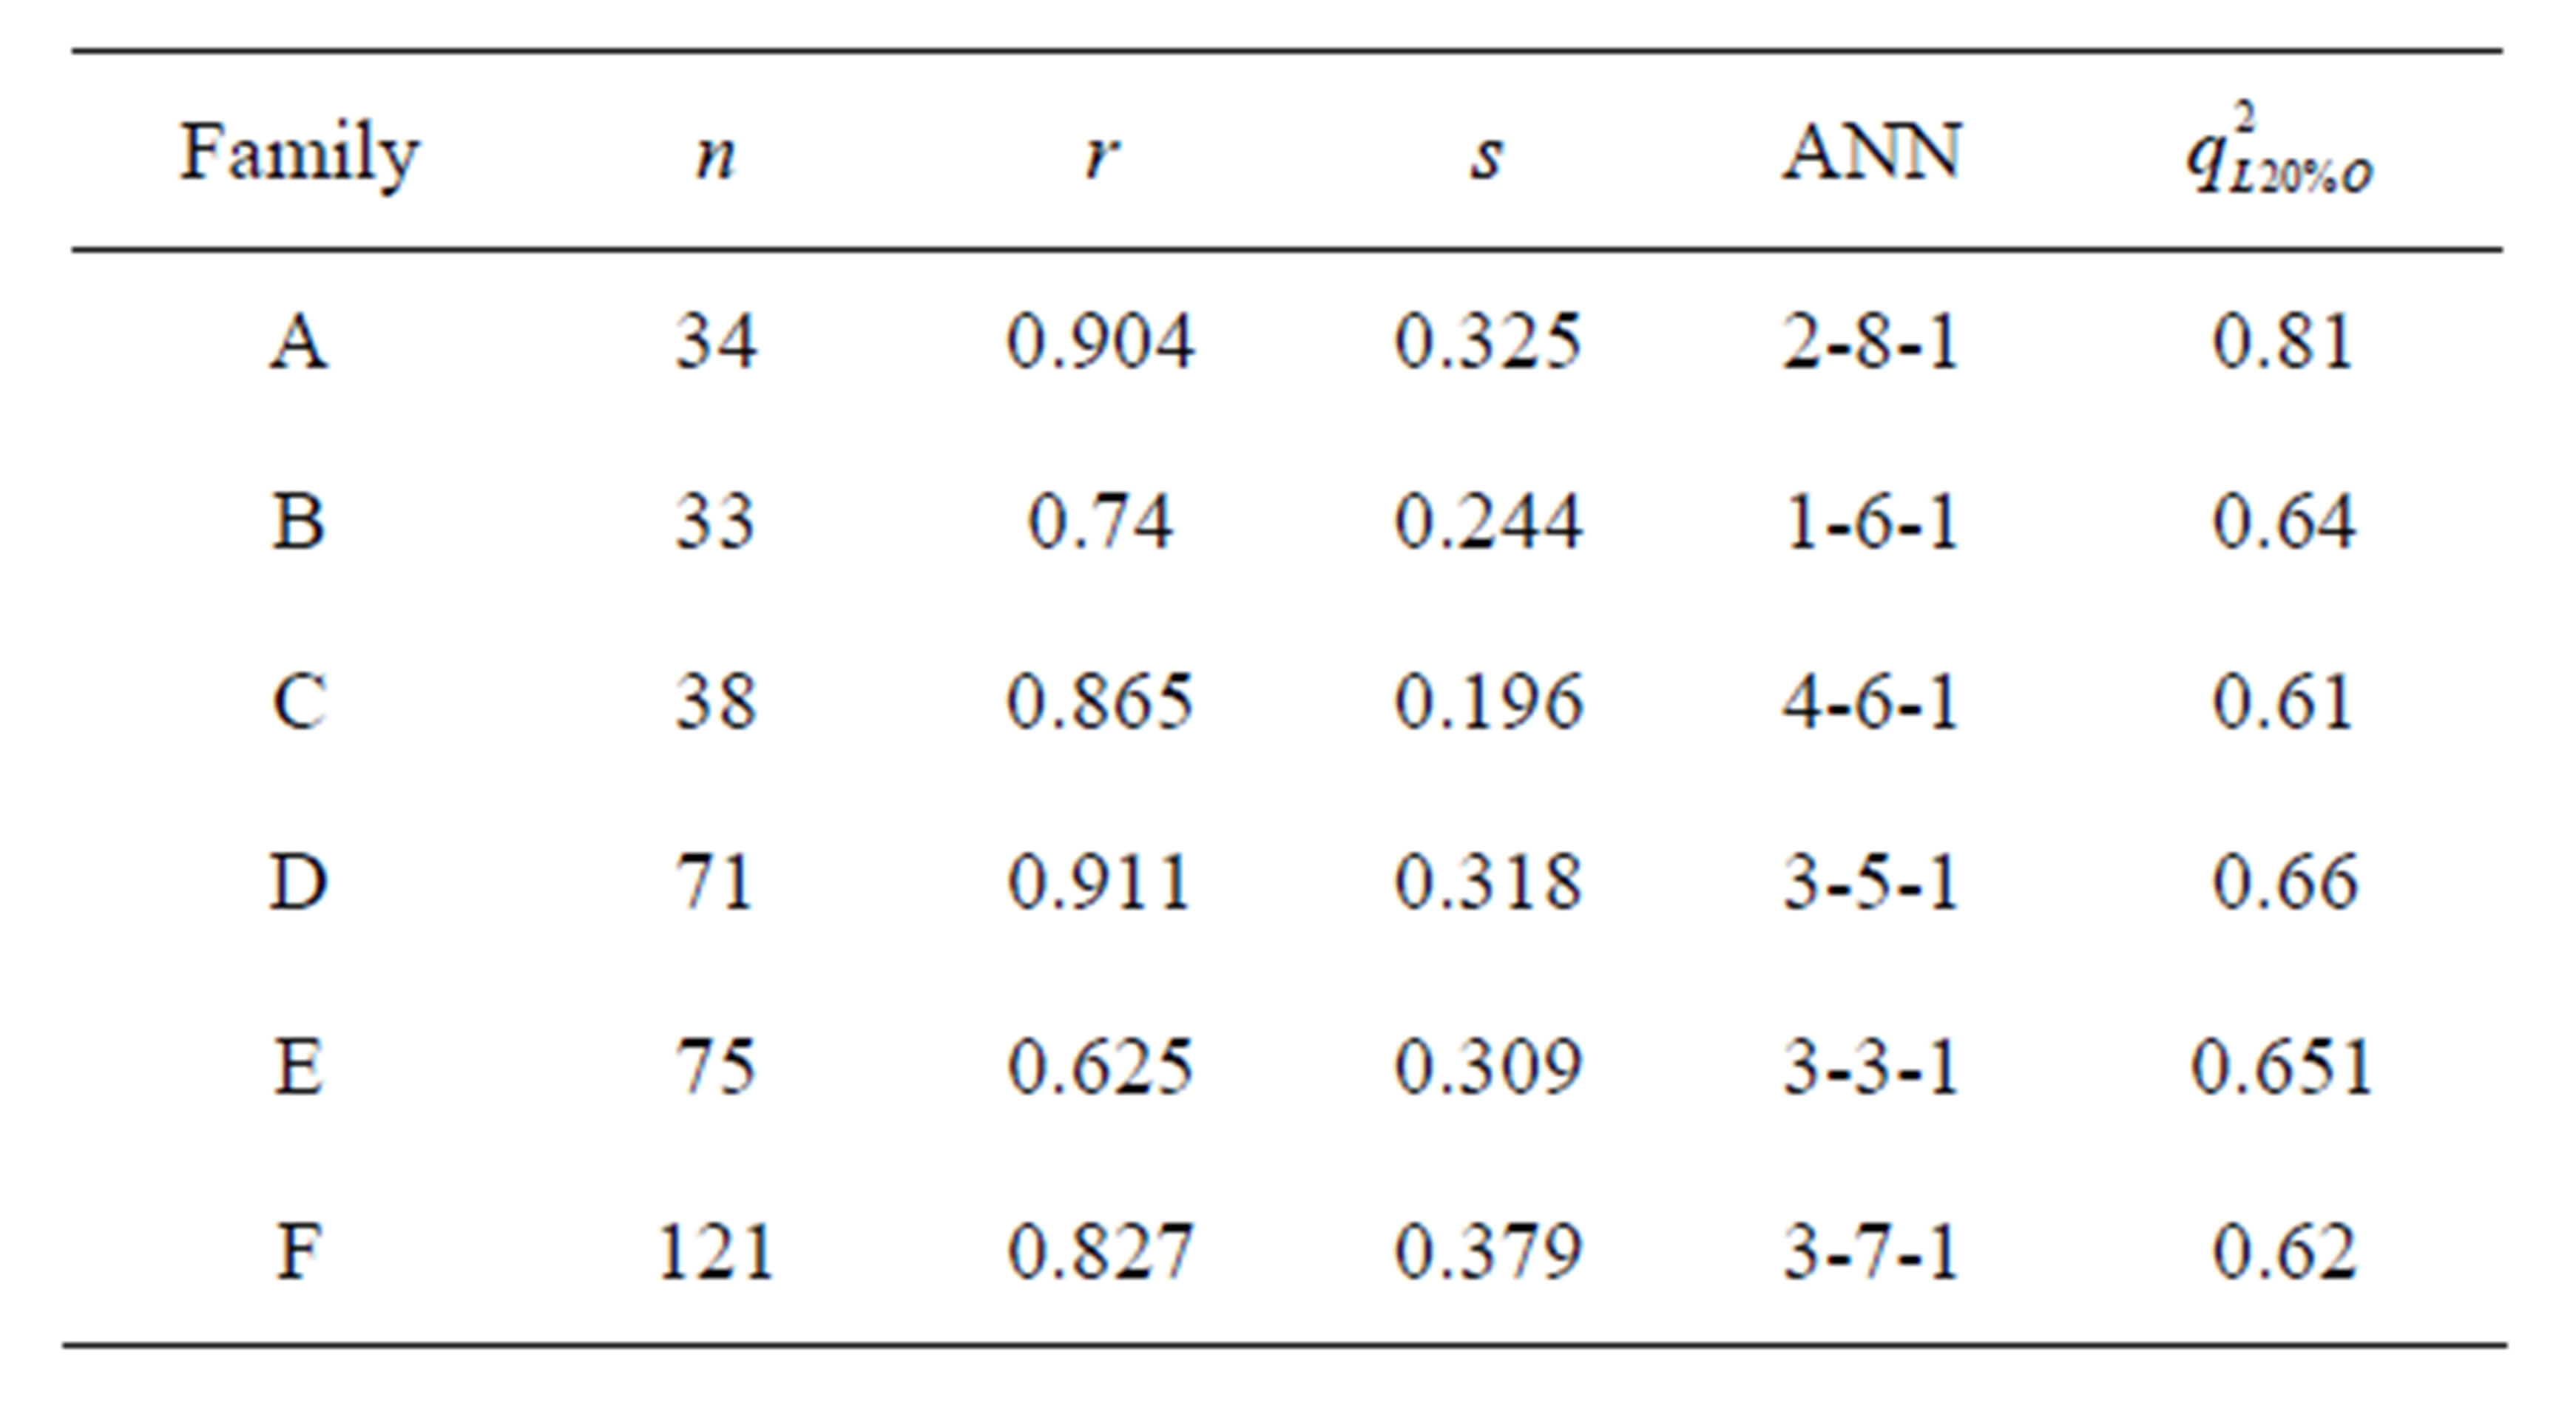
Table 4. Nonlinear statistical results and leave-20%-out cross-validation coefficient of all datasets (Families A to F).
us to conclude that inhibitors of SOAT-1 must submit electronic properties of hydrogen bond donor and lipophilicity of the side of the sulfonyl group of the molecule, and the larger contribution confirms these descriptors.
The 2D-QSAR study of Families B, C and E, has allowed us to validate the molecular weight, molecular volume of the molecule, the radical R1 and radical R2 as the 4 relevants descriptors with a contribution of 18%, 19.77%, 27.55% and 34.22% respectively for Family C. Family E has allowed us to validate the molecular length of the molecule, the radical R1 and the radical R2 as relevant descriptors with a contribution of 36.54%, 40.25% and 23.21% respectively.
We concluded that SOAT-1 inhibitors must present steric properties such as molecular volume and molecular length of the side of the sulfonyl group and the side of the carbonyl group of the molecule. The high contributions of these descriptors confirm it. Finally, from the 2D-QSAR studies of Families D, E and F, we concluded that the hydrogen bond donor of the molecule and the radical R1 with the lipophilicity of the radical R2 are the relevant descriptors with a contribution of 52.59%, 37.82% and 9.58% respectively.
We deduced that SOAT-1 inhibitors should exhibit properties of both electronic and steric hydrogen bond donor of the sulfonyl group side, namely the radical R1, and lipophilicity of the carbonyl group side, namely the radical R2 of the molecule. The high contribution of the hydrogen bond donor descriptor confirms that the inhibitory activity is mainly governed by the electronic properties.
On the other hand, comparison of linear (Table 5) and nonlinear results allowed us to conclude that the relationship between the chemical structure of N-CSI analogs and their inhibitory activity of the enzyme SOAT-1 is a non-linear relationship and the correlation coefficient values confirm it (rlinear < rnon-linear) share a Family B where the relationship is rather a linear relationship. By comparing the coefficients of cross-validation we find that nonlinear models are robust as q2 > 0.6 (depending on the conditions of WOLD [21]) and the two linear models (Families C and E) are not.
3.2. Three Dimensional Molecular Docking Studies of N-CSI Analogs
In order to study the pharmacodynamics of each molecule derived from 130 N-CSI analogs and find the best relationship between the inhibitor and the protein SOAT- 1, taking into account of interactions that exist before and after complex formation, we have performed a study of molecular docking with the program MOLEGRO.
We conducted an analysis of molecular docking of ten
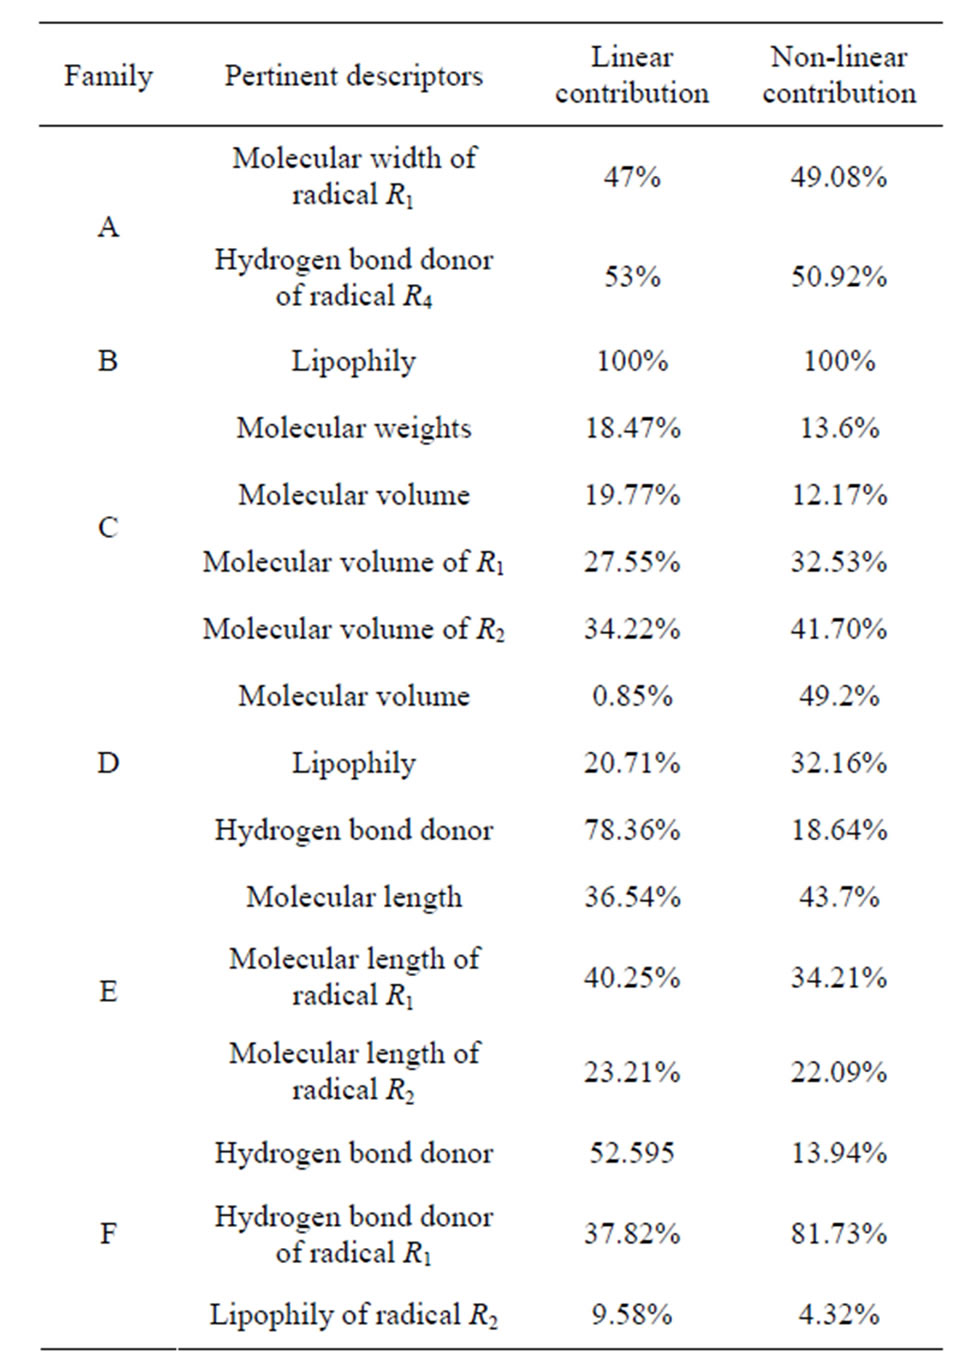
Table 5. Pertinent descriptors and their contributions in both linear and nonlinear analysis.
best SOAT-1 inhibitors. The molecules 1 to 10 show the chemical structures of ten molecules that have been selected for this analysis after lead identification analysis using MOLEGRO. We followed the methodology described above (see Section 8.3) in the methodology section.
By analyzing the results we find that the pose No 01 of the ligand “Binding_DB_50050205” has both a better scoring function −123.383 and better interaction of hydrogen bonds with a total energy of −5.86. The ligand “Bindin_DB_50050205” corresponds to the molecule 9 with reference “CHEMBL22415”.
By analyzing more closely the hydrogen interactions, we find that the ligand “CHEMBL22415” has three hydrogen bonds lengths 3.18, 3.02 and 2.67 with −1.174, −2.193 and −2.55 of energy respectively. The highlight of these hydrogen bonds in space (Figure 5) shows that the atoms of the urea function are the only responsible of this type of interaction.
In order to exhibit the effect of electrostatic and hydrophobic of radicals and the whole molecule on the pocket, we performed an analysis of these interactions with the program MOLEGRO. The results are shown in Figures 6 and 7. We conclude that the ligand has the electrostatic interactions of positive values on the left side of the cavity (shown in red) and negative electrostatic interactions values on the right side of the cavity (shown in blue).
Analysis of the hydrophobicity of the ligand in the cavity allowed us to conclude that the pocket has mainly hydrophobic regions (represented by the blue color Figure 7) and small areas rather hydrophilic outside the cavity (represented by the red color in the same figure). This high hydrophobicity of the cavity and the major scoring function of the ligand are vouched for the presence of aliphatic chains on the nitrogen atom of the urea function and isopropyl groups on the benzene ring.
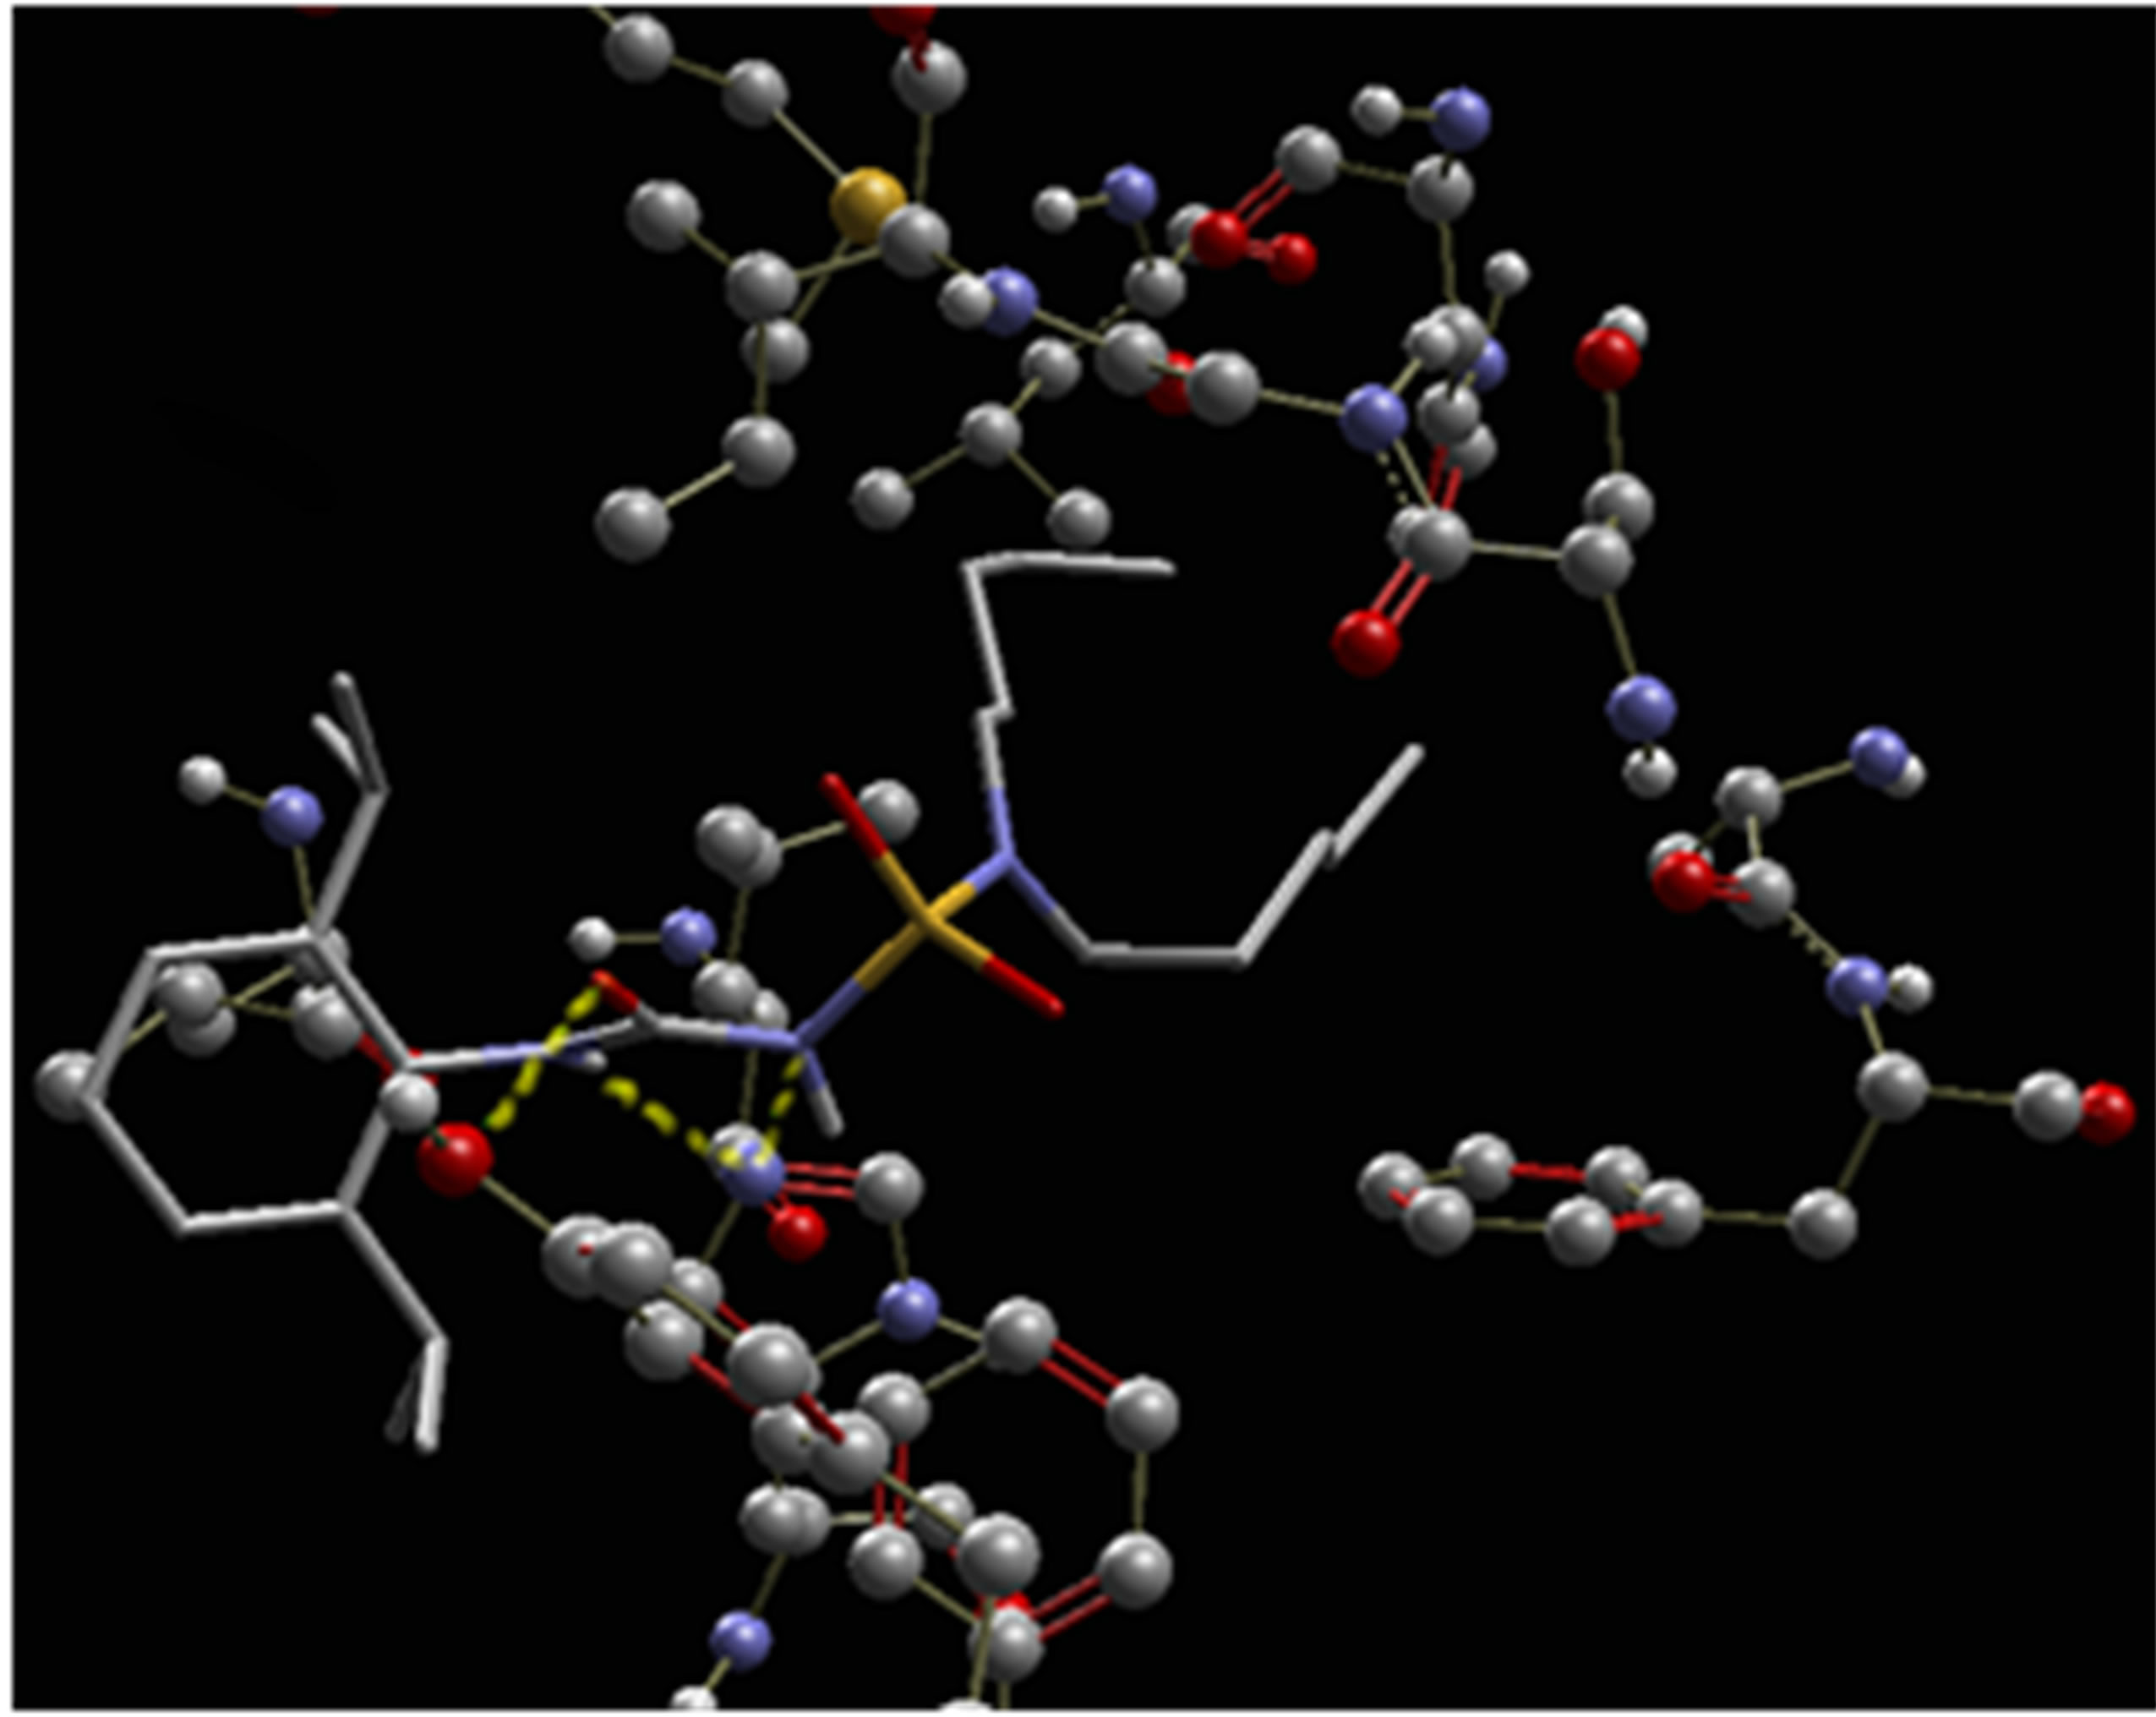
Figure 5. Highlighting three hydrogen bonds on the complex ligand-biological target (dashed lines in green).

Figure 6. Highlighting the electrostatic interaction between the ligand and the biological target.

Figure 7. Highlighting the hydrophobicity of the ligand with the biological target.
4. Conclusions
In this paper, we have demonstrated that the ligand (NCSI analogs) and the biological target (SOAT-1) have significant electronic interactions with the presence of three hydrogen bonds donor between the atoms of the urea function and the biological target. In addition, the presence of electrostatic and hydrophobic interactions is strongly justified by the presence of aliphatic chains on the nitrogen atom on urea function and the isopropyl radicals on the benzene ring. These results confirm the 2D-QSAR analysis.
Taken together, the 2D-QSAR model and the computational analysis of the pharmacodynamics properties described herein will constitute a valuable tool for the design of novel structurally related N-CSI inhibitors endowed with increased affinities toward SOAT-1 and improved ADME profiles.
REFERENCES
- N. Khelef, X. Buton, N. Beatini, H. Wang, V. Meiner, T. Y. Chang, R. V. Farese, F. R. Maxfield and I. Tabas, “Immunolocalization of Acyl-Coenzyme A: Cholesterol O-Acyltransferase in Macrophages,” The Journal of BioLogical Chemistry, Vol. 273, No. 18, 1998, pp. 11218- 11224. http://dx.doi.org/10.1074/jbc.273.18.11218
- V. Lather and A. K. Madan, “Predicting Acyl-Coenzyme A: Cholesterol O-Acyltransferase Inhibitory Activity: Computational Approach Using Topologicaldescriptors,” Drug Design and Discovery, Vol. 18, No. 4, 2003, pp. 117-122.
- M. A. Diczfalusy, I. Björkhem, K. Einarsson and S. E. Alexson, “Acyl-Coenzyme A: Cholesterol O-Acyltransferase Is Not Identical to Liver Microsomal Carboxylesterase,” Arteriosclerosis, Thrombosis, and Vascular Biology, Vol. 16, No. 4, 1996, pp. 606-610. http://dx.doi.org/10.1161/01.ATV.16.4.606
- P. Kursula, H. Sikkilä, T. Fukao, N. Kondo and R. K. Wierenga, “High Resolution Crystal Structures of Human Cytosolic Thiolase (CT): A Comparison of the Active Sites of Human CT, Bacterial Thiolase, and Bacterial KAS I,” Journal of Molecular Biology, Vol. 347, No. 1, 2005, pp. 189-201. http://dx.doi.org/10.1016/j.jmb.2005.01.018
- B. Ferraz-de-Souza, R. E. Hudson-Davies, L. Lin, R. Parnaik, M. Hubank, M. T. Dattani and J. C. Achermann, “Sterol O-Acyltransferase 1 (SOAT1, ACAT) Is a Novel Target of Steroidogenic Factor-1 (SF-1, NR5A1, Ad4BP) in the Human Adrenal,” The Journal of Clinical Endocrinology & Metabolism, Vol. 96, No. 4, 2011, pp. 663- 668.
- M. R. Lafave, L. Katz, T. Donnon and D. J. Butterwick, “Initial Reliability of the Standardized Orthopedic Assessment Tool (SOAT),” Journal of Athletic Training, Vol. 43, No. 5, 2008, pp. 483-488. http://dx.doi.org/10.4085/1062-6050-43.5.483
- K. Hsieh, Y. K. Lee, C. Londos, B. M. Raaka, K. T. Dalen and A. R. Kimmel, “Perilipin Family Members Preferentially Sequester to Either Triacylglycerol-Specific or Cholesteryl-Ester-Specific Intracellular Lipid Storage Droplets,” Journal of Cell Science, Vol. 125, No. 17, 2012, pp. 4067-4076. http://dx.doi.org/10.1242/jcs.104943
- W. S. Lee, K.-R. Im, Y.-D. Park, N.-D. Sung and T.-S. Jeong, “Human ACAT-1 and ACAT-2 Inhibitory Activities of Pentacyclictriterpenes from the Leaves of Lycopuslucidus TURCZ,” Biological & Pharmaceutical Bulletin, Vol. 29, No. 2, 2006, pp. 382-384. http://dx.doi.org/10.1248/bpb.29.382
- A. Miyazaki, N. Sakashita, O. Lee, K. Takahashi, S. Horiuchi, H. Hakamata, P. M. Morganelli, C. C. Chang and T. Y. Chang, “Expression of ACAT-1 Protein in Human Atherosclerotic Lesions and Cultured Human Monocytes-Macrophages,” Arteriosclerosis, Thrombosis, and Vascular Biology, Vol. 18, No. 10, 1998, pp. 1568-1574. http://dx.doi.org/10.1161/01.ATV.18.10.1568
- S. Saha, S. R. Bornstein, J. Graessler and S. Kopprasch, “Very-Low-Density Lipoprotein Mediates Transcriptional Regulation of Aldosterone Synthase in Humanadrenocortical Cells,” Cell and Tissue Research, Vol. 348, No. 1, 2012, pp. 71-80. http://dx.doi.org/10.1007/s00441-012-1346-3
- Y. Asami, I. Yamagishi, S. Murakami, H. Araki, K. Tsuchida and S. Higuchi, “HL-004, the ACAT Inhibitor, Prevents the Progression of Atherosclerosis in CholesterolFed Rabbits,” Life Sciences, Vol. 62, No. 12, 1998, pp. 1055-1063. http://dx.doi.org/10.1016/S0024-3205(98)00028-9
- N. Sakashita, A. Miyazaki, M. Takeya, S. Horiuchi, C. C. Y. Chang, T.-Y. Chang and K. Takahashi, “Localization of Human Acyl-Coenzyme A: Cholesterol Acyltransferase-1 (ACAT-1) in Macrophages and in Various Tissues,” The American Journal of Pathology, Vol. 156, No. 1, 2000, pp. 227-236. http://dx.doi.org/10.1016/S0002-9440(10)64723-2
- J. Liao and J. A. Farmer, “Aggressive Statin Therapy and the Risk of Malignancy,” Current Atherosclerosis Reports, Vol. 15, No. 4, 2013, p. 316. http://dx.doi.org/10.1007/s11883-013-0316-x
- R. A. Kendall, E. Aprà, D. E. Bernholdt, E. J. Bylaska, M. Dupuis, G. I. Fann, R. J. Harrison, J. Ju, J. A. Nichols, J. Nieplocha, T. P. Straatsma, T. L. Windus and A. T. Wong, “High Performance Computational Chemistry: An Overview of NWChem a Distributed Parallel Application,” Computer Physics Communications, Vol. 128, No. 1-2, 2000, pp. 260-283. http://dx.doi.org/10.1016/S0010-4655(00)00065-5
- H. Kubinyi, “QSAR and 3D QSAR in Drug Design. Part 1: Methodology,” Drug Discovery Today, Vol. 2, No. 11, 1997, pp. 457-467. http://dx.doi.org/10.1016/S1359-6446(97)01079-9
- P. Kolb, R. S. Ferreira, J. J. Irwin and B. K. Shoichet, “Docking and Chemoinformatic Screens for New Ligands and Targets,” Current Opinion in Biotechnology, Vol. 20, No. 4, 2009, pp. 429-436. http://dx.doi.org/10.1016/j.copbio.2009.08.003
- L. Xue and J. Bajorath, “Molecular Descriptors in Chemoinformatics, Computational Combinatorial Chemistry, and Virtual Screening,” Combinatorial Chemistry & High Throughput Screening, Vol. 3, No. 5, 2000, pp. 363-372. http://dx.doi.org/10.2174/1386207003331454
- J. A. Picard, P. M. O’Brien, D. R. Sliskovic, M. K. Anderson, R. F. Bousley, K. L. Hamelehle, B. R. Krause and R. L. Stanfield, “Inhibitors of Acyl-CoA: Cholesterol O-Acyltransferase. 17. Structure-Activity Relationships of Several Series of Compounds Derived from N-Chlorosulfonylisocyanate,” Journal of Medicinal Chemistry, Vol. 39, No. 6, 1996, pp. 1243-1252. http://dx.doi.org/10.1021/jm9509455
- X. Li, “A Simulation Evaluation of Backward Elimination and Stepwise Variable Selection in Regression Analysis,” M.S. Thesis, Shandong Polytechnic University, Shandong, 2012.
- P. A. Babu, V. T. S. S. Colluru and N. Anaparthy, “InSilico Characterization of ECE-1 Inhibitors,” Computers in Biology and Medicine, Vol. 42, No. 4, 2012, pp. 446- 457. http://dx.doi.org/10.1016/j.compbiomed.2011.12.013
- D. J. Livingstone and D. T Manallack, “Statistics Using Neural Networks: Chance Effects,” Journal of Medicinal Chemistry, Vol. 36, No. 9, 1993, pp. 1295-1297. http://dx.doi.org/10.1021/jm00061a023
NOTES
*Corresponding author.