Open Journal of Medicinal Chemistry
Vol.3 No.1(2013), Article ID:29475,9 pages DOI:10.4236/ojmc.2013.31002
Using Multiple Linear Regression and Artificial Neural Network Techniques for Predicting CCR5 Binding Affinity of Substituted 1-(3, 3-Diphenylpropyl)-Piperidinyl Amides and Ureas
1Laboratoire de Catalyse, Chimiométrie et Environnement, Faculté des Sciences et Techniques Mohammedia (URAC24), Université Hassan II Mohammedia-Casablanca, Casablanca, Maroc
2Laboratoire de Chimie Organique, Catalyse et Environnement, Faculté des Sciences Ben M’sik, Université Hassan II Mohammedia-Casablanca, Casablanca, Maroc
Email: *mzahouily@yahoo.fr
Received September 4, 2012; revised October 8, 2012; accepted October 24, 2012
Keywords: Artificial Neural Network, Descriptors; CCR5; Multiple Linear Regression; Structure-Activity Relationship
ABSTRACT
Quantitative structure–activity relationship (QSAR) models were developed to predict for CCR5 binding affinity of substituted 1-(3, 3-diphenylpropyl)-piperidinyl amides and ureas using multiple linear regression (MLR) and artificial neural network (ANN) techniques. A model with four descriptors, including Hydrogen-bonding donors HBD(R7), the partition coefficient between n-octanol and water logP and logP(R1) and Molecular weight MW(R7), showed good statistics both in the regression and artificial neural network with a configuration of (4-3-1) by using Bayesian and Levenberg-Marquardt Methods. Comparison of the descriptor’s contribution obtained in MLR and ANN analysis shows that the contribution of some of the descriptors to activity may be non-linear.
1. Introduction
With rapid progress in exploration of HIV infection processes, it was found by recent studies that in addition to the CD4 receptor, a new class of seven-membranedomain receptors called chemokine receptors was proved to play a crucial role in the membrane-fusion stage of HIV infection. In the early stage of HIV infection, the virus tends to attack the immune cells by sequentially binding to the CD4 receptor and chemokine receptors on the cell surface, then the membrane-infusion can be achieved. Recognized as a member of the chemokine receptor family, CCR5 was discovered to be utilized in the early stage of the replication cycle by the most commonly transmitted M-tropic strains of HIV-1. Notable findings showed that a few individuals genetically bearing a defective CCR5 allele were protected from HIV-1 infection without any unhealthy consequence. Hence the idea of setting CCR5 as a possible target for therapeutic intervention was brought up and well supported by evidence that blocking the function of CCR5 could strongly inactivate HIV virus, resulting in effectively prevention of HIV-1 entering into cells while exhibiting few side effects.
On the basis of these studies mentioned above, extensive exploration into this potential target for anti-HIV treatments has motivated the development of some CCR5 inhibitors as a new group of anti-HIV therapeutics [1].
CC chemokine receptor 5 (CCR5) is the major coreceptor, in addition to CD4, accountable for the entry of human immunodeficiency virus type 1 (HIV-1) and simian immunodeficiency virus (SIV) into host cells. It belongs to the G-protein-coupled, seven-transmembrane receptor family and it is the natural target for certain proinflammatory chemokines like RANTES, MIP-1α and MIP-1β [2].
Homozygous individuals with a 32-base pair deletion in the gene encoding CCR5 do not express the functional receptor and are ultimately resistant to R5-tropic HIV-1 infection [3]. These facts have inspired a great amount of research over the past decade to identify anti-HIV-1 therapeutics targeting the CCR5-mediated entry mechanism [3].
By means of rational drug design methods, this paper aims to work on a series of active CCR5 inhibitors binding to the receptor and provide better understanding of structure-activity relationships of CCR5 receptor and its inhibitors, which may offer some practical guidelines for further modification of CCR5 antagonists.
The main steps involved in developing a new model are:
1) Selection of the data set;
2) Calculation of molecular descriptors;
3) Fitting the statistical model;
4) Validation of the model [4].
The techniques which can be applied for construction of model, such as multiple linear regression and artificial neural networks, that were used for inspection of linear and nonlinear relation between interested activity and molecular descriptors, respectively [5].
2. Materials and Methods
2.1. Biological Data
The chemical structures along with observed activity data of the compounds used in this study are shown in Table 1. The activity data were taken from various published studies [6,7].
2.2. Molecular Descriptors
A set of common molecular descriptors related to physicochemical, electronic and geometric properties of the molecules was used for this study. As all the compounds studied have a common skeleton, we found it judicious to
Table 1. Structures of molecular and their biological activities 


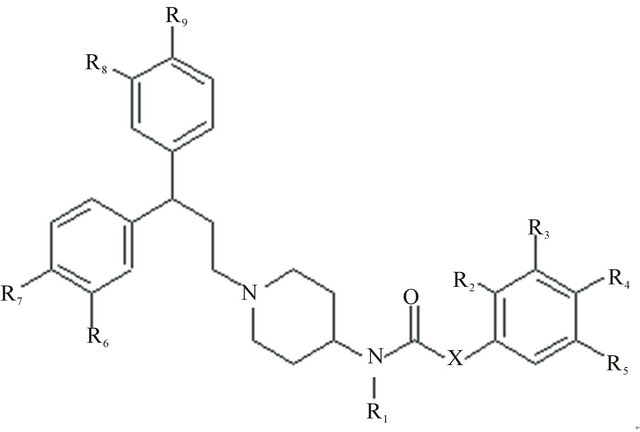
Figure 1. Basic structure.
describe the molecule by means of properties of the substituents (R1, R2, R3, R4, R5, R6, R7, R8, R9 and X) attached to the basic skeleton (Figure 1). Determination of the pertinent properties for a given substituent may be useful for evaluating local interactions between the molecule and the receptor site.
Moreover, we tried to take into account properties of the molecule such as its molecular weight, size, height etc. This is justified by the fact that, before their possible interaction with a given receptor site, the molecules must be transported through many liquid layers and correct general dimensions for site access [8].
Molecular properties used for each substituents were:
• Size and shape described by means of van der waals volume (V) and surface (S) [9].
• Molecular dimension (length, width and height). Length (L) is the distance along the screen x-axis between the left and right most atoms plus their van der Waals radii. Width (W): is the distance along the screen y-axis between the top and bottom most atoms plus their van der Walls radii. Height (H): is the distance along the screen z-axis between the nearest and farthest atoms plus their van der Waals radii.
• Ratios V/L, V/W, W/H were also calculated.
• logP, the partition coefficient between n-octanol and water.
• Molar refractivity (MR) [10].
• Hydrogen-bonding donors (HBD) and hydrogen-bonding acceptors (HBA).
All these descriptor were calculated with the demo version of the molecular modelling program (MMP).
3. Statistical Methods
3.1 Stepwise Multiple Linear Regression@NolistTemp# This method was used to generate linear models between the activity and the molecular descriptors used. Because of the large number of descriptors considered, a stepwise procedure combining the forward and backward algorithms was used to select the pertinent descriptors [11]. The predictive activity of the model is quantified in terms of 

In this equation  and
and  are the predicted and the experimental values of the target property for the observation
  respectively. The mean value of target property is noted as
 ![]() [12] and
[12] and  is the internal correlation coefficient.
3.2. Cross-Validation Technique
Since a high-correlation coefficient only indicates how well the equations fit the data, cross-validation procedure [13] was carried out in order to explore the reliability of the proposed models. In this aspect, the well-known “leave-one-out” (LOO) approach was used in which a number of models were developed with one sample ignored each time. Then, the ignored data were predicted by each model and the differences between predicted and observed activity values were evaluated. The LOO crossvalidation coefficient  that is given by Equation (2) was used as an indicator of the predictive performance and stability of a model. In general, LOO cross-validated coefficient
  being higher than 0.5 can be considered as a statistical proof of the high-predictive ability [14]. The formulae used to calculate the aforementioned statistics are presented below [15] (Equation (2))

In the case of LMO, M represents a group of randomly selected data points which would leave out at the beginning and would be predicted by the model which was developed using the remaining data points. So, M molecules are considered as prediction set. The  can be calculated by Equation (3) [16]:

where in yexp and ypred are the observed and predicted values for the dependent variables, respectively, and y is the average observed value [14].
3.3. Quality of Fit and Predictive Ability of a QSAR Model
The statistical quality of the equations was judged by different parameters [17] like square of correlation coefficient , explained variance
 , standard error of estimate
  and variance ratio
  at specified degrees of freedom
  [18].
[18].
3.4. Artificial Neural Network Model
ANN is a massive parallel-distributed information processing system that has certain performance characteristics, resembling biological neural networks of the human brain. ANN has been developed as a generalization of mathematical models of human cognition and neural biology [19]. The available data set is partitioned into two parts, one corresponding to training and the other corresponding to test of the model. The purpose of training is to determine the set of connection weights and nodal thresholds that cause the ANN to estimate outputs that are sufficiently close to target values. This fraction of the complete data to be employed for training should contain sufficient patterns so that the network can mimic the underlying relationship between input and output variables adequately [20].
The network consists of an input layer, an output layer and a number of hidden layers. At each node in a layer the information is received, stored, processed and communicated further to nodes in the next layer. All the weights are initialized to small random numeric values at the beginning of training. These weights are updated or modified iteratively using the generalized delta rule or steepest-gradient descent principle. The training process is stopped when no appreciable change is observed in the values associated with the connection links or some termination criterion is satisfied. Thus, the training of aback-propagation network consists of two phases: a forward pass during which the processing of information occurs from the input layer to the output and a backward pass when the error from the output layer is propagated back to the input layer and the interconnections are modified [21].
An example of a network topology is shown in Figure 2 [22].
4. Results and Discussion
4.1. Multiple Linear Regression Analysis
MLR analysis was performed on the compounds described in Table 1; we have included all 65 molecules of the training set for the model generation.
After collecting the data, we submitted all parameters to regression; a few suitable models were obtained. The best model is shown in Equation (4):
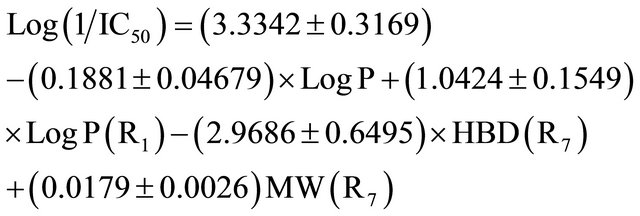
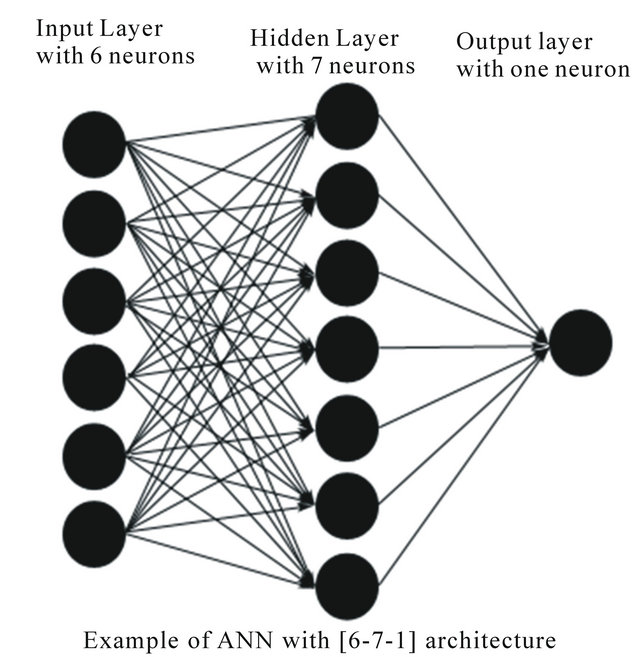
Figure 2. Example of an artificial neural network topology with one input layer, one hidden layer and one output layer.


*LogP: Hydrophobic descriptor for all the molecular, LogP(R1): Hydrophobic descriptor for the substituent 1, HBD(R7): Hydrogen-bonding donors for the substituent 7 and MW(R7) : Molecular weight for the substituent 7.
We take away the one molecule having  higher than
  as defined in Equation (5):
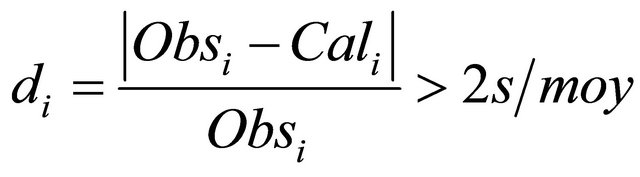
With  is the mean of the observed activity. Consequently, a new regression model was derived using 64 molecules Equation (6):
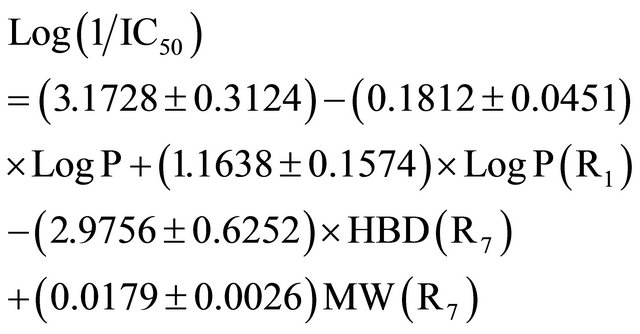

*LogP: Hydrophobic descriptor for all the molecular, Log P(R1): Hydrophobic descriptor for the substituent 1, HBD(R7): Hydrogen-bonding donors for the substituent 7 and MW(R7): Molecular weight for the substituent 7.
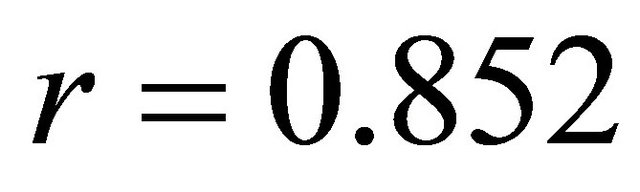
In QSAR equations, n is the number of data points, r is the correlation coefficient between observed values of the dependent and the values calculated from the equation, r2 is the square of the correlation coefficient and represents the goodness of fit, q2 is the cross-validated r2 (a measure of the quality of the QSAR model), and s is the standard deviation [23].
The 64 active compounds were randomly divided into a training set of 43 compounds and a test set of 21 compounds. The training set compounds were used to develop a QSAR model, and the test set compounds were used to validate the reliability and the predictive ability of the model (Table 2).
In the above results, the most significant variable is Hydrogen-bonding donors descriptor , following by the contribution of the
  and
and , respectively. Molecular weights contribute poorly. This result is justified by calculating the descriptors contribution (Table 3), according to the method of Gore (1952). [24,25] (Equation (7)):

With:  Regression coefficient for descriptor
 Standard deviation for descriptor
 .
.
• Fraction of the variance : It is believed that the closer the value of r2 to unity, the better the QSAR model. The value of r2 for this QSAR model is 0.8364 which suggest that these QSAR model explain 83.64% of the variance in the data. According to the literature, the predictive QSAR model must have
 .
.
• Cross-validation test: The values of  for these QSAR models are 0.72 with multiple regressions in the other hand; the value
  is 0.724 with artificial neural network. The high values of q2 validate these QSAR models. According to the literature, the predictive QSAR model must have
  [26].
[26].
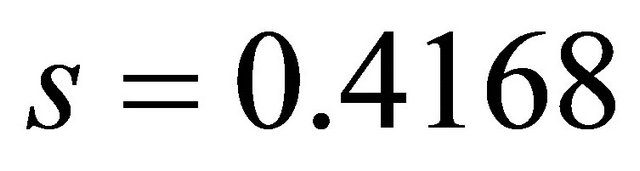
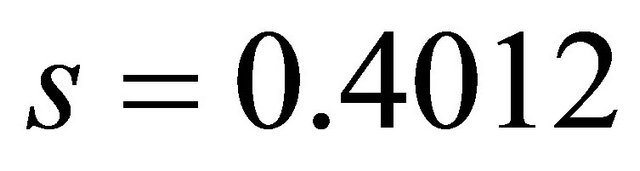
• Standard deviation(s): s is the standard deviation
• about the regression line. The smaller the value of s the better the QSAR model. The value of s for this QSAR model is 0.4168.
• Fischer statistics (F): Fischer statistics (F) is the ratio between explained and unexplained variance for a given number of degree of freedom. The larger the value of F the greater the probability that the QSAR model is significant.
The result of the credibility test of 64 molecules shows that the descriptors used express the activity studied very well because the statistical quality of the model decreases dramatically. The correlation coefficient, standard deviation and Fischer statistics pass are respectively  to
to . Finally, the plot of experimental and predicted values of activity (Figure 3) from multiple linear regressions showed a good fitting function.
4.2. Artificial Neural Network (ANN)
As a second step, we were interested to investigate the non-linear characteristics of the activity parameter. Therefore, a back propagation artificial neural network [19] was developed using the descriptors appearing in the MLR model as its inputs.
The optimal architecture of the selected NN model was [4-3-1] after optimization study (Figure 4), which means that the model had 4 input neurons in the input layer (the selected descriptors), 3 hidden neurons in the hidden layer, and one neuron in the output layer. Data set was separated into two groups: training and test sets.
The training set, consisted of 43 molecules, was used
Table 2. Validation tests of the reliability and predictive ability of model.
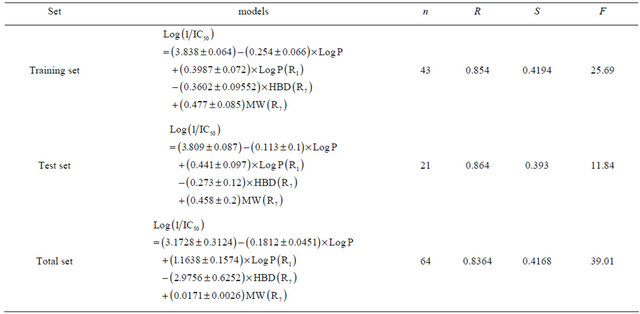
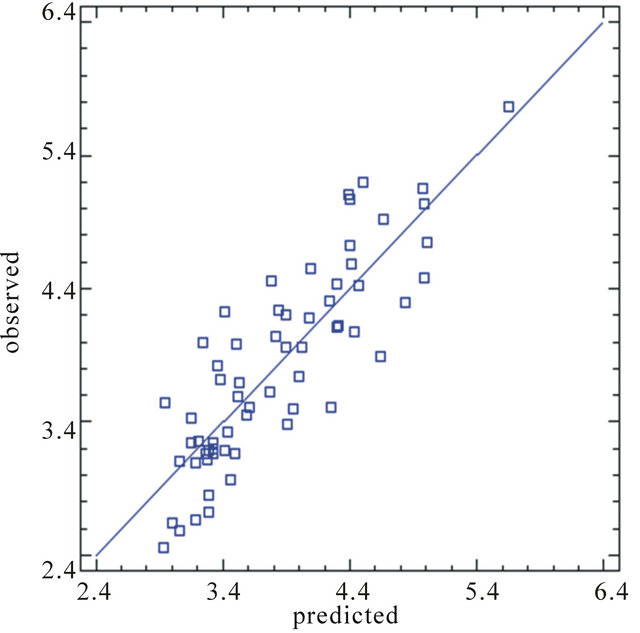
Figure 3. Experimental and predicted value from MLR.

Figure 4. Error as a function of the number of iterations (epochs).
Table 3. Descriptors contribution in Equation (6).

for the model generation. However, the test set, consisted of 21 molecules, was used to take care of the overtraining.
The standard deviation between calculated and observed activity was 0.345 by using Levenberg-Marquardt Method, which was found to be superior that obtained using MLR . In addition, the correlation coefficient square between observed and calculated value 0.8724 by using Levenberg-Marquardt Methods.
Finally, the plot of experimental and predicted values of activity (Figure 5) from artificial neural network showed a good fitting function.
4.3. Analysis of Descriptor’s Contribution in ANN Model
The contribution of descriptors  was estimated from the [4-3-1] neural network architecture. The descriptor under study was removed from the [4-3-1] calculated the output of each molecule as usual. The mean of the deviations absolute values
  between the observed activity and the estimated one for all compounds was calculated. This process was reiterated for each descriptor. Finally, the contribution
  of each descriptor
  is given by Equation (8) [27]:

With:  Mean value of absolutes deviations between predicted and calculated activity.
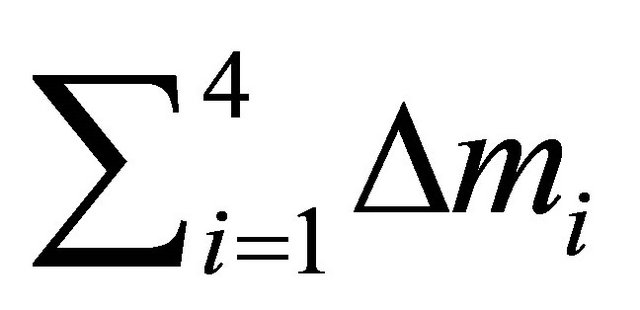 Sum of means values of absolutes deviations between predicted and calculated activity for 4 descriptors.

Figure 5. Experimental and predicted value from ANN.
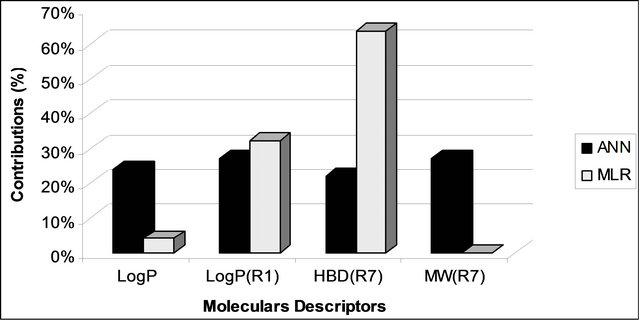
Figure 6. Comparison of descriptors contribution in the ANN and MLR models.
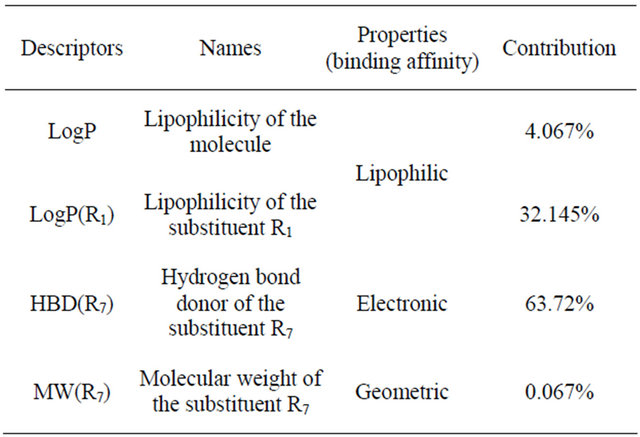
Table 4. Property of the physicochemical descriptors and their contributions.
According to the results above (Figure 6), it appears that LogP have the same classification in the two methods (MLR and ANN) used but the other descriptors have changed order . These results indicate the existence of non-linear relationships between activity and molecular descriptors that appeared pertinent for the linear model.
5. Conclusions
QSAR methodologies have been applied successfully to establish a mathematical relationship between the activity and physico-chemical, topological and electronic indices.
The activity of the above compounds was investigated by means of MLR and ANN techniques. Superiority of non-linear (ANN) over the linear (MLR) model revealed that the activity has non-linear characteristics.
The results (Table 4) of the QSAR study obtained in this work indicate that the activity depended strongly on the Hydrogen-bonding donors factors as expressed by , hydrophobic factors
  and Molecular weight
 .
.
Model has show the great importance of hydrophobic effects in chemical-biological interactions, this activity depends on membrane passage, and it might generally be hypothesized that the lipophilic character of chemicals could help them to cross cell membranes.
In addition, the approach used for the contributions and classification of descriptors in MLR and ANN, may be of help in QSAR interpretations.
6. Acknowledgements
The authors thank Centre National de la Recherche Scientifique et Technique (CNRST) for funding this project under the RS program. We also thank the Professor J. R. CHRETIEN for his valuable comments.
REFERENCES
- Y. Zhuo, R. Kong, X.-J. Cong, W.-Z. Chen and C.-X. Wang, “Three-Dimensional QSAR Analyses of 1,3,4- Trisubstituted Pyrrolidine-Based CCR5 Receptor Inhibitors,” European Journal of Medicinal Chemistry, Vol. 43, No. 12, 2008, pp. 2724-2734. doi:10.1016/j.ejmech.2008.01.040
- I. P. Ribeiro, C. G. Schrago, E. A. Soares, A. Pissinatti, H. N. Seuanez, C. A. M. Russo, A. Tanuri and M. A. Soares, “CCR5 Chemokine Receptor Gene Evolution in New World Monkeys (Platyrrhini, Primates): Implication on Resistance to Lentiviruses,” Infection Genetics and Evolution, Vol. 5, No. 3, 2005, pp. 271-280. doi:10.1016/j.meegid.2004.07.009
- J. Ernst, R. Dahl, C. Lum, L. Sebo, J. Urban, S.G. Miller and J. Lundströ, “Anti-HIV-1 Entry Optimization of Novel Imidazopiperidine-Tropane CCR5 Antagonists,” Bioorganic & Medicinal Chemistry Letters, Vol. 18, No. 4, 2008, pp. 1498-1501.
- F. J. Prado-Prado, X. García-Mera and H. González-Díaz, “Multi-Target Spectral Moment QSAR versus ANN for Antiparasitic Drugs against Different Parasite,” Bioorganic & Medicinal Chemistry, Vol. 18, No. 6, 2010, pp. 2225-2231. doi:10.1016/j.bmc.2010.01.068
- M. Hossein Fatemi and S. Gharaghani, “A Novel QSAR Model for Prediction of Apoptosis-Inducing Activity of 4-Aryl-4-H-Chromenes Based on Support Vector Machine,” Bioorganic & Medicinal Chemistry, Vol. 15, No. 24, 2007, pp. 7746-7754. doi:10.1016/j.bmc.2007.08.057
- Y. Yuan, R. Zhang and R. Hu, X. Ruan, “Prediction of CCR5 Receptor Binding Affinity of Substituted 1-(3,3- Diphenylpropyl)-Piperidinyl Amides and Ureas Based on the Heuristic Method, Support Vector Machine and Projection Pursuit Regression,” European Journal of Medicinal Chemistry, Vol. 44, No. 1, 2009, pp. 25-34. doi:10.1016/j.ejmech.2008.03.004
- J. T. Leinard and K. Roy, “Comparative QSAR Modeling of CCR5 Receptor Binding Affinity of Substituted 1-(3, 3-Diphenylpropyl)-Piperidinyl Amides and Ureas,” Bioorganic & Medicinal Chemistry Letters, Vol. 16, No. 17, 2006, pp. 4467-4474.
- H. Bazoui, M. Zahouily, S. Sebti, S. Boulaajaj and D. Zakarya, “Structure-Cytotoxicity Relationships for a Series of HEPT Derivatives,” Journal of Molecular Modeling, Vol. 8, No. 1, 2002, pp. 1-7. doi:10.1007/s00894-001-0054-9
- M. Zahouily, A. Rhihil, H. Bazoui, S. Sebti and D. Zakarya, “Structure-Toxicity Relationships Study of a Series of Organophosphorus Insecticides,” Journal of Molecular Modeling, Vol. 8, No. 5, 2002, 168-172. doi:10.1007/s00894-002-0074-0
- M. Zahouily, M. Lazar, A. Elmakssoudi, J. Rakik, S. Elaychi and A. Rayadh, “QSAR for Anti-Malarial Activity of 2-Aziridinyl and 2,3-Bis(Aziridinyl)-1,4-Naphthoquinonyl Sulfonate and Acylate Derivatives,” Journal of Molecular Modeling, Vol. 12, No. 4, 2006, pp. 398- 405. doi:10.1007/s00894-005-0059-x
- M. Zahouily, A. Rayadh, M. Aadil and D. Zakarya, “Quantitative Structure-Diastereoselectivity Relationships for Arylsulfoxide Derivatives in Radical Chemistry,” Journal of Molecular Modeling, Vol. 9, No. 4, 2003, pp. 242- 247. doi:10.1007/s00894-003-0136-y
- J. S. Song, T. Moon, K. D. Nam, J. K. Lee, H. G. Hahn, E. J. Choi and C. N. Yoon, “Quantitative Structural-Activity Relationship (QSAR) Study for Fungicidal Activities of Thiazoline Derivatives against Rice Blast,” Bioorganic & Medicinal Chemistry Letters, Vol. 18, No. 6, 2008, pp. 2133-2142.
- C. Bergmeir and J. M. Benítez, “On the Use of CrossValidation for Time Series Predictor Evaluation,” Information Sciences, Vol. 191, 2012, pp 192-213.
- Y. Liu, Z. Ke, J. Cui, W. Chen, L. Ma and B. Wang, “Synthesis, Inhibitory Activities, and QSAR Study of Xanthone Derivatives as Alpha-Glucosidase Inhibitors,” Bioorganic & Medicinal Chemistry, Vol. 16, No. 15, 2008, pp. 7185-7192.
- C. N. Alves, J. C. Pinheiro, A. J. Camargo, M. M. C. Ferreira, R. A. F. Romero and A. B. F. Da Silva, “A Multiple Linear Regression and Partial Least Squares Study of Flavonoid Compounds with Anti-HIV,” Journal of Molecular Structure, Vol. 541, No. 1, 2001, pp. 81-88.
- M. Jalali-Heravi, M. Asadollahi-Baboli and P. Shahbazikhah, “QSAR Study of Heparanase Inhibitors Activity Using Artificial Neural Networks and Levenberg Marquardt Algorithm,” European Journal of Medicinal Chemistry, Vol. 43, No. 3, 2008, pp. 548-556.
- K. De, C. Sengupta and K. Roy, “QSAR Modeling of Globulin Binding Affinity of corticosteroids Using AM1 Calculations,” Bioorganic & Medicinal Chemistry, Vol. 12, No. 12, 2004, pp. 3323-3332.
- K. Roy and J. T. Leonard, “QSAR by LFER Model of Cytotoxicity Data of Anti-HIV 5-Phenyl-1-Phenylamino- 1H-Imidazole Derivatives Using Principal Component Factor Analysis and Genetic Function Approximation,” Bioorganic & Medicinal Chemistry, Vol. 13, No. 8, 2005, pp. 2967-2973. doi:10.1016/j.bmc.2005.02.003
- A. Speck-Planche, V. V. Kleandrova, F. Luan and M. N. D. S Cordeiro, “Rational Drug Design for Anti-Cancer Chemotherapy: Multi-Target QSAR Models for the in Silico Discovery of Anti-Colorectal Cancer Agents,” Bioorganic & Medicinal Chemistry, Vol. 20, No. 15, 2012, pp. 4848-4855doi:10.1016/j.bmc.2012.05.071
- K. Dincer, S. Tasdemir, S. Baskaya and B. Z. Uysal, “Modeling of the Effects of Length to Diameter Ratio and Nozzle Number on the Performance of Counter Flow Ranque-Hilsch Vortex Tubes Using Artificial Neural Networks,” Applied Thermal Engineering, Vol. 28, No. 17-18, 2008, pp. 2380-2390. doi:10.1016/j.applthermaleng.2008.01.016
- S. Satish and Y. P. Setty, “Modeling of a Continuous Fluidized Bed Dryer Using Artificial Neural Networks,” Heat and Mass Transfer, Vol. 32, No. 3-4, 2005, pp. 539- 547. doi:10.1016/j.eswa.2008.01.042
- B. Abbasi, “A Neural Network Applied to Estimate Process Capability of Non-Normal Processes,” Expert Systems with Applications, Vol. 36, No. 2, 2009, pp. 3093-3100. doi:10.1016/j.ejmech.2008.02.041
- C. Hansch and R. P. Verma, “A QSAR Study for the Cytotoxic Activities of Taxoids against Macrophage (MΦ)-Like Cells,” European Journal of Medicinal Chemistry, Vol. 44, No. 1, 2009, pp. 274-279.
- M. Zahouily, M. Lazar, M. Boumarzouk, R. Mouhibi, M. Nohair and M. A. Bahlaoui, “A Quantitative Structure-Activity Relationship Model,” Chemical Product and Process Modelling, Vol. 3, No. 1, 2008, pp. 1-8.
- W. L. Gore, “Statistical Methods for Chemical Experimentation,” Interscience, New York, 1952, p. 141.
- P. P. Roy, J. T. Leonard, K. Roy, “Exploring the Impact of Size of Training Sets for the Development of Predictive QSAR Models,” Chemometrics and Intelligent Laboratory Systems, Vol. 90, No. 1, 2008, pp. 31-42. doi:10.1016/j.chemolab.2007.07.004
- F. Zheng, E. Bayram, S. P. Sumithran, J. T. Ayers, C. Zhan, J. D. Schmitt and L. P. Dwoskin, “QSAR Modeling of Monoand Bis-Quaternary Ammonium Salts That Act as Antagonists at Neuronal Nicotinic Acetylcholine Receptors Mediating Dopamine Release,” Bioorganic & Medicinal Chemistry, Vol. 14, No. 9, 2006, pp. 3017- 3037. doi:10.1016/j.bmc.2005.12.036
NOTES
*Corresponding author.