Open Journal of Radiology
Vol.3 No.2(2013), Article ID:33151,10 pages DOI:10.4236/ojrad.2013.32009
A GATE Simulation Study of the Siemens Biograph DUO PET/CT System
1Department of Physics, Chemistry and Material Science, Technological Educational Institute (TEI) of Piraeus, Athens, Greece
2Medical Physics Department, Medical School, University of Athens, Athens, Greece
3Department of Engineering of Electronic and Computer Systems, Technological Educational Institute (TEI) of Piraeus, Athens, Greece
Email: skottou@med.uoa.gr
Copyright © 2013 Dimitrios Nikolopoulos et al. This is an open access article distributed under the Creative Commons Attribution License, which permits unrestricted use, distribution, and reproduction in any medium, provided the original work is properly cited.
Received January 28, 2013; revised March 2, 2013; accepted March 10, 2013
Keywords: Monte-Carlo; GATE; PET; Siemens Biograph DUO PET/CT
ABSTRACT
This is a GATE-simulation study of the Siemens Biograph DUO PET/CT system. It reports effects of changes in the thickness of the employed Lutetium Oxyorthosilicate (LSO) detectors. The PET/CT, a human body phantom and a cylindrical F-18 FDG source were simulated. Validation measurements were conducted. The results indicate that LSO thickness increase degrades spatial resolution, improves relative energy resolution from 9.0% to 11.3% and increases signal-to-noise-ratio from 0.81 to 1.17. Thicker LSO crystals present greater axial sensitivity so as the detection efficiency of PET would be significantly enhanced.
1. Introduction
Positron emission tomography (PET) is a very powerful medical diagnostic method to observe the metabolism, blood flow, neurotransmission and handling of important biochemical entities [1]. Among the various scintillation detectors employed in commercial PET systems, Be4Ge3O12 (BGO) was for a long time the state of the art [2,3]. LuSiO5 (LSO) has become the best competitor of BGO [1,3-5], mainly due to its high detection efficiency. Other PET systems employ other scintillators, such as Gd2SiO5 (GSO), LuAlO3 (Lu AP), YAlO3 (YAP) and Y3Al5O12 (YAG) [1,3,4]. What’s remarkable is the recent interest in introducing new scintillators and detector designs for PET [2,3,6-10]. Significant improvements have been achieved in the overall PET imaging technology [1,3,4], e.g. algorithms for statistical effects, scatter and random coincidences, faster detector electronics and better reconstruction algorithms [1,3,11,12]. Modern PET scanners incorporate computed tomography (CT) systems to achieve more accurate anatomical localisation of functional abnormalities [12]. The hybrid PET/CT systems eliminate lengthy PET transmission scans and generate complex three dimensional images within few minutes. This improves count-rate, spatial resolution and signal-to-noise ratio (SNR) [2,3,13]. At the same time it enhances clinical conditions, diagnosis, follow-up and therapy [12]. PET/CT technology is undergoing a rapid evolution. As the current technology becomes more widespread, it is likely that there will be a demand for PET designs of better performance and less cost [1,3]. This intensifies the interest for investigations on already employed PET scintillators [5,7,11,14-16] and in seeking applicability of new detector concepts. In designing and evaluating scintillation detectors for PET, it is of significance to determine the various phenomena that affect radiation detection [3,17]. What’s important is the emission and re-absorption of scatter and characteristic X-ray fluorescence radiation, bremsstrahlung and Auger and Koster-Kronig electrons [18]. This is because these phenomena occur apart from the primary interaction point and, as a result, render degradation of spatial resolution and image contrast [19]. In simulating the stochastic processes involved in radiation detection, the Monte Carlo techniques constitute a very efficient tool [4,17]. Several general Monte Carlo packages are available (e.g. PENELOPE, MCNP, EGSnrc MP, GEANT4) [17,19]. Their design is for complex and general geometries of particle showers; however, non-trivial coding is needed. Especially for PET, GATE (GEANT4 Application for Tomographic Emission) is more frequently used because of its flexibility for Tomographic simulations [11].
2. Materials and Methods
The present study focused on the Siemens Biograph DUO PET/CT. The study extended previous validated work [11,14,20] and performed a simulation of the entire PET/CT scanner using GATE. For the purpose of the study, a human body phantom and a cylindrical F-18 FDG source were also simulated. The work emphasises on changes that will be potentially induced if the thickness of the LSO detectors of the PET scanner is altered. For further validation, new experimental measurements were taken. The experimental setup was modeled with GATE and the corresponding outputs were compared with the actual measurements.
2.1. Description of the Simulated Scanner
The simulated Biograph DUO PET/CT is installed in the Diagnostic and Therapeutic Center of Athens, “Hygeia” (Greece). The scanner comprises a dual-slice Siemens Emotion CT scanner in tandem with an ECAT HR+ PET scanner. The HR+ has no septa and operates entirely in 3D mode. A new patient bed design allows a combined scan range for both PET and CT.
PET and CT acquisition and reconstruction run under a single protocol on one workstation [21]. The CT images are used for the correction of the PET data due to attenuation and scatter. The corrected PET data are reconstructed with the Fourier re-binning (FORE) algorithm and the attenuation-weighted ordered subset EM (AWOSEM) algorithm. The complete acquisition of both PET and CT data takes less than 30 min and the fused images are available for viewing within 5 min after the completion of the scan. The images are viewed on a separate fused image display station [20,21].
The detectors of the Siemens Biograph PET scanner are organised in: 1) buckets, 2) heads, 3) blocks and 4) arrays. The buckets are composed of sets of four heads. Each head contains three blocks and each block contains an 8 × 8 array of LSO crystals. The detector blocks are coupled to sets of four photomultiplier (PMT) tubes. The entire block-photomultiplier arrangement is repeated three times in stacked detector rings. The whole detector settlement finally sums up 48 heads and 144 blocks of 9216 LSO crystals coupled to 576 photomultiplier tubes.
The PET and CT scanners are separated through 2.5 cm thick lead arcs arranged around the detector setup [20,21]. Figure 1(a) presents the simulated scanner. Figures 1(b)-(k) illustrate schematically the parts of the PET detectors. Figure 1(l) presents the actual crystal-PMT
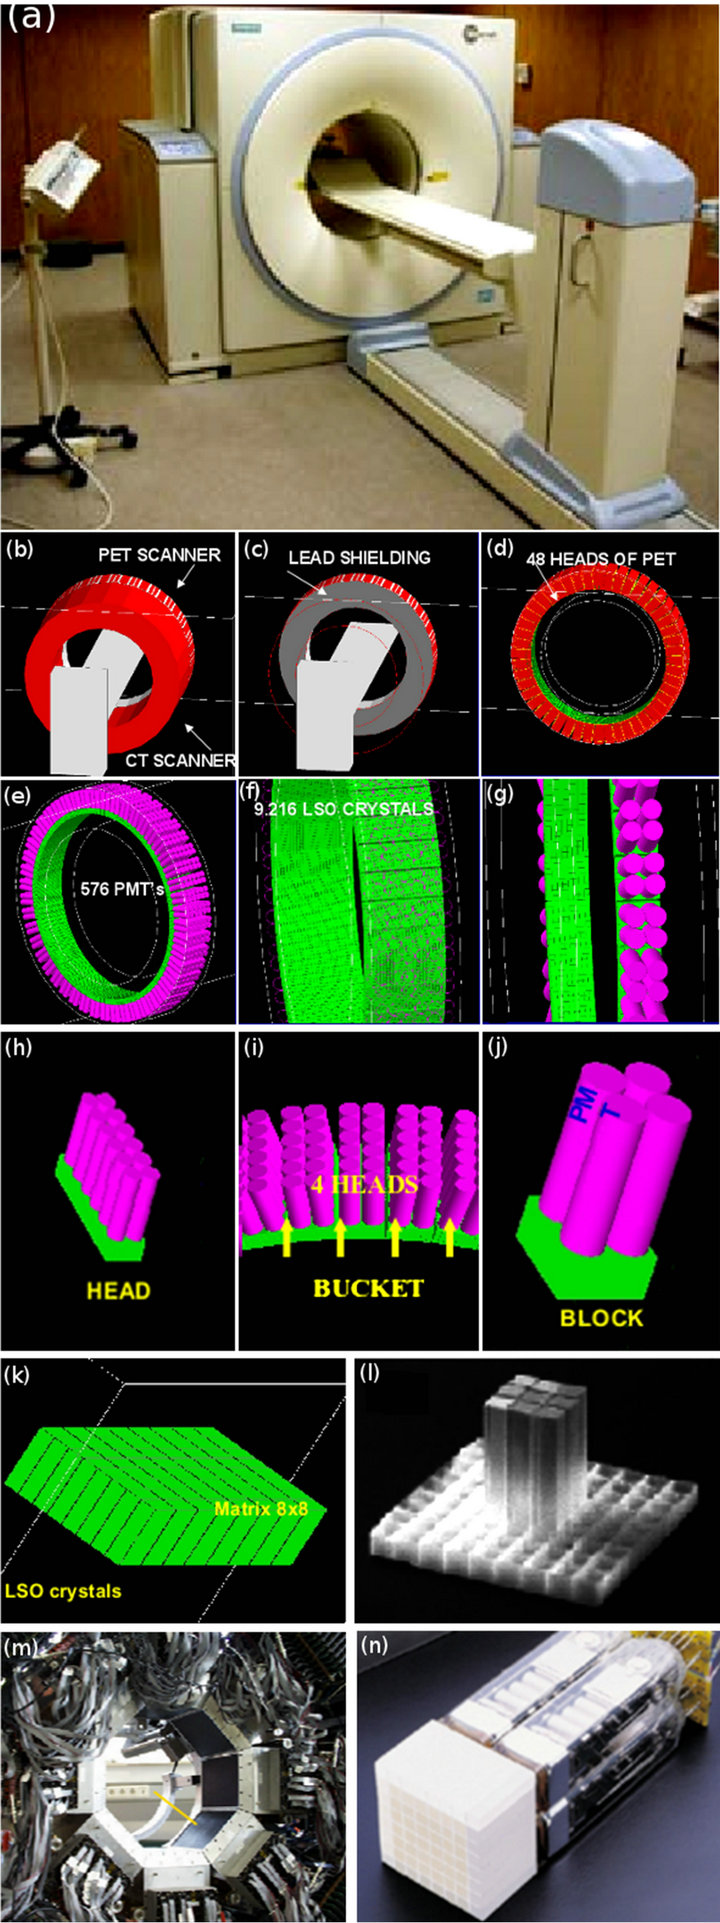
Figure 1. The investigated PET/CT Biograph DUO LSO scanner. (a) The actual installation in the Diagnostic and Therapeutic Center of Athens, “Hygeia” (Greece); (b)-(k) Geometrical simulation of various parts of the scanner; (l) The real 8 × 8 LSO array of the PET system; (m) The actual detector assembly; (n) One real detection block of the PET scanner system.
assembly and Figure 1(m) the real LSO detector assembly for coincidence measurements.
The dimensions of the actual PET/CT components are the following: 1) Entry port diameter of 70 cm for both PET and CT; 2) Overall tunnel length of 110 cm; 3) Combined scan range of 145 cm; 4) PET gantry radii between 35.0 cm and 53.5 cm and gantry height of 18.8 cm; 5) Buckets dimensions of 12 × 21.6 × 16.18 cm3; 6) Heads dimensions of 2 × 5.393 × 16.180 cm3; 7) Block dimensions of 5.393 × 5.393 × 10.5 cm3; 8) Arrays consisting of LSO crystals of dimensions 0.645 × 0.645 × 2.5 cm3; and 9) Photomultiplier tubes of radius 1.27 cm and height 7.9 cm.
2.2. Description of GATE
GATE is a GEANT4 based Monte-Carlo platform adapted to the field of Nuclear Medicine. Through a dedicated script language, it may simulate the passage of particles through matter and electromagnetic fields providing different levels of description, analysis and visualisation. It may simulate detector and source kinetics and other time-dependent phenomena rendering hence, the coherent description of acquisition processes and detector output pulses.
Detector response is modeled by a chain of processing modules comprising 1) the Adder which regroups the hits per volume into a pulse, 2) the Readout which regroups the pulses per block, 3) the Energy Response which simulates a Gaussian blurring of the energy spectrum of a pulse after the readout module, 4) the Spatial Response which provides the coincidence events and the lines of response (LOR) needed for the image reconstruction, 5) the Threshold Electronics which provide the cut-off energy windows and 6) the Dead Time which defines the dead-time behavior of the counting system.
2.3. Description of the Simulation
The GATE codes simulated the following parts: 1) the entire PET detector arrangement; 2) the light guides, photomultiplier tubes and related electronics; 3) the coincidence circuits and processors; 4) the digitizer; 5) the time-delay of PET; 6) the data processing systems; 7) the examination bed; 8) the PET gantry; 9) the PET motions (gantry, bed); 10) the shielding between PET and CT; 11) the shielding of the room; and 12) the CT image reconstruction process. Noteworthy is that CT was simulated so as to reproduce in the most efficient way the image acquisition and processing techniques followed during PET scanning.
Additionally software phantoms were simulated consisted of 1) a cylindrical source phantom of radius 1 mm and height 15 cm, homogeneously filled with F-18 FDG and 2) a human body phantom.
This phantom consisted of an ellipsoid of 8 cm minimum and 15 cm maximum radius mimicking the human main body (b-1), two cylinders of radius 5 cm and height 30 cm mimicking the human hands (b-2), a sphere of 14 cm radius mimicking the human head (b-3) and a cylindrical F-18 FDG source of 0.5 cm radius and 5 cm height settled around the centre of the ellipsoid-human torso. All software phantoms were computationally arranged in a manner that the central axis of the enclosed F-18 FDG source was aligned to the central axis of the gantry.
During simulation all interaction phenomena were allowed to occur with the following parameters: 1) crystal energy blurring: resolution of 0.26 at 511 keV; 2) detector characteristics: gamma ray absorption linear coefficient of 0.98, light output of 30,000 photons/MeV, intrinsic resolution of 0.088 and transfer efficiency coefficient of 0.28; 3) energy window: between 250 and 650 keV; 4) time resolution: coincidence window, dead time window of 120 ns and dead time offset of 700 ns; 5) F-18 FDG source half life of 6586.2 s; and 6) slice time of 1 s and acquisition time of 10 s.
Parameters 1) and 2) are equal to the manufacturer values. Parameters 3) to 4) are the values adopted during operation.
2.4. Validation
Validation measurements were derived with a cylindrical F-18 FDG source of 1 mm radius, 15 cm height and 29.6 MB qactivity for acquisition time of 10 s. The source was placed at the centre of the PET gantry. The validation measurements were imitated with the modeled source (software phantom a) which was computationally settled at the gantry’s centre. In order to increase computational accuracy, the modeled activity was set to 100 MBq. For further mimicking, simulated acquisition time was set to 10 s and the profiles of the four photomultiplier tubes were also generated through modeling for comparison. Further validation was performed by comparing simulation results of software phantoms (a) and (b) with those anticipated from the physics of PET imaging. Figures 2(a)-(c) present the actual experimentation during validation measurements. Figure 2(d) shows the simulated source (software phantom a). Figures 2(e) and (f) present two views of the human phantom (software phantom b).
3. Results and Discussion
Figure 3 presents the results of the additional validation experiments together with results of the similar software phantom of Figure 2(d). The normalised energy spectra of the four photomultiplier tubes in block 0 and bucket 0 (Figure 3(Ia)) were the actual spectra provided by the Siemens Biograph DUO PET/CT from validation measurements.

Figure 2. (a)-(c) The F-18 FDG source and the actual setup during validation measurements, as described in section 2.4; (d) The simulation of (c); (e)-(f) Different views of the simulated human body phantom, placed at the centre of the FOV of the scanner of Figure 1.
The simulated normalised energy spectrum (Figure 3 (Ib)) represents the GATE estimation averaged for the whole zero block of bucket 0. As in the actual spectra, the vertical axis is normalised to unity and the horizontal axis gives the real correspondence between channels and energy. The results of the simulation (Figures 3(Ia) and (Ib)) are in fair agreement to the experimental results. All spectra have similar shapes with the expected Compton energy profiles [22]. Similar measured and simulated normalised energy profiles were reported for the Micro PET R4 and Focus 220 PET scanners [23], as well as for the MOSAIC animal PET [24]. The total integrated area of each one of the four measured spectra does not differ significantly. However, modeled Compton effects are more pronounced for low x-values (channels per energy), while the GATE energy cut-offs restrict simulated xvalues up to 53 channels per energy.
Hence, it is expected that the simulation of Compton scatter will deviate at the very low and the very high energy range.
Figure 3(II) presents the GATE estimations of the energy resolution of the experiments. The energy resolution in respect to 0.511 MeV is 0.135 MeV (26.4%) for the system and 0.110 MeV (21.5%) for the detectors.
Both values are significantly higher than those assumed in an optimisation study for the Siemens Biographm CT [5] and in a study for the Discovery RX PET/CT scanner [6]. The energy of the peak of both curves of Figure 3(II) is identical to the expected value
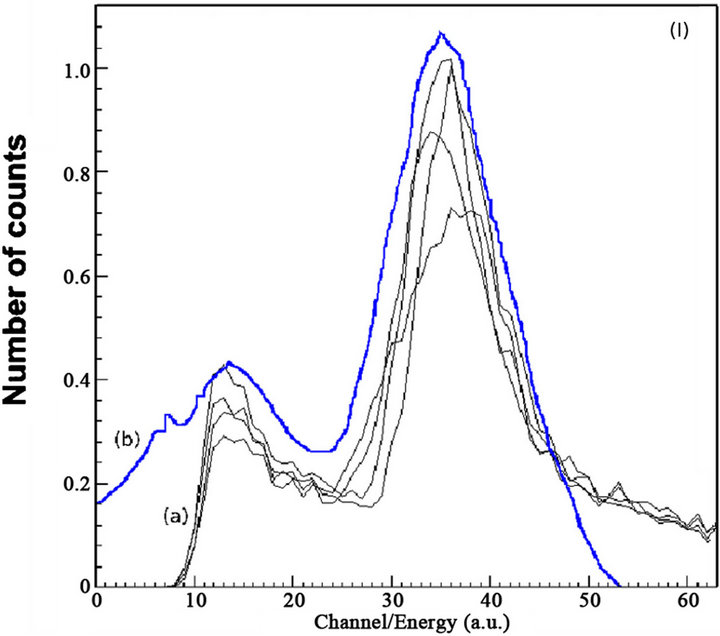
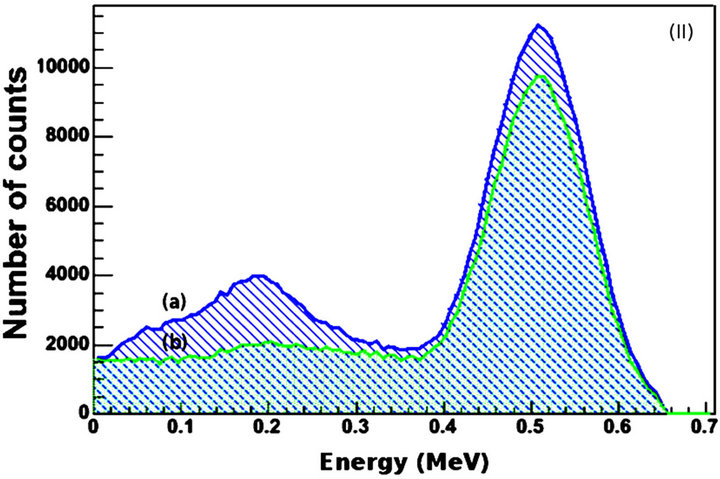
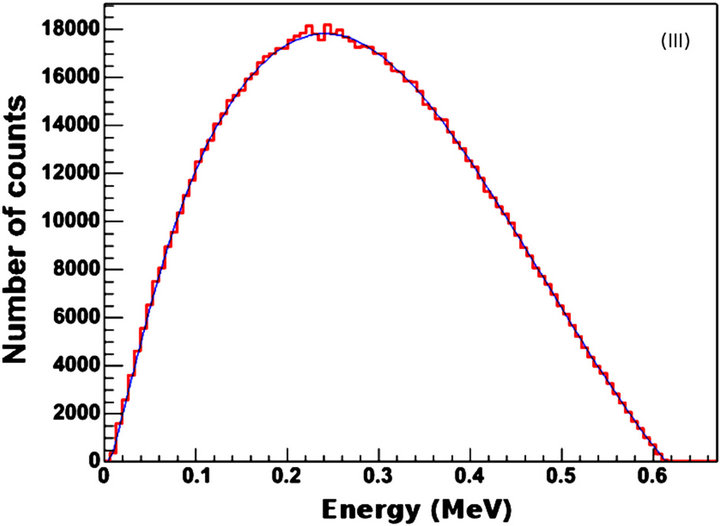
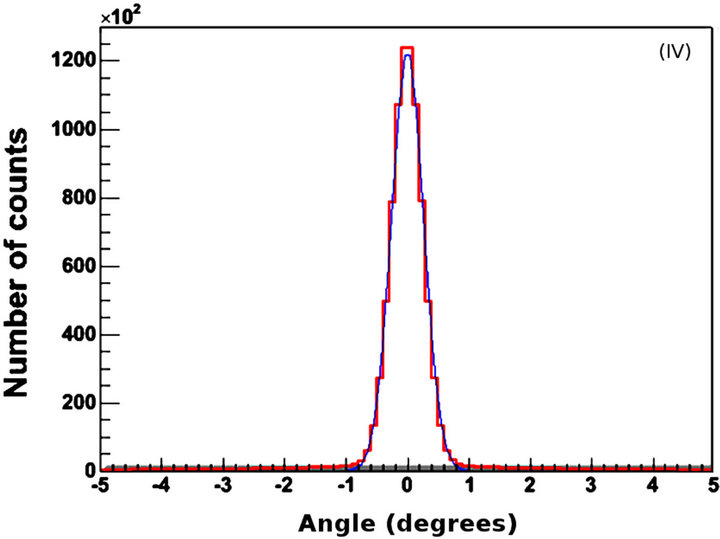
Figure 3. Validation data. (I) Normalised energy spectra of (a) the four photomultiplier tubes in block 0 and bucket 0 and (b) the GATE simulation; X-axis values correspond to channel numbers. (II) Energy resolution of (a) system and (b) detectors; (III) Positron kinetic energy spectrum from GATE for (I); (IV) Angular linearity of annihilated photons. X-axis values correspond to degrees. The 0 value corresponds to perfect linearity, i.e., 180 degrees at emission. All y-axis values represent number of counts.
of 0.511 MeV. This provides additional evidence for the validity of the simulation. Further support can be observed in Figures 3(III) and (IV). From Figure 3(III) it can be calculated that the maximum and mean F-18 energies are 0.64 MeV and 0.28 MeV respectively. These values did not differ significantly from the corresponding values that were given by the system from the validation experiments. In addition, the F-18 half-life that was calculated from the data of Figure 3(III) is 6576 s whereas the well-known value is 6586 s. Finally, the angular distribution of the true annihilated photons for the simulation of the validation experiments was (180 ± 0.8) (Figure 3(IV)). This value is very similar to the actual value of (180 ± 0.6) that was calculated by the system during the experiments.
It should be noted that simulations of the pulse processing and coincidence generation methods of real scanners are not common in the literature [5]. A reason is that it is generally difficult to model individual components of a scanner because of limited information from manufacturers about their designs—or incomplete physical characterisation of phenomena, such as optical transport in scintillators [5,25,26]. Usually the models employ analytical dead time simulations based on experimental data from the scanner [27,28], coincidence processing algorithms [27], or fixed values for physical parameters that give reasonable agreement to experimental results [11,29].
Simulation data have also been scaled to offset sensitivity mismatches to achieve close agreement with experimental results [5,11,28,29].
The risk with these approaches is that the methods used to develop and validate the simulation models may not scale with confidence beyond the exact phantom and scanner configuration used in the validation, and may result in larger errors when used for performance prediction [5].
Figure 4 illustrates graphically an example of the energy frequency distribution of the detection system while Table 1 summarises the corresponding results with thickness. In Figure 4 the mean energy is 407.5 keV and the Root Mean Square (RMS) energy is 99.06 keV. Full Width at Half Maximum (FWHM) of energy and Relative Energy Resolution (RER) [22] are 0.6 and 6% respectively for the peak near 0.511 MeV. As thickness increases, FWHM, RER and Signal to Noise Ratio (SNR) increase. Since RER and energy FWHM are linearly associated [22], the comparable increase of both parameters with thickness is well justified.
According to Table 1, increase of 20% in LSO thickness induces a corresponding increase in RER of approximately 1.5%. In addition, the photo-peak height exhibits a tendency to increase while the Compton area decreases. This indicates that the number of higher en-
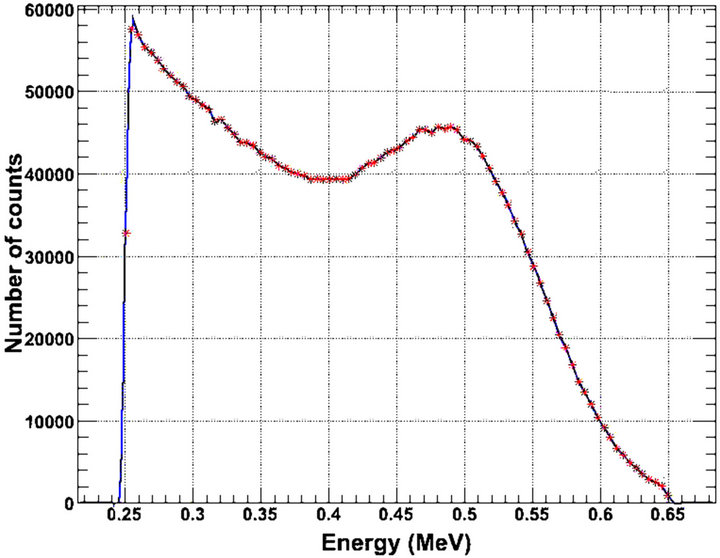
Figure 4. The total coincidence energy spectrum in LSO crystals of 2.0 cm thickness, as analytically presented in Table 1, along with LSO crystals of 2.5 and 3.0 cm thickness.
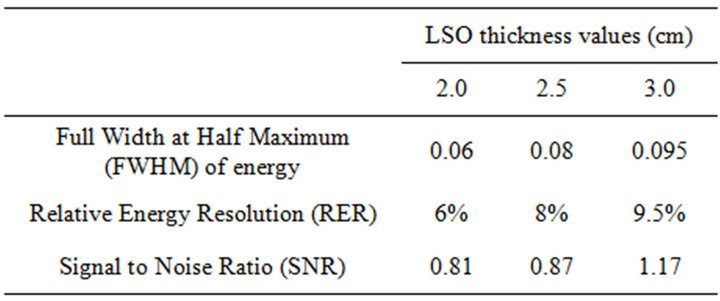
Table 1. Total coincidence energy spectra results for three LSO thickness values. The relative errors of the presented values are 2% in the 95% confidence interval (CI).
ergy photons increases, i.e., it is more likely for photons above 400 keV to be fully absorbed in the detectors.It should be noted however that thick detectors provide greater detection efficiency, but also lead to degradation of spatial resolution due to depth of interaction (DOI) blurring [5,30].
For large scanners, the DOI blurring in the axial direction has the potential to be a major factor [5]. The above factors may explain the increase in FWHM, RER and SNR with detector thickness. The SNR increase could also be attributed to increase in noise equivalent count rate (NECR), since SNR is proportional to the square root of NECR [5,6,31,32]. This is consistent with more random coincidences in thicker detectors.
As an opposite example, investigators have reported [6] that for the Discovery RX PET/CT a reduction of 2.3 in random rates, is associated with an increase of 1.5 in NECR and improvement of SNR by a factor of 2.1. Conversely, SNR benefit may be observed in large scanners, due to the greater Line Of Responses (LORs) that pass through long distances of tissue [33,34].It should be noted however, that the signal processing chain of the electronic system can cut out photon energies that are of low significance for imaging, modifying thus the influence of the above parameters to image quality.
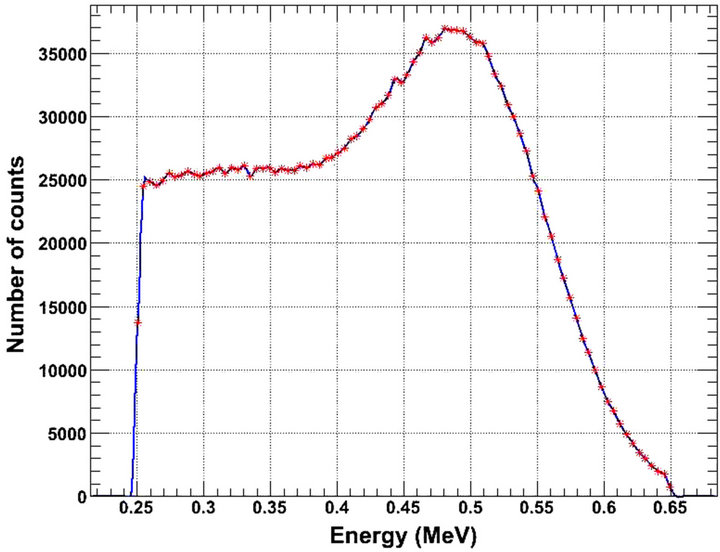
Figure 5 illustrates Compton scattering changes induced after modifying detector thickness. The figure shows energy distributions of photons interacted in a detector at least once through a Compton Effect. Figure 5 corresponds to true coincidences. All spectra are peaked around 0.511 MeV, i.e., the rest energy at emission. The peak of the 3.0 cm thick crystals is sharper than the one of the 2.0 cm thickness. This can be attributed to the higher detection efficiency of the thicker LSO detectors at 0.511 MeV [5,17,18]. Counts corresponding to energies higher than 0.511 MeV are obtained. These counts correspond to two or more photons which are not discriminated due to their short temporal arrival on a certain detector block [1-3,30,35]. In addition, energy FWHM at 0.511 MeV and RER increased slightly with thickness (Table 2). This is consistent with a weak decrease in discriminating two detected photons of similar energies.
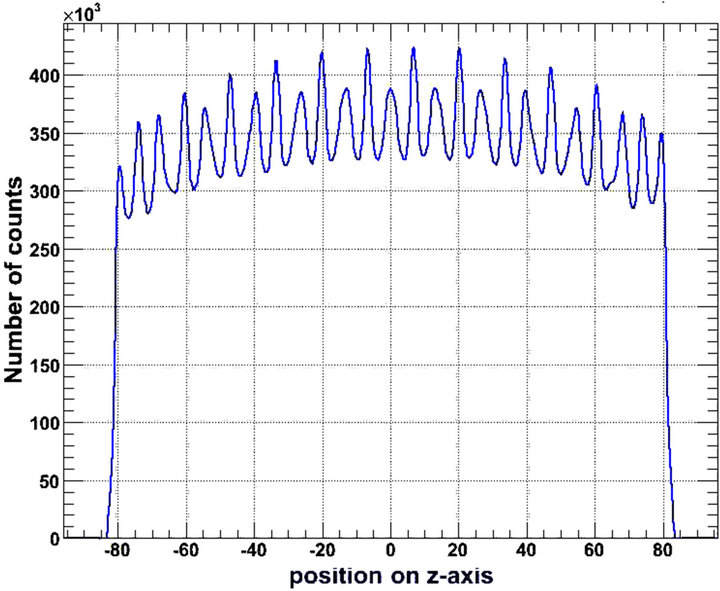
The simulated gamma photon axial sensitivity of the
 (a)
(a) (b)
(b)
Figure 5. True coincidence energy spectrum of detected photons undergoing Compton scattering in a detector of (a) 2.0 cm and (b) 3.0 cm crystal thickness.
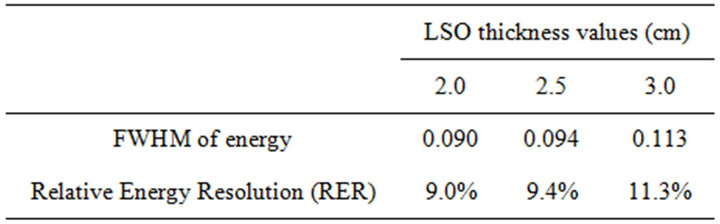
Table 2. Unscattered coincidence energy spectra results for three LSO thickness values. The relative errors of the presented values are 2% in the 95% confidence interval (CI).
detection system is presented in Figure 6.
As detector thickness increases, the axial distribution of the number of counted photons is enhanced at the centre, i.e., the energy distribution is sharper. Similar results have been reported by others [36]. On the other hand, the central sensitivity enhancement was not observed for an LYSO based PET/CT scanner [6]. From another point of view, Figure 6 is indicative of sensitivity degradation at the edges of the Axial Field Of View (AFOV).
This could be attributed to (DOI) degradation of thicker detectors [5,30] or to parallax effects of longer LSO crystals of fixed ring PET diameter [2,30].
However, the constant peak to valley ratio (1.02, Table 2) provides oppose interpretations, viz., absence of degradation. Furthermore, the fact that the photon detection sensitivity increases with the thickness of the 64 LSO crystals block (Figure 7, Table 3) points in another way that blocks of thicker crystals detect and count more photons. This is in agreement with the higher detection efficiency of the thicker crystals [5,17,18].
It may be calculated from Table 3 that there is almost a linear relation between the total number of interacting and the total number of counted gamma photons of adetection block with LSO thickness (Table 3).
Despite the increased sensitivity of thicker scintillator blocks, the parallax effects of longer detectors [2] might necessitate employment of multiple readout layers and phoswich detectors. Investigators have addressed this issue [2,3,30,37,38], however more research is still needed. The experimental maximum energy resolution is 10% if 2.5 cm thick LSO crystals are employed. The corresponded modeled resolution is 9.4% for 2.0 cm crystals and 11.3% for 3.0 cm crystals respectively.
Despite the fact, that the attenuation length of LSO is 1.16 cm [2,3,30] and that the Siemens Biograph PET/CT DUO scanner is manufactured with 2.5 cm thick LSO crystals, a possible use of 3.0 cm thick crystals would improve spatial and energy resolution. The investigation of the delay of the detection system may be valuable for future studies. In addition, the optimization of the emission acquisition protocols and the validation of newly developed data correction and reconstruction algorithms or the use of voxelised phantoms and patient data could be another step forward to achieve corrections due
 (a)
(a)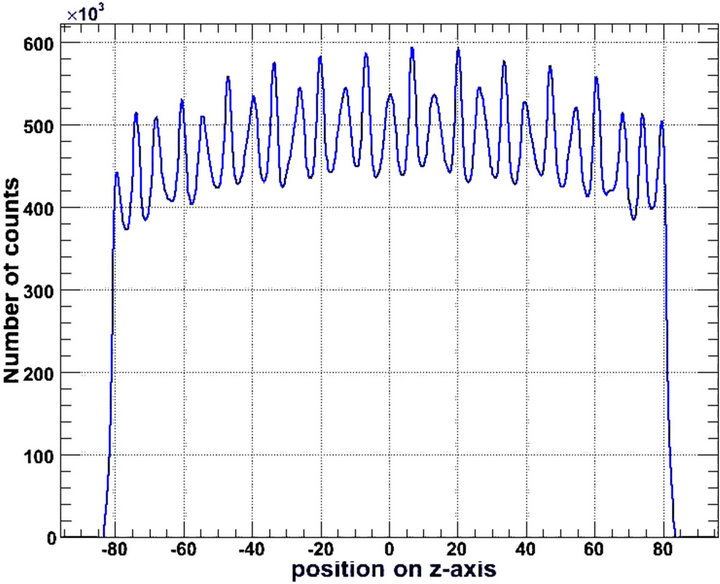 (b)
(b)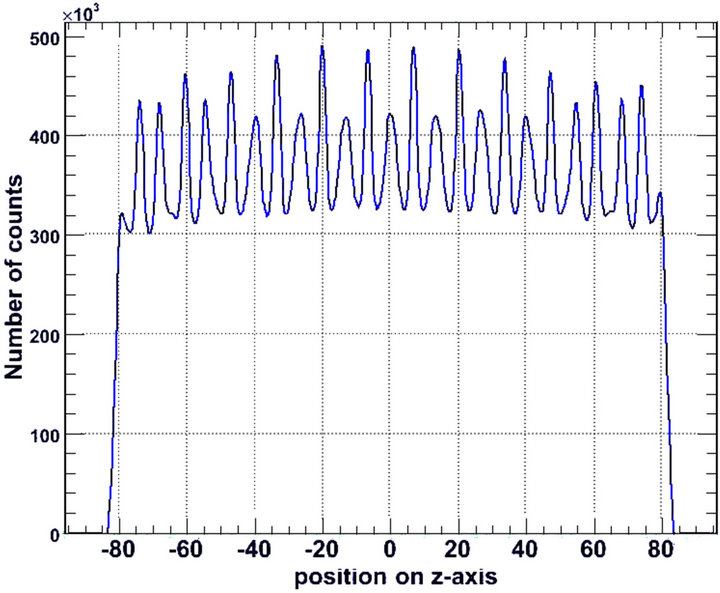 (c)
(c)
Figure 6. Axial sensitivity of the detection system, for (a) 2.0 cm; (b) 2.5 cm and (c) 3.0 cm LSO thickness. The vertical axis represents the number of detected photons that are counted by the system as indicated by the simulation. The horizontal axis represents the position (cm) of the photon counting relative to the central z-axis of the gantry (z = 0).
 (a)
(a) (b)
(b)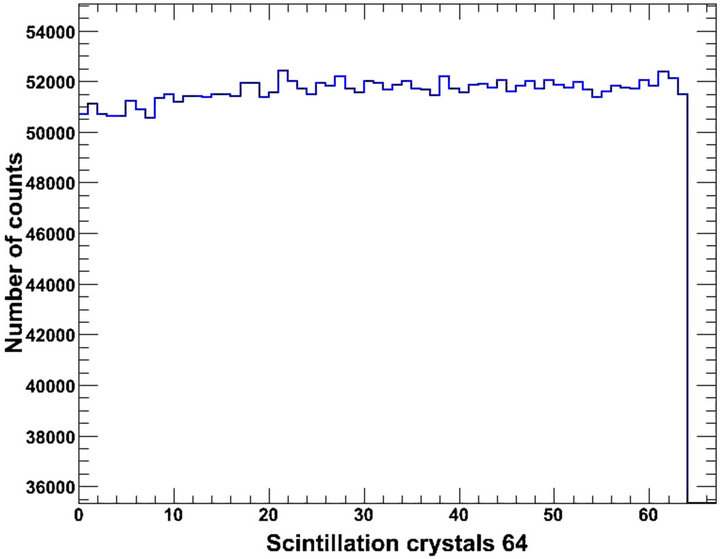 (c)
(c)
Figure 7. Normalised distribution of gamma photons in a block of 64 LSO crystals for thickness values of (a) 2.0 cm; (b) 2.5 cm and (c) 3.0 cm.
to scatter or patient motion.
Another improvement may be the further coding of the electronic system of PET, which nowadays seems to be of great interest. Nevertheless, the above limitations do not restrict the importance of the presented results since they include a multi-validated GATE model.

Table 3. Distribution of absorbed gamma photons in a block of 64 LSO crystals for three LSO thickness values.
4. Conclusion
The present paper employed a validated GATE model to study the effect of the LSO thickness on some imaging parameters of the Siemens Biograph DUO PET/CT system. Non-significant changes were observed for positron kinetic energy spectrum, interactions of positrons with matter, positron annihilation distance, numbers of annihilation processes, gamma ray production, distribution and scattering of gamma-rays, so these items are not highlighted. On the other hand, the detector absorption efficiency is strongly affected by the scintillator thickness. Possible use of 3.0 cm thick LSO crystals will increase detection efficiency of the system, RER and SNR, but will delay signal process and may be accompanied by parallax effects as also mentioned in previous studies. Certainly, the final and most appropriate choice of the detection system should be related to the specific needs of future upgrades of the Siemens DUO PET/CT scanner or construction of new PET systems based on LSO scintillators.
5. Acknowledgements
This work has been co-financed by Greece and the European Union under the European Social Fund NSRF 2007-2013 (Thales). Managing Authority: Greek Ministry of Education, Religious Affairs, Culture and Sports.
REFERENCES
- C. W. E. Van Eijk, “Inorganic Scintillators in Medical Imaging,” Physics in Medicine and Biology, Vol. 47, No. 8, 2002, pp. R85-R106. doi:10.1088/0031-9155/47/8/201
- T. K. Lewellen, “Recent Developments in PET Detector Technology,” Physics in Medicine and Biology, Vol. 53, No. 17, 2008, pp. R287-R317. doi:10.1088/0031-9155/53/17/R01
- C. W .E. Van Eijk, “Radiation Detector Developments in Medical Applications: Inorganic Scintillators in Positron Emission Tomography,” Radiation Protection Dosimetry, Vol. 129, No. 1-3, 2008, pp. 13-21. doi:10.1093/rpd/ncn043
- M. Nikl, “Scintillation Detectors for X-Rays,” Measurement Science and Technology, Vol. 17, No. 4, 2006, pp. R37-R54. doi:10.1088/0957-0233/17/4/R01
- J. K. Poon, M. L. Dahlbom, W. W. Moses, K. Balakrishnan, W. Wang, S. R. Cherry and R. D. Badawi, “Optimal Whole-Body PET Scanner Configurations for Different Volumes of LSO Scintillator: A Simulation Study,” Physics in Medicine and Biology, Vol. 57, No. 13, 2012, pp. 4077-4094. doi:10.1088/0031-9155/57/13/4077
- P. Geramifar, M. R. Ay, M. Shamsaie Zafarghandi, S. Sarkar, G. Loudos and A. Rahmim, “Investigation of Timeof-Flight Benefits in an LYSO-Based PET/CT Scanner: A Monte Carlo Study Using GATE,” Nuclear Instruments and Methods in Physics Research Section A, Vol. 641, No. 1, 2011, pp. 121-127. doi:10.1016/j.nima.2011.03.030
- A. R. Karimian and C. J. Thompson, “Assessment of a New Scintillation Crystal (LaBr3) in PET Scanners Using Monte Carlo Method,” Nukleonika, Vol. 53, No 1, 2008, pp. 3-6.
- T. Nakamori, T. Kato, J. Kataoka, T. Miura, H. Matsuda, K. Sato, Y. Ishikawa, K. Yamamura, N. Kawabata, H. Ikeda, G. Satoc and K. Kamadad, “Development of a Gamma-Ray Imager Using a Large Area Monolithic 4 × 4 MPPC Array for a Future PET Scanner,” Journal of Instrumentation, Vol. 7, No. 1, 2012, pp. 1-13.
- O. Mineev, Y. Kudenko, Y. Musienko, I. Polyansky and N. Yershov, “Scintillator Detectors with Long WLS Fibers and Mulit-Pixel Photodiodes,” Journal of Instrumentation, Vol. 6, No. 12, 2011, pp. 1-9.
- A. Vandenbroucke, A. M. K. Foudray, P. D. Olcott and C. S. Levin, “Performance Characterization of a New High Resolution PET Scintillation Detector,” Physics in Medicine and Biology, Vol. 56, No. 3, 2011, pp. 4135-4145.
- P. Gonias, N. Bertsekas, N. A. Karakatsanis, G. Saatsakis, D. Nikolopoulos, X. Tsantilas, G. Loudos, N. Sakellios, N. Gaitanis, A. Papaspyrou, L. Daskalakis, A. Liaparinos, D. Cavouras, I. Kandarakis and G. S. Panayiotakis, “Validation of a GATE Model for the Simulation of the Siemens PET/CT Biograph 6 Scanner,” Nuclear Instruments and Methods in Physics Research Section A, Vol. 571, No. 1-2, 2007, pp. 263-266. doi:10.1016/j.nima.2006.10.078
- D. W. Townsend, “Physical Principles and Technology of Clinical PET Imaging,” ANNALS Academy of Medicine, Vol. 33, No. 2, 2004, pp. 133-145.
- D. L. Bailey and S. R. Meikle, “A Convolution-Subtraction Scatter Correction Method for 3D PET,” Physics in Medicine and Biology, Vol. 39, No. 3, 1994, pp. 411-424. doi:10.1088/0031-9155/39/3/009
- N. Karakatsanis, N. Sakellios, N. X. Tsantilas, N. Dikaios, C. Tsoumpas, D. Lazaro, G. Loudos, C. R. Schmidtlein, A. Louizi, J. Valais, D. Nikolopoulos, J. Malamitsi, J. Kandarakis and K. Nikita, “Comparative Evaluation of Two Commercial PET Scanners, ECAT EXACT HR+ and Biograph 2, Using GATE,” Nuclear Instruments and Methods in Physics Research Section A, Vol. 571, No. 2, 2006, pp. 368-372. doi:10.1016/j.nima.2006.08.110
- S. Shimizu, C. M. Pepin and R. Lecomte, “Assessment of Lu1:8Gd0:2SiO5 (LGSO) Scintillators with APD Readout for PET/SPECT/CT Detectors,” IEEE Transactions on Nuclear Science, Vol. 57, No. 3, 2010, pp. 1512-1517. doi:10.1109/TNS.2010.2048435
- N. Zeraatkar, M. R. Ay, A. R. Kamali-Asl and H. Zaidi, “Accurate Monte Carlo modeling and Performance Assessment of the X-PET™ Subsystem of the FLEX Triumph™ Preclinical PET/CT Scanner,” Medical Physics, Vol. 38, No. 3, 2011, pp. 1217-1225. doi:10.1118/1.3547721
- D. Nikolopoulos, I. Kandarakis, X. Tsantilas, I. Valais, D. Cavouras and A. Louizi, “Comparative Study of the Radiation Detection Efficiency of LSO, LuAP, GSO and YAP Scintillators for Use in Positron Emission Imaging (PET) via Monte-Carlo Methods,” Nuclear Instruments and Methods in Physics Research Section A, Vol. 569, No. 2, 2006, pp. 350-354. doi:10.1016/j.nima.2006.08.033
- D. Nikolopoulos, I. Kandarakis, D. Cavouras, A. Louizi and C. Nomicos, “Investigation of Radiation Absorption and X-Ray Fluorescence of Medical Imaging Scintillators by Monte Carlo Methods,” Nuclear Instruments and Methods in Physics Research Section A, Vol. 565, No. 2, 2006, pp. 821-832. doi:10.1016/j.nima.2006.05.170
- J. M. Boone, J. A. Seibert, J. M. Sabol and M. Tecotzky, “A Monte Carlo Study of X-Ray Fluorescence in X-Ray Detectors,” Journal of Medical Physics, Vol. 26, No. 6, 1999, pp. 905-916. doi:10.1118/1.598612
- X. Tsantilas, A. Louizi, I. Valais, D. Nikolopoulos, N. Sakellios, N. Karakatsanis, G. Loudos, K. Nikita, J. Malamitsi and I. Kandarakis, “Simulation of Commercial PET Scanners with GATE Monte-Carlo Simulation Package,” Journal of Biomedicine and Biotechnology, Vol. 50, Suppl. 1, 2005, pp. 114-115.
- D. W. Townsend and T. Beyer, “A Combined PET/CT Scanner: The Path to True Image Fusion,” British Journal of Radiology, Vol. 75, Suppl. 9, 2002, pp. S24-S30.
- G. F. Knoll, “Radiation Detection and Measurement,” John Wiley & Sons, New York, 1979.
- C. Lartizien, C. Kuntne, A. L. Goertzen, A. C. Evans and A. Reilhac, “Validation of PET-SORTEO Monte Carlo Simulations for the Geometries of the MicroPET R4 and Focus 220 PET Scanners,” Physics in Medicine and Biology, Vol. 52, No. 16, 2007, pp. 4845-4862. doi:10.1088/0031-9155/52/16/009
- C. Merheb, Y. Petegnief and J. N. Talbot, “Full Modelling of the MOSAIC Animal PET System Based on the GATE Monte Carlo Simulation Code,” Physics in Medicine and Biology, Vol. 52, No. 3, 2007, pp. 563-576. doi:10.1088/0031-9155/52/3/002
- D. A. B. Bonifacio, N. Belcari, S. Moehrs, M. Moralles, V. Rosso, S. Vecchio and A. Del Guerra, “A Time Effi- cient Optical Model for GATE Simulation of a LYSO Scintillation Matrix Used in PET Applications,” IEEE Transactions on Nuclear Science, Vol. 57, No. 5, 2010, pp. 2483-2489. doi:10.1109/TNS.2010.2062536
- D. J. Van der Laan, D. R. Schaart, M. C. Maas, F. J. Beekman, P. Bruyndonckx and C. W. E. Van Eijk, “Optical Simulation of Monolithic Scintillator Detectors Using GATE/GEANT4,” Physics in Medicine and Biology, Vol. 55, No. 6, 2010, pp. 1659-1675. doi:10.1088/0031-9155/55/6/009
- C. R. Schmidtlein, “Validation of GATE Monte Carlo Simulations of the GE Advance/Discovery LS PET Scanners,” Medical Physics, Vol. 33, No. 1, 2006, pp. 198-208. doi:10.1118/1.2089447
- C. Michel, L. Eriksson, H. Rothfuss and B. Bendriem, “Influence of Crystal Material on the Performance of the HiRez 3D PET Scanner: A Monte Carlo Study,” IEEE Nuclear Science Symposium Conference, San Diego, 2006, pp. 2528-2531.
- S. Jan, C. Comtat, D. Strul, G. Santin and R. Trbossen, “Monte Carlo Simulation for the ECAT EXACT HR+ System Using GATE,” IEEE Transactions on Nuclear Science, Vol. 52, No. 3, 2005, pp. 627-633. doi:10.1109/TNS.2005.851461
- T. K. Lewellen, “The Challenge of Detector Designs for PET,” American Journal of Roentgenology, Vol. 195, No. 2, 2010, pp. 301-309. doi:10.2214/AJR.10.4741
- G. L. Brownell, J. A. Correia and R. G. Zamenhof, “Positron Instrumentation,” In: J. H. Lawrence and T. F. Budinger, Eds., Recent Advances in Nuclear Medicine, Grune & Stratton, New York, 1978, pp. 1-49.
- S. C. Strother, M. E. Casey and E. J. Hoffman, “Measuring PET Scanner Sensitivity: Relating Countrates to Image Signal-to-Noise Ratios Using Noise Equivalent Counts,” IEEE Transactions on Nuclear Science, Vol. 37, No. 2, 1990, pp. 783-788. doi:10.1109/23.106715
- J. S. Karp, S. Surti, M. E. Daube-Witherspoon and G. Muehllehner, “Benefit of Time-of-Flight in PET: Experimental and Clinical Results,” Journal of Nuclear Medicine, Vol. 49, No. 3, 2008, pp. 462-470. doi:10.2967/jnumed.107.044834
- G. El Fakhri, S. Surti, C. M. Trott, J. Scheuermann and J. S. Karp, “Improvement in Lesion Detection with WholeBody Oncologic Time-of-Flight PET,” Journal of Nuclear Medicine, Vol. 52, No. 3, 2011, pp. 347-353. doi:10.2967/jnumed.110.080382
- S. R Cherry, “In Vivo Molecular and Genomic Imaging: New Challenges for Imaging Physics,” Physics in Medicine and Biology, Vol. 49, No. 3, 2004, pp. R13-R48. doi:10.1088/0031-9155/49/3/R01
- L. Pan, J. He and L. Ma, “An Initial Simulation Study of PET Imaging by GATE,” 2010 2nd International Conference on Information Science and Engineering (ICISE), Hangzhou, 2010.
- S. Tavernier, P. Bruyndonckx, S. Leonard and O. Devroede, “A High-Resolution PET Detector Based on Continuous Scintillators,” Nuclear Instruments and Methods in Physics Research Section A, Vol. 537, 2005, pp. 321- 325. doi:10.1016/j.nima.2004.08.035
- C. Yong, J. Jin Ho, C. Yong Hyun, O. Devroede, M. Krieguer, P. Bruyndonckx and S. Tavernier, “Optimization of LSO/LuYAP phoswich Detectzor for Small Animal PET,” Nuclear Instruments and Methods in Physics Research Section A, Vol. 571, No. 3, 2007, pp. 669-675. doi:10.1016/j.nima.2006.10.293