Journal of Power and Energy Engineering
Vol.05 No.01(2017), Article ID:73349,15 pages
10.4236/jpee.2017.51002
Photovoltaic Power Potential Analysis in Equator Territorial: Case Study of Makassar City, Indonesia
Muhammad Akbar Sihotang1, Keiichi Okajima2
1Graduate School of System and Information Engineering, University of Tsukuba, Tsukuba, Japan
2Faculty of Engineering, Information and Systems, University of Tsukuba, Tsukuba, Japan

Copyright © 2017 by authors and Scientific Research Publishing Inc.
This work is licensed under the Creative Commons Attribution International License (CC BY 4.0).
http://creativecommons.org/licenses/by/4.0/


Received: November 29, 2016; Accepted: January 7, 2017; Published: January 10, 2017
ABSTRACT
Solar power energy in some countries can be the most potential renewable energy to overcome lack of energy and environmental problems. Indonesia is one of the examples. One of the promising cities to install photovoltaic (PV) systems is Makassar, which has average 5.83 kWh/m2/day of solar irradiance (Meyta, 2011). However, until 2016, there is still no solar panel installation in Makassar (PLN, 2015). In addition, general lack of research in assessing potential of PV systems in Makassar makes PV system difficult to develop. This study therefore set out to assess PV system potential in Makassar which its objectives are to determine 1) total available area for rooftop and large-scale PV systems in Makassar, 2) economy feasibility and 3) environmental impact due to PV installation. Three cases have been analyzed in this study, first, PV systems for residential rooftop, second, PV systems for large-scale (mega solar) in Makassar, and third, PV systems for large scale in outside Makassar and radius 20 km from center of Makassar. ArcGIS10.3 software is carried out to estimate available area for PV installation. Furthermore, RetScreen 4 software was used to conduct PV system capacity and its energy yield and to evaluate economy analysis such as internal rate of return and cost of energy. As the result, the total available area for residential rooftop PV system is evaluated to be 13.8 km2, which potential installed capacity is estimated to be 2044 MW. Total available area for large-scale PV system in Makassar and outside Makassar are 19.3 km2 and 231.3 km2, which estimated 851 MW and 10,179 MW of installed capacity, respectively.
Keywords:
GIS, Rooftop PV System, Large-Scale PV System, Internal Rate of Return (IRR)

1. Introduction
Indonesia is located in south East Asia and consists of five big islands, namely, Sumatera, Java, Kalimantan, Sulawesi and Papua. They spread from east to west, which has total area of 1,910,931 km2. Over the past decade, Indonesia has been achieving economic and population growth making that quality of life of each individual person improves and ultimately causing energy final consumption to grow (Figure 1) [1] . In 2003, energy final consumption reached around 117 million TOE (Ton Oil Equivalent), which increasing 1.5 times higher in 2013 to be around 174 million TOE. It mostly comes from fossil energy, which consists 44% of oil, 30% of coal, and 18% of natural gas [2] . In power generation, Indonesia had an estimated 53 gigawatts (GW) of installed capacity and generated 234 billion kilowatt-hours (kWh) in 2015, according to Indonesia’s Ministry of Energy and Mineral Resources and PLN data. Figure 2 shows Indonesia electricity generation capacity by source in 2015.
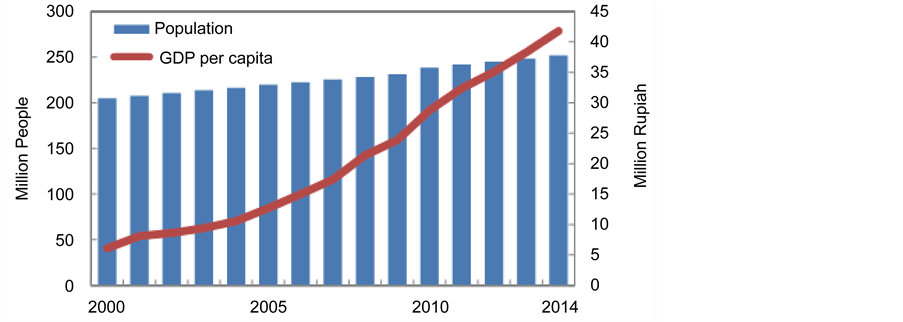
Figure 1. Indonesian population and GDP per capita.

Figure 2. Indonesia electricity generation capacity by source (2015).
Nonetheless, there is an increasing concern that these fossil energies will be no longer cost competitive due to changes in relative price caused by policies or resource depletion. In addition, fossil energy accounted high percentage to CO2 emission, as we know, CO2 is the most prominent substance that leads to environmental problem. Due to notions explained earlier, it can be concluded that the importance to supersede non-renewable energy with the renewable ones is rising for energy consumption sector.
In addition, Indonesia is an archipelago that consists of thousand islands that are not connected into one grid system due to high cost of installations, as the main problem. Thus, up to this point of time, each island needs to produce energy in their areas in order to cover local energy demands. Objectively, Indonesia has a big potential in solar energy because it’s located in the equator line, therefore the solar radiation spread in all Indonesia is relatively constant everywhere. One of the prosperous advantages of solar power energy is that it does not produce CO2 as the results of production residue. According to this reason, solar energy can be one of the most potential renewable energy resources to overcome energy challenges in Indonesia.
Furthermore, technology development in solar power energy and the increased amount of installation of solar power generation all over the world in recent years make the module price of solar panel significantly reduced [3] . However, despite of the high potential of solar energy in Indonesia, only a small amount of solar panel has been installed [4] . Moreover, there is solely small amount of the research in evaluation of solar panel installment potential in Indonesia. This study focuses on Makassar city where comparatively has the huge potential of solar energy installment among other cities in Indonesia. This study aims to examine the potential area to be planted for solar power generation and its effect in the environmental side and economic impact.
2. Study Case
As shown in Figure 3, Makassar is located in Sulawesi Island and it is the capital city of South Sulawesi prefecture where known as the central city for east Indonesia. It has 175.77 km2 areas, and the average solar radiation is about 5.83 kWh/m2/day [5] [6] . By 2015, solar power generation in Makassar has not been built yet. Current mayor of Makassar (2015) has planning to build the first solar power generation in Makassar on 2016 [7] . Makassar has average 15% per year growth rate of electricity demand, when compared to its prefecture’s, South Sulawesi, average growth rate which is 11.5% per year, make Makassar considered as one of the highest in the prefecture in terms of energy demand (Figure 4) [5] . In order to cover the electricity demand, it is necessary to build large number of power generation.
3. Evaluation Methodology
3.1. Case Setting
There are three case setting categories that are modeled in this study, those are the assessment of rooftop PV system in Makassar, the assessment of large scale
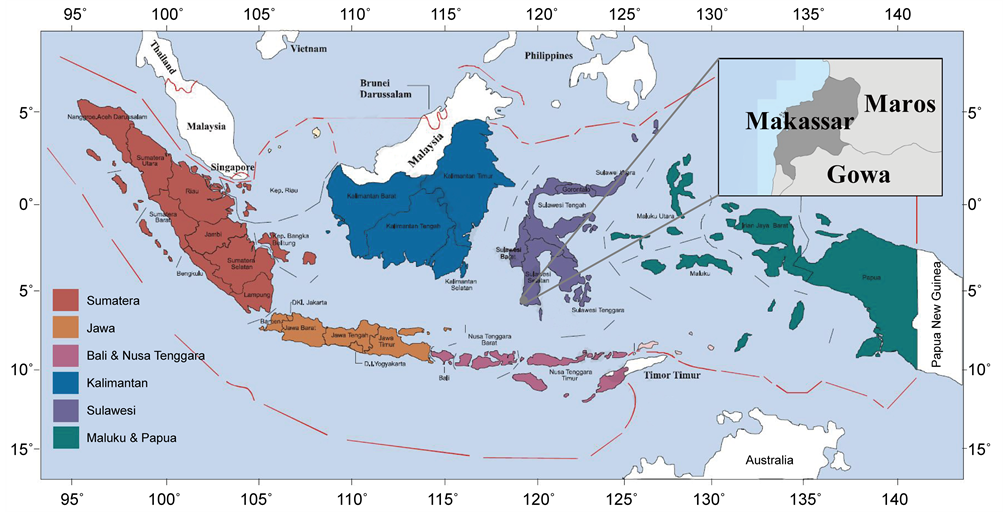
Figure 3. Maps of Indonesia and Makassar.
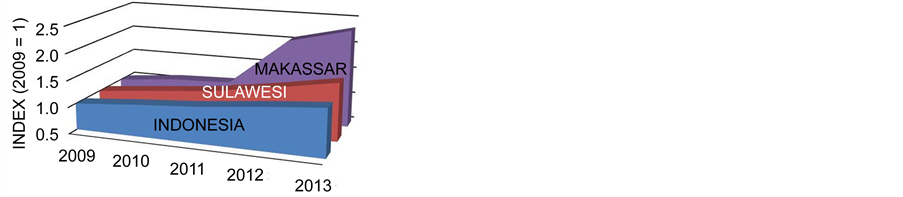
Figure 4. Electricity demand growth.
PV system (mega solar) in Makassar and lastly, the assessment of mega solar outside Makassar with radius 20 km from center of Makassar. Each case estimates total area that can be installed for PV system, the impact from its installation to environment and analysis in economic feasibility. The overview of case setting is shown in Figure 5.
Estimation of PV-suitable rooftop area is determined by using GIS (Geographic Information System) with specifically is examined by using ArcGIS 10.3 software. PV power generation, environmental impact and analysis in economy are conducted using RetScreen 4, which is software that used for simulating and calculating a clean energy project such as renewable energy and energy efficiency.
3.2. Overview of the Proposed Methodology
The proposed methodological approach is visualized in Figure 6.
First, ArcGIS software is used to analyze land use and divides into three cases. Using the same software each case can be extracted and by using RetScreen, with the input of panel characteristic, solar irradiance and temperature, total power generation can be obtained. Using the same software, economic evaluation such
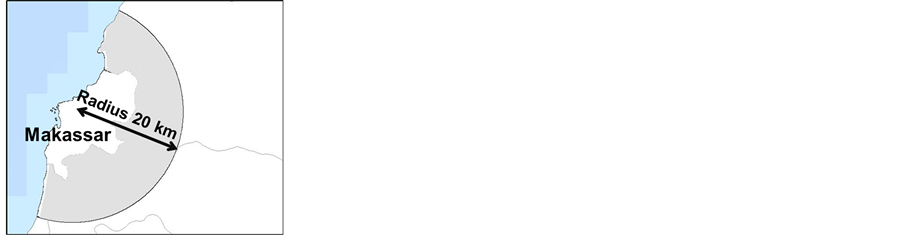
Figure 5. Case setting overview.
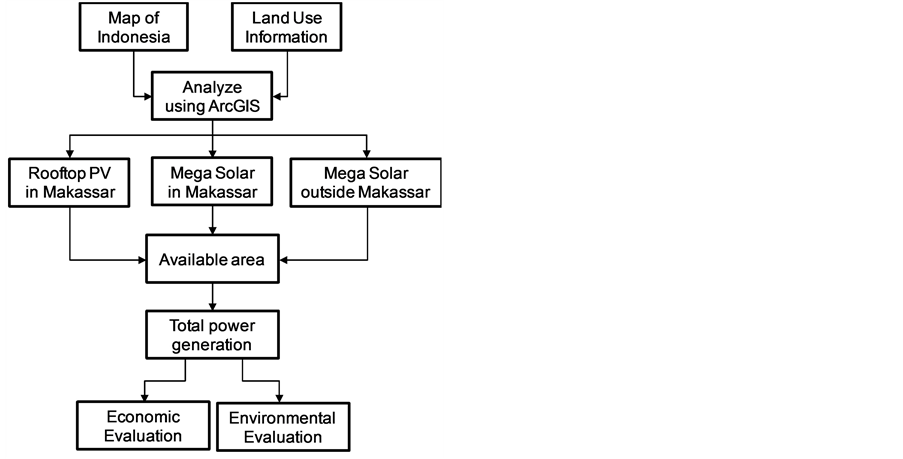
Figure 6. Step by step of proposed methodology.
as cost of energy and internal rate of return and environmental evaluation, for instance like greenhouse gas analysis, are conducted to produce more prominent analysis.
3.3. Assessment of Installation Area
1) Rooftop PV System
PV system installation areas are calculated using Equation (1). Land use is carried out to calculate the area of a residential building, while the resulting area that can be introduced residential PV system is calculated by multiplying the coefficients shown in Equation (1). Data of land use were obtained from the Indonesian Ministry of Forestry (2011).
 (1)
(1)
Cv is void rate coefficient, Cs is shadow rate coefficient, Cf is facility rate coefficient, Ab is area of the possible building, while Aa is the area of the possible housing [8] . We used Salvador Izquierdo research to determine its coefficient value, which respectively, obtained as 0.58, 0.43 and 0.78 [8] . By dividing the area that can possibly install the PV system to the area of the panel, installed capacity of residential PV systems can be determined.
2) Mega Solar
Area that can be installed to mega solar extracted from land of use with the criteria as the following; bush, dry land farming and swamp. From all of these criteria, the total area is calculated, and by multiplying with building coefficient factor, the availability area that can be installed to PV system can be determined. Building coefficient factor value set to 0.9 and for each km2 can be installed to 44 MW of PV System capacities [9] .
3.4. Solar Irradiance and Temperature
Makassar laid in equator line which make there is no significant change in seasonal condition. Generally, there are only two seasons in Indonesia, as well as in Makassar which are wet and dry seasons. Nevertheless, based on the historical evidences, Makassar is dominated by dry season. Solar irradiance data is obtained from NASA and from IDMP station which located in University of Makassar [10] [11] . NASA’s data is the average value of solar irradiance in 23 years span between 1983 and 2005. In the other hand, data from IDMP is the average value between 1995 and 2000. Figure 7 shows solar irradiance from NASA and IDMP. The temperature was obtained from meteorology and geophysics station that located in center of Makassar and in the airport in Makassar. The average of solar irradiance in Makassar city is 5.87 kWh/m2/day (NASA) and 6.01 kWh/m2/day (IDMP).
3.5. Analysis of PV System Generated Capacity
1) Panel Characteristic
Panel specification is shows in Table 1. BP Solar is used for simulation due to its’ big share in Indonesian market.
2) Calculation of PV Power Generation
The solar radiation amount per time that is incident on the PV array obtained from Equation (2).
 (2)
(2)
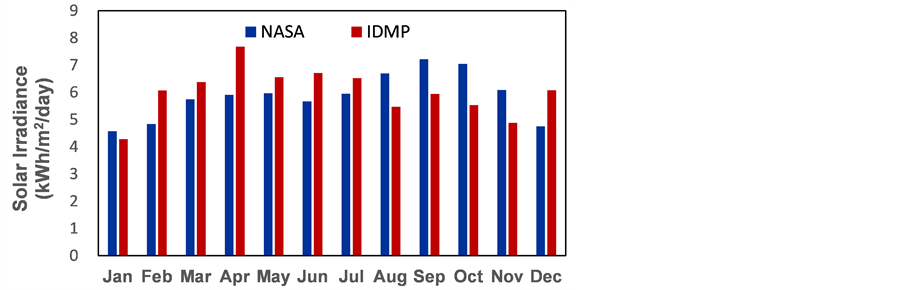
Figure 7. Solar irradiance in Makassar.

Table 1. Panel specification.
Ht is hourly irradiance in the plane of the PV array, H is global horizontal irradiance and it’s diffuse and beam components are Hd and Hb. Rb is ratio of incident solar irradiance, β is the slope of PV array, ρ represents the diffuse reflectance of the ground. Calculation of Ht is conducted using isotropic model (Duffie and Bekman (1991)) which assume using the combination of diffuse and ground-reflected radiation [12] .
Furthermore, total amount per day of solar irradiance is calculated by summing solar irradiance per hour as shown in Equation (3).
 (3)
(3)
PV array efficiency ηp is a function from module average temperature Tc and can be calculated using Equation (4).
 (4)
(4)
ηr is PV module efficiency at reference temperature (25˚C), βp is coefficient temperature of PV module and Tr is average ambient temperature calculated using Evan function. PV power generation Egrid is obtained by using Equation (5). This is the calculation of the energy delivered by the PV array ( ) with the reduction from miscellaneous PV array losses, other power conditioning losses and inverter losses. S is PV array area, lp is miscellaneous PV array losses rate, lc is inverter losses rate and ηinv is inverter efficiency.
 (5)
(5)
3) Panel slope and direction setting
Residential house in Makassar city are built in many directions to make it hard to assess the actual potential of PV system when PV panel located solely in particular direction. Due to the form of rooftop in Makassar, possible angle of slope set is restricted and assume to be 20˚. Panel azimuth change with 20˚ interval from 0˚ to 180˚ and it was determined towards azimuth angle of the maxi- mum amount of power generation.
In the case of mega solar, the panel slope angle change between 0˚, 10˚, 20˚, 30˚ while panel azimuth changed from 0˚ (south-facing) until 180˚ (northward) in 15˚ intervals, in order to optimize the annual power generation.
4) Power demand
In 2013, annual electricity demand in the Makassar City is 2.73 million MWh, which make Makassar as the highest power demand in South Sulawesi Province [5] . Due to lack data of electricity demand for each month in Makassar, three big province name DKI Jakarta, DIY, Tegal are used as reference. From these three provinces, DKI Jakarta is chosen as reference because have similar characteristic with Makassar.
3.6. Analysis of CO2 Emission from PV Installation
Annual CO2 emission reduction due to the introduction of the PV system is calculated using Equation (6).
 (6)
(6)
 is annual CO2 emission reduction [t-CO2/yr], RFco2 (t-CO2/MWh) is CO2 emission factor, EG (MWh/yr) is annual energy production by PV systems. According to State Electricity Company (PLN: Perusahaan Listrik Negara), CO2 emission factor in Indonesia in 2014 is 0.741 t-CO2/MWh.
3.7. Economic Evaluation Due to PV Installment
In 2013, Ministry of Mineral and Energy Resource has regulated FIT (Feed-in Tariff) regulation. This regulation has been revised in 2016 which the content is to obligates State Electricity Company to buy solar generated electricity by range between 14.5 ~ 23 cents $/kWh depends on the installment location [13] . The purchase price in Makassar set out to 16 cents $/kWh. In addition, the government determines the purchasing period as 20 years and can be renewed afterward. However, considering the life period of PV panel, the project period for this study set to 25 years.
1) Rooftop PV System Cost
Based on the previous published research, cost for rooftop PV system will vary between USD 2000 and USD 4000 per kW depends on the location. In Indonesia the cost for rooftop PV system per kW set to USD 2800 as presented in Table 2 [14] . PV system life period is 25 years; inverter life period is defined into two cases, for 5 years and 10 years. This is because, most of the inverter sold in Indonesia has expected life time for 5 years but the recent technology makes inverter life longer to 10 years. There is no annual maintenance cost for rooftop PV system except that from the exchange of inverter.
Table 2. PV system cost per 1 kW.
2) Mega Solar Cost
The cost for mega solar is same with the rooftop PV system cost except for additional price on land purchase price. The price is USD 100/m2 for inside Makassar City and USD 20/m2 for outside Makassar (2014 price) [15] .
4. Result
4.1. Land Use in Makassar
Figure 8 shows land use in Makassar and outside Makassar with radius 20 km from the center of Makassar. Black solid line indicates the Makassar boundary.
According to Figure 8, only a small amount of residential exists in outside Makassar. From this figure, suitable total area and possible installed capacity are extracted and presented in Table 3.
Table 3 shows the total area for mega solar in Makassar is slightly higher than possible rooftop area in Makassar with installed capacity shows the opposite. This phenomenon occurred due to difference capacity that can be installed per unit area. In mega solar, the capacity is restricted to 44 MW per 1 km2 area while for rooftop, all available area can be installed for PV system. The result of the land use in Makassar shared as follow; 40% is residential, 24% for agricultural land (paddy field), 11% for fishpond, 13% is water area and mangrove. Thus, 12% of area in Makassar potentially builds for mega solar.

Figure 8. Land use in Makassar and outside Makassar with radius 20 km from center of Makassar.
Table 3. PV system installed area and capacity.
4.2. Rooftop PV System
Optimization of annual PV power generation is gained in case the panel slope angle is set to 20˚ when azimuth angle set to direction northward (180˚). The result of PV power generation each month is shown on Figure 9. The same figure also visualizes electricity demand and its percentage compare to PV power generation. EG stands for electricity generation while ED for electricity demand.
Annual PV power generation calculated from NASA solar irradiance is 3.40 million MWh. On the other hand, using IDMP solar irradiance can get 3.48 million MWh of the annual PV power generation. PV power generation can reduce 2.52 Mt-CO2 (NASA) and or 2.58 Mt-CO2 (IDMP). There is different measurement method of solar irradiance between NASA and IDMP that lead to different result in PV power generation. However, the result of annual PV power generation and reduction of CO2 are not significantly different. Figure 9 shows either NASA or IDMP shows same tendency which generate more electricity than its demand between March until August and December.
Table 4 presented economy analysis of rooftop PV system. Cost of energy and IRR (Internal Rate of Return) are estimated to indicate the possibility of installation PV system. These result shows there is a huge disparity on cost of energy and IRR comparing between inverter which has 5 years lifetime and 10 years life time. It can therefore to be assumed that inverter life time has a key role in PV system growth. IRR is the economic indicator used in this analysis to assess the profitability of a certain PV system investment. If this value is greater than 0% it may indicate that the investment could be profitable. Although the IRR is not too high for PV system with 5 years’ inverters, this system is profitable enough and could be considered feasible.
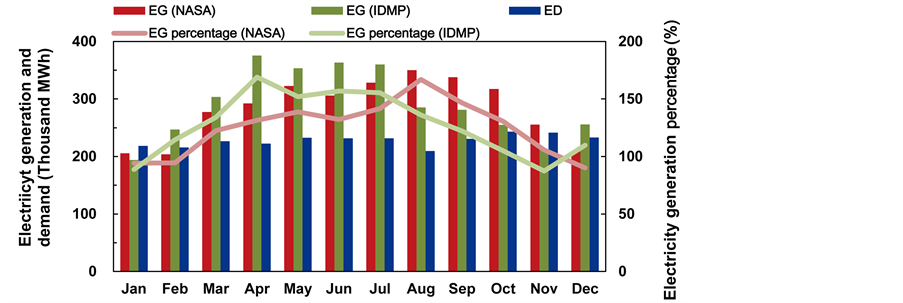
Figure 9. Rooftop PV power generation.
Table 4. Economy analysis of rooftop PV system.
The next indicator used in this analysis is cost of energy. Compare to household electricity tariff which is 1460 Rp/kWh (USD2016 0.11/kWh) as of October 2016, cost of energy (with subsidies) of PV system with 5 years’ inverter (around USD 0.13/kWh) is still slightly higher. There is a significant improvement with 10 years’ inverter PV system, to make the cost of energy per kWh is cheaper compare to the household electricity tariff.
4.3. Mega Solar in Makassar
To gain the optimization of annual PV power generation panel slope angle is set to 10˚, and azimuth angle set to direction northward (180˚). The result of PV power generation each month is shown on Figure 10. The same figure also visualizes electricity demand and percentage of PV power generation compare to electricity demand.
Annual PV power generation calculated from NASA solar irradiance is 1.44 million MWh. On the other hand, using IDMP solar irradiance can get 1.47 million MWh of the annual PV power generation. PV power generation can reduce by 1.07 Mt-CO2 (NASA) and or by 1.09 Mt-CO2 (IDMP). Either NASA or IDMP generate less electricity than its demand in the whole year. Albeit total possible area to install mega solar larger than rooftop, the PV system capacities from mega solar is not directly proportional which make electricity generated from this case does not sufficient to power up Makassar.
Table 5 presented economy analysis of mega solar PV system in Makassar. These results show that there is a huge disparity on cost of energy and IRR comparing between 5 years’ inverter system and 10 years’ inverter system which make IRR in 10 years’ inverter system around three times higher compare to 5
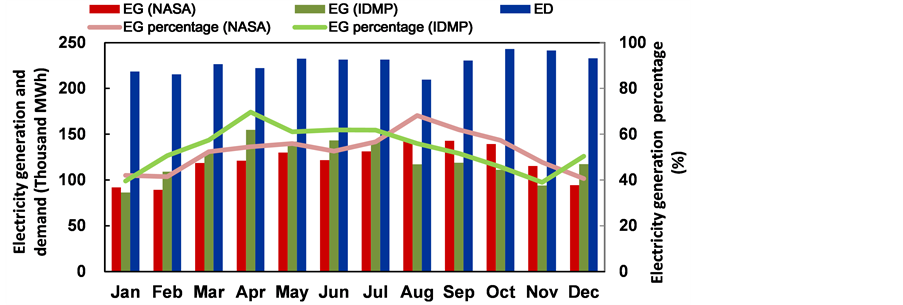
Figure 10. Mega Solar power generation in Makassar.
Table 5. Economy analysis of mega solar in Makassar.
years’ inverter system. The cost of energy of PV system in this case is range between USD 0.11/kWh to USD 0.15/kWh to make it same for 10 years’ inverter system and much higher for 5 years’ inverter compare to household electricity tariff.
4.4. Mega Solar Outside Makassar
To gain the optimization of annual PV power generation panel slope angle is set to 10˚, and azimuth angle set to direction northward (180˚). The result of PV power generation each month is shown on Figure 11. The same figure also visualizes electricity demand and PV power generation percentage compare to electricity demand.
Annual PV power generation calculated from NASA solar irradiance is 17.2 Thousand GWh. On the other hand, using IDMP solar irradiance can get 17.5 thousand MWh of the annual PV power generation. PV power generation can reduce by 12.75 Mt-CO2 (NASA) and or by 13.0 Mt-CO2 (IDMP). Figure 11 depicts that there is large potential for mega solar outside Makassar which the PV power generation is six times higher than electricity demand in 2014.
Table 6 presented economy analysis of the mega solar outside Makassar. These table show that there is a huge disparity on cost of energy and IRR comparing between 5 years’ inverter system and 10 years’ inverter system which make IRR in 10 years’ inverter system around two times higher compare to 5 years’ inverter system. Moreover, although the IRR is not too high for PV system with 5 years’ inverters, this system is profitable enough and could be considered feasible. The cost of energy of PV system in this case is range between USD 0.09/kWh to USD 0.13/kWh to make it cheaper for 10 years’ inverter system and higher for 5 years’ inverter system compare to household electricity tariff.
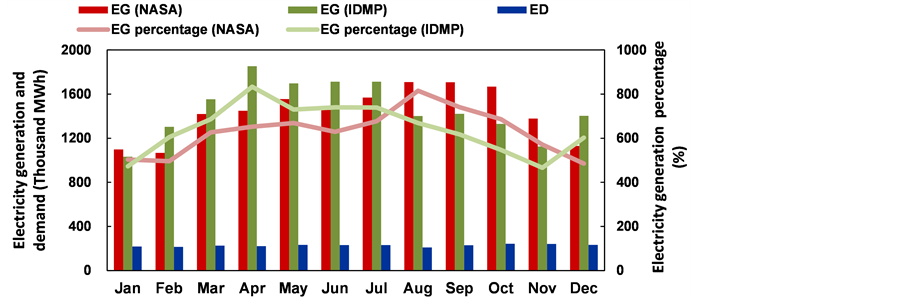
Figure 11. Mega Solar power generation in Makassar.
Table 6. Economy analysis of mega solar outside Makassar.
4.5. Comparison of Each Case
Table 7 presented the summary of comparison between each case.
Total available area for residential rooftop PV system is evaluated to be 13.8 km2, which is the least when compared to others case. But, it can produce more power when compare to mega solar inside Makassar. This is because PV panel can be inserted in all of available area while for mega solar area is estimated as 44 MW for each km2. In rooftop PV system, potential installed capacity is estimated 2044 MW while for large-scale PV system in Makassar and outside Makassar are 851 MW and 10,179 MW respectively. Total available area for large-scale PV system in Makassar and outside Makassar are 19.3 km2 and 231.3 km2 which can produce electricity 5 times and 62 times higher than the electricity demand (or about 1.44 million and 17.21 million MWh respectively). The remarkably higher of available area for mega solar outside Makassar is due to small occupancy for settlement and high proportion for mega solar area (dry land farming, bush and swamp) which occupied for about 43.8% of the total area. Mega solar PV power generation has the smallest IRR and the highest cost of energy. When inverter life time is 10 years its value is 4.6% for IRR and USD 106.17/MWh for cost of energy. On the other hand, rooftop PV and mega solar outside Makassar has a higher IRR which is 6.8% and 6.4% respectively. It could be argued that the higher IRR for rooftop results were due there was no additional cost for land purchasing while for mega solar outside Makassar the land price is much cheaper compare to thus inside Makassar. The rooftop PV system has the cheapest cost of energy which is USD 91.51/MWh to make it cheaper compare to household electricity tariff in 2016.
5. Conclusions
Solar power energy in some countries that are located in equator, such as Indonesia, can be the most potential renewable energy to overcome lack of energy and environmental problems. One of the most promising cities in Indonesia to install photovoltaic (PV) systems is Makassar, which has average 5.9 kWh/m2/day of solar irradiance. Within the scope of this research, three cases have been analyzed, which are PV systems for residential rooftop, PV systems for large-scale
Table 7. PV system installed area and capacity.
(mega solar) in Makassar, and PV systems for large scale in outside Makassar and radius 20 km from center of Makassar. ArcGIS software is used in order to evaluate amount of available PV installation capacity, while RetScreen is carried out to conduct energy simulation and to evaluate economy analysis.
There was no significant different between annual result of solar power generation in each case, although the two different solar irradiance data were used in this study. Energy price calculated from 10 years inverter PV system has possibility to get cheaper as compared to basic electricity price. This is because the maintenance cost due to the replacement of inverter can be reduced highly if the life time expectancy sets to 10 years. Thus, inverter life time has important role for the development of using PV system. Overall, the results of this study indicate that there is possibility for PV market to grow in Makassar although it is limited by some conditions such as inverters life time, thanks to the presence of FIT regulation.
The major limitation of this study is the lack of solar irradiance actual measurement data and PV panel price. Therefore, further studies need to be carried out in order to validate these results using the sensitivity analysis. In addition, future study investigating the effect of carbon price on the financial analysis would also be very interesting to conduct.
Cite this paper
Sihotang, M.A. and Okajima, K. (2017) Photovoltaic Power Potential Analysis in Equator Territorial: Case Study of Makassar City, Indonesia. Journal of Power and Energy Engineering, 5, 15-29. http://dx.doi.org/10.4236/jpee.2017.51002
References
- 1. Sub-Directorate of Statistical Compilation and Publication (2015) Statistical Yearbook of Indonesia 2015 Statistics Indonesia, BPS-Statistics Indonesia.
http://www.bps.go.id/index.php/publikasi/1045 - 2. Zed, F., et al. (2014) Outlook Energy Indonesia 2014. National Energy Council of Indonesia.
- 3. Pillai, U. (2015) Drivers of Cost Reduction of Solar Photovoltaic. Energy Economics, 50, 286-293.
https://doi.org/10.1016/j.eneco.2015.05.015 - 4. State Electricity Company (2014) Rencana Usaha Penyedian Tenaga Listrik (RUPTL) PT PLN (PERSERO) 2015-2024. 27-29.
http://www.djk.esdm.go.id/pdf/RUPTL/RUPTL%20PLN%202015-2024.pdf - 5. Central Board of Statistic of Makassar (2014) Makassar in Figures 2014. UD Areso Press, Makassar.
- 6. Rumbayan, M., Abudureyimu, A. and Nagasaka, K. (2012) Mapping of Solar Energy Potential in Indonesia Using Artificial Neural Network and Geographical Information System. Renewable and Sustainable Energy Reviews, 16, 1437-1449.
https://doi.org/10.1016/j.rser.2011.11.024 - 7. Hasanuddin, M. (2015) Pemkot Makassar siapkan pembangkit listrik tenaga surya. Antara News Makassar. (Indonesian Language)
http://makassar.antaranews.com - 8. Izquierdo, S., Rodrigues, M. and Fueyo, N. (2008) A Method for Estimating the Geographical Distribution of the Available Roof Surface Area for Large-Scale Photovoltaic Energy-Potential Evaluations. Solar Energy, 82, 929-939.
https://doi.org/10.1016/j.solener.2008.03.007 - 9. Kawase, M., Okajima, K. and Uchiyama, Y. (2012) Estimating the Geographical Distribution of the Available Area for Large-Scale Photovoltaic Energy-Potential Evaluations in Liaoning, China. International Conference on Applied Energy, Suzhou, 5-8 July 2012, 686-692.
- 10. Atmospheric Science Data Center. NASA Surface Meteorology and Solar Energy.
http://eosweb.larc.nasa.gov/sse - 11. Baharuddin, M. and Ishak, T. (2012) Analisis Ketersedian Radiasi Matahari di Makassar. Prosiding Hasil Penelitian Fakultas Teknik. (Indonesian Language)
- 12. Duffie, J.A. and Beckman, W.A. (2013) Solar Engineering of Thermal Process. 4th Edition, John Wiley & Sons, Inc., Hoboken.
https://doi.org/10.1002/9781118671603 - 13. (2016) Regulation of the Minister of Energy and Mineral Resources of the Republic of Indonesia. Appendix I, 22. (Indonesian Language)
- 14. Tarigan, E., Djuwari and Kartikasari, F.D.(2015) Techno-Economic Simulation of a Grid-Connected PV System Design as Specifically Applied to Residential in Surabaya, Indonesia. Energy Procedia, 65, 90-99.
https://doi.org/10.1016/j.egypro.2015.01.038 - 15. Anjungroso, F. (2014) Hargatanahdan property di Makassar tertinggisetelah Jakarta. Tribunnews. (Indonesian Language)
http://tribunnews.com