Open Journal of Soil Science
Vol.4 No.2(2014), Article ID:42917,8 pages DOI:10.4236/ojss.2014.42009
Effect of Land Use Change on Carbon Content and CO2 Flux of Cloud Forest Soils, Santa Elena, Costa Rica
![]()
1Department of Biological Sciences, Le Moyne College, Syracuse, USA; 2Pottstown Memorial Medical Center, Pottstown, USA.
Email: tannerlh@lemoyne.edu
Copyright © 2014 Lawrence H. Tanner et al. This is an open access article distributed under the Creative Commons Attribution License, which permits unrestricted use, distribution, and reproduction in any medium, provided the original work is properly cited. In accordance of the Creative Commons Attribution License all Copyrights © 2014 are reserved for SCIRP and the owner of the intellectual property Lawrence H. Tanner et al. All Copyright © 2014 are guarded by law and by SCIRP as a guardian.
Received December 31st, 2013; revised January 31st, 2014; accepted February 7th, 2014
KEYWORDS
Cloud Forest; Secondary Succession; Soil Carbon; Soil Nitrogen; Soil CO2 Flux
ABSTRACT
We investigated the effects of land-use changes on soil carbon storage and soil CO2 flux by comparing soils from mature cloud forest and 31-year-old secondary forest, both in the Santa Elena Forest Reserve, a municipallyowned reserve at an elevation of 1600 to 1700 m near the town of Monteverde, and a clear-cut pasture near the reserve. Soils in the mature forest exhibit only weak horizonation but typically thick A horizons; they also consistently yield the highest carbon contents in the upper 30 cm. Soil CO2 flux was the highest in these soils, but also displayed the highest spatial variability. Secondary forest soils contain substantially less soil carbon than mature forest soils, but more than pasture soils. CO2 flux in the secondary forest soils was more similar to that of the mature forest, but displayed lower spatial variability. The pasture soils contain less soil carbon and produced lower CO2 flux levels than either of the forest soils. The pasture soils typically contain a well-defined coarse sandy layer 10 to 20 cm below the surface that we interpret as a sediment layer deposited across much of the landscape following a widespread erosion event, likely a consequence of the clear-cutting. Soil nitrogen concentrations are more than an order of magnitude lower than soil carbon concentrations, and display no trends between the different landscapes examined. Our preliminary results suggest that reforestation does restore soil carbon to clear-cut landscapes, but returning soil carbon levels to pre-land use levels occurs at a time scale of centuries, rather than decades.
1. Introduction
Modeling of the anthropogenic climate change anticipated in the coming decades requires a thorough understanding of the carbon cycle, in particular, the various sources and sinks of carbon exchangeable on short (decadal) time scales. Multiple studies have estimated both the reservoirs and fluxes of carbon from terrestrial and marine reservoirs [1]. Early studies of carbon cycling recognized the importance of land-use changes, deforestation and afforestation in particular, and attendant fluctuations in above-ground biomass carbon in contributing to fluctuations in the atmospheric reservoir. For example, Mellilo and others [2] estimated that deforestation contributes 23% of the anthropogenic CO2 increase to the atmospheric reservoir, 75% of which is from aboveground biomass, and the remainder from lost soil carbon. However, fewer studies have examined quantitatively the changes in soil carbon stocks that accompany these landuse changes. As much as c. 2300 Gt C is stored globally in soils and terrestrial sediments [3], of which perhaps 30% is stored in tropical forests. The past two decades have seen increasing attention to this topic [4-8], but our knowledge of carbon flux rates in tropical systems remains limited. A more complete understanding of the rates of change of these carbon stocks will be required to track accurately the changes in the global carbon cycle. Additionally, predicting changes in the size of these carbon reservoirs in the future, required for effective modeling of potential climate change, will demand knowledge of how these fluxes will vary as a response to on-going and anticipated climate changes.
Much of Costa Rica’s mature forest was cleared during the 20th century, primarily for agricultural use and timber. Fortuitously, a significant portion of this land has been reforested in recent decades through government intervention, including payments to landowners for environmental services [9]. Consequently, there are numerous stands of secondary forest of varying age throughout the country, which creates opportunities to study changes in carbon stocks during secondary succession. This study compared the soil composition, specifically carbon and nitrogen content, and CO2 flux from soils in adjacent areas of mature forest, 31-year secondary forest, and active pasture in the Monteverde cloud forest region.
2. Study Area
The Santa Elena Cloud Forest Reserve (Riserva Bosque Nubosa Santa Elena), located 5 km northeast of the village of Santa Elena, Puntarenas Province (Figure 1), is a community-operated private forest reserve bordering the Monteverde Conservation area. The region is known for the cloud forests on the western slopes of the Cordillera de Tilarán. Leeward cloud forests (sensu Lawton and Dryer [10]), are tropical montane evergreen forests that obtain significant moisture from fog drip. In Costa Rica, they occur on the Pacific-facing slopes of the Cordillera de Tilarán where trade winds are forced above the lifting condensation point.
The climate of the region is characterized by three seasons: a wet season from May to October; a transitional misty-windy season from November to January; and the dry season from February to April [10]. Even during the dry season, fog drip keeps the soils continuously moist. In the Monteverde region, these soils, which formed on
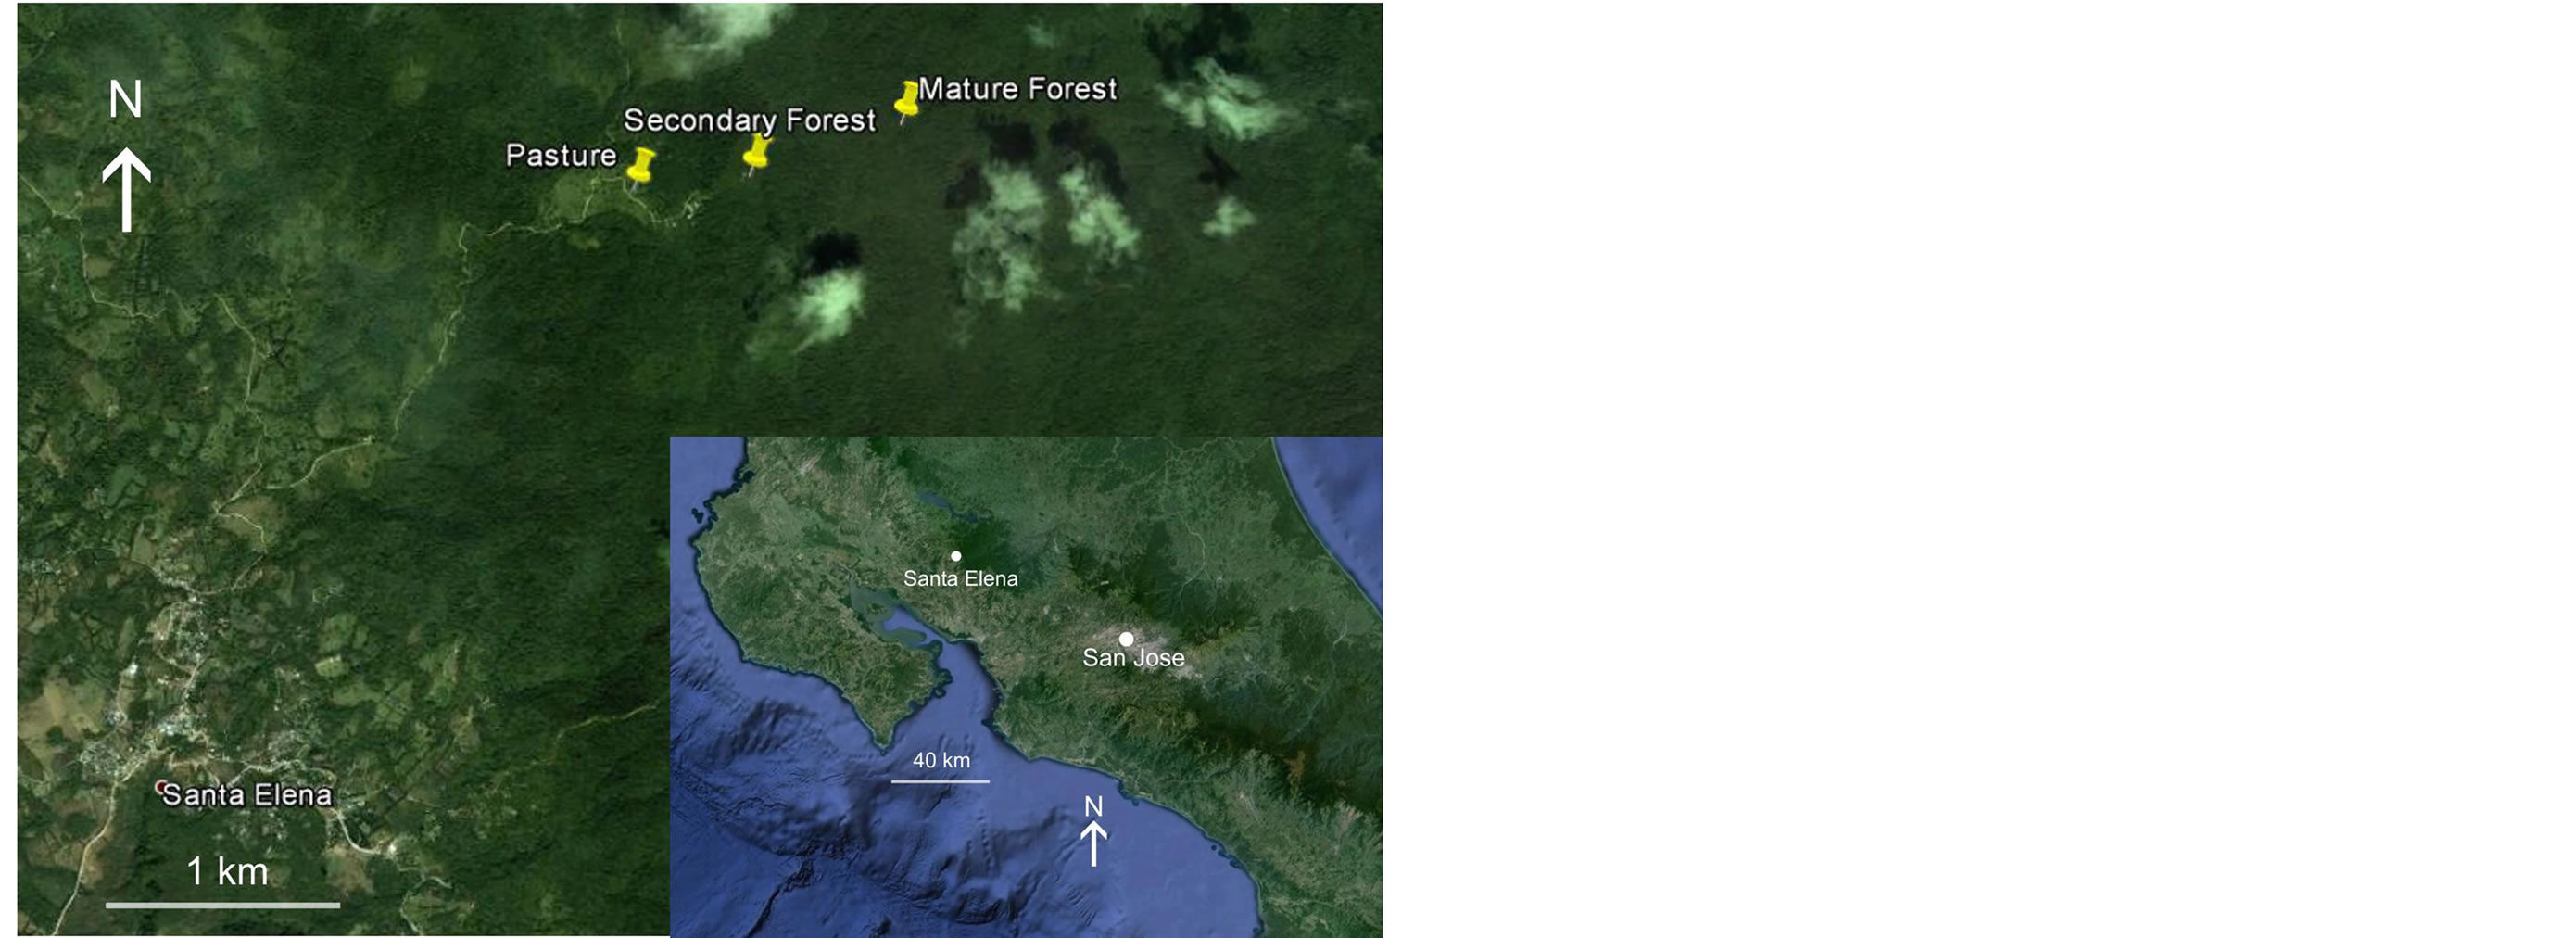
Figure 1. Aerial view of the location of the study area and sample sites in the highlands of western Costa Rica. These views, adapted from Google Earth® imagery (acquisition date: 28/03/2002) demonstrate the extent of regional deforestation.
rhyolites, are classed as Typic Dystrandepts [11]. The mature forest is characterized by an upper canopy, in which the taller trees, dominantly Ocotea tonduzii, Heliocarpus appendiculatus and Cecropia polyphlebia, are 15 m to 30 m tall, a well-developed sub-canopy, and epiphytes are diverse and abundant (Figure 2(A)) [12]. Secondary forests are characterized by fast-growing, tall, sun-seeking species such as Ochroma pyramidale [13] and a denser shrub layer than the mature forest (Figure 2(B)). Pastures bordering forests are clear-cut fields densely rooted by grasses that are actively grazed by livestock, thereby preventing reforestation (Figure 2(C)).
3. Methods
All sampling was conducted during the dry season month of January. In each of the three sampling environments (mature forest, secondary forest, pasture), ten soil cores were drilled with a hand coring tube with a 6 cm internal diameter. The geographic coordinates of each core location was recorded from GPS. Leaf litter was cleared from the core site prior to drilling. Each core was drilled to a minimum depth of 30 cm. The core was logged for color and grain size prior to sampling. Each sample consisted of a longitudinal split of the core containing a continuous 10 cm interval (0 - 10 cm, 10 - 20 cm, 20 - 30 cm). Three soil-CO2 flux measurements were made at each coring site with a Li-Cor LI-8100A® soil gas chamber system equipped with a 20 cm-diameter collection chamber and soil moisture and temperature probes. The collection chamber was set on a soil collar with variable vertical offset. CO2 concentrations were measured continuously for 90 seconds following a 45 second purge cycle and the soil CO2 flux calculated from the regression line in units of μmol CO2/sec/m2.
In the laboratory, the carbon and nitrogen content of the soil samples were measured from the soil cores. Each core was sterilized with dry heat, homogenized, sieved with a 2 mm screen to remove larger rocks and root fragments, and the sub-2 mm fraction pulverized. From each processed sample, 0.1 to 0.125 g was drawn for analysis with a Leco TruSpec CN® by combustion in a pure O2 atmosphere at 950˚C. The weight percent carbon and nitrogen were calculated from the composition of the evolved gases as measured by infrared and thermal conductivity cells, respectively. In summary, the data collected at each of the three study sites included measurements of carbon and nitrogen from the three splits of each of the 10 cores and 30 soil CO2 flux measurements.
4. Soil Characteristics
The characteristics of each of the 30 soil cores were described prior to sampling, with particular note of color (using Munsell soil color designation), grain size and root density.
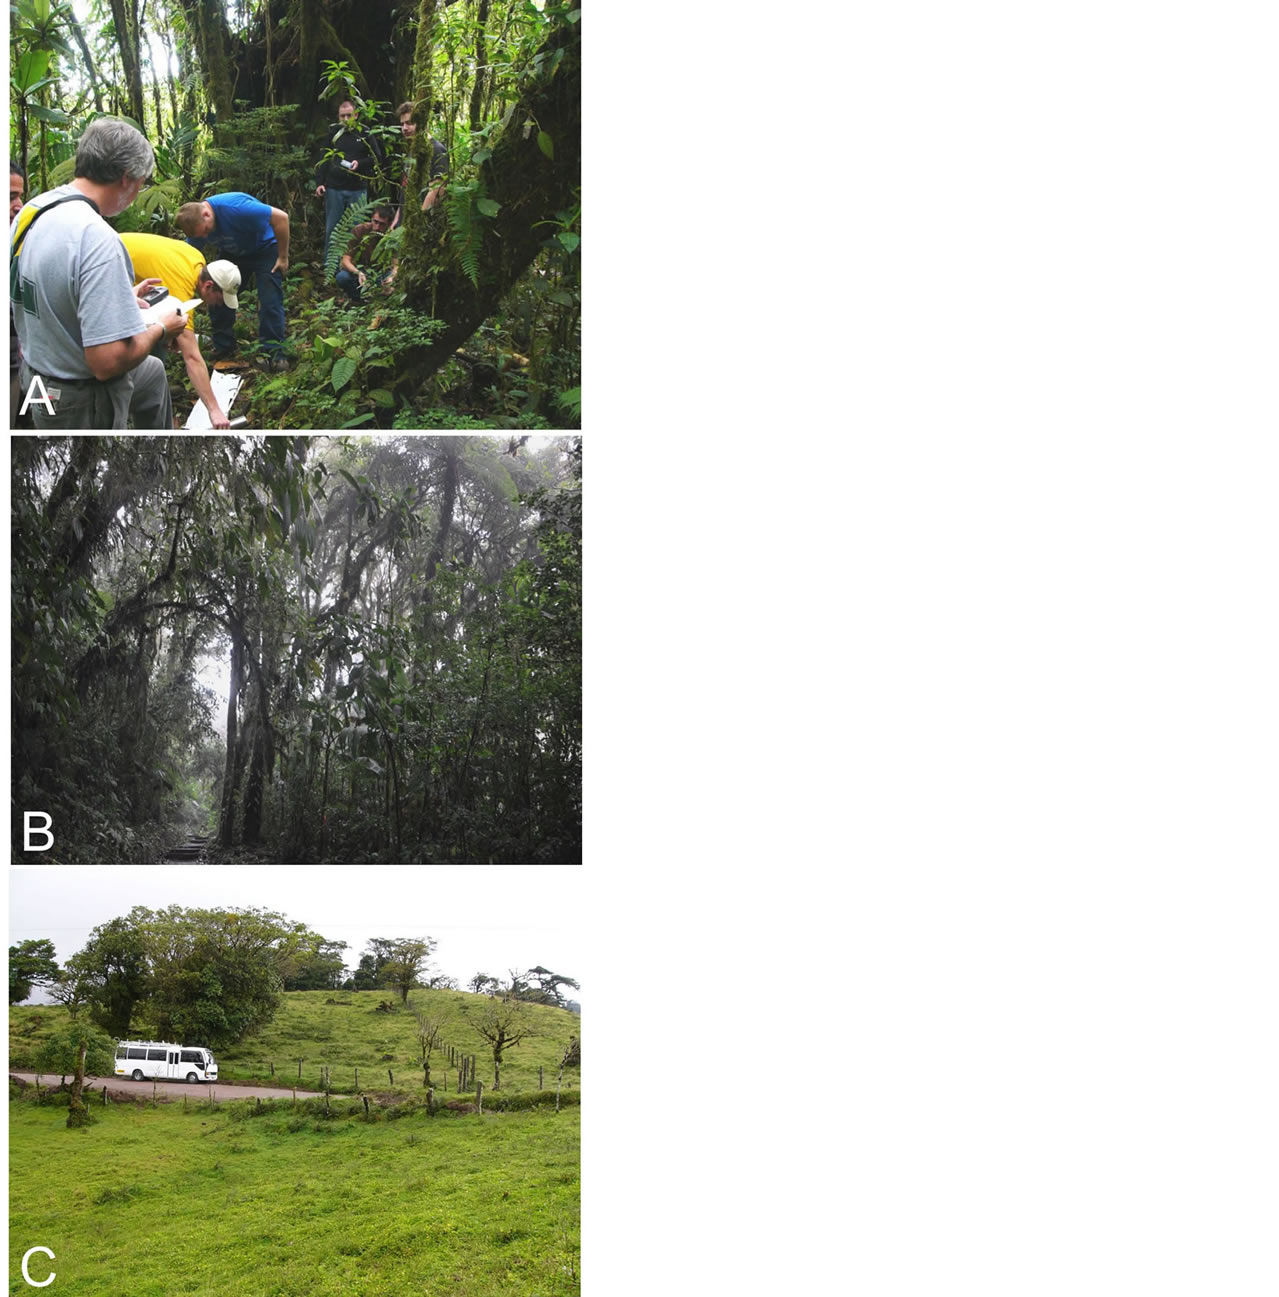
Figure 2. Views of the various landscape types near Santa Elena used in this study. (A) Mature forest stand of indeterminate age in the interior of the Santa Elena Forest Reserve characterized by large diameter trees, abundant vines, lianas and epiphytes, but irregular canopy. (B) Secondary forest (near the entrance to the reserve) that was established in 1976, characterized by smaller diameter trees but more uniform canopy, largely lacking vines and lianas. (C) Pasture near the Santa Elena Forest Reserve estimated to have been in use for more than 30 years.
4.1. Pasture
A field just outside the village of Santa Elena and near the Santa Elena Forest Reserve was chosen to represent the baseline for secondary succession of these cloud forests (Figure 1). The field is an actively grazed pasture that has been in use for more than 30 years and is mostly treeless and lacks large shrubs. The surface is covered with broad-leaved grasses and low shrubs (Figure 2(C)). The soils here form composite profiles with distinct A and C horizons, but thin or indistinct O and B horizons (Figure 3(A)).
The O horizon in the 10 cores from this site is thin (<1 cm) to absent. All cores consistently display an A horizon with a thickness of 10 cm to at most 20 cm that is dark reddish-brown (5YR 3/4), heavily rooted for most of its thickness, and consists of sandy loam. The B horizon is indistinct and thin, typically 5 cm thick, light yellowish-brown in color (2.5Y 7/4) and coarser grained, forming a transition to a coarse C horizon below. The C horizon is a coarse-grained layer, 6 cm to 10 cm thick consisting of a mixture of sand to pebbles, in varying proportions, but typically very pebbly. Beneath the C horizon in each of the cores from this location is a dark grayish-brown (2.5Y 4/2), finer grained horizon, 6 cm to 7 cm thick, that may represent an A2 horizon that was buried following forest clear-cutting. This interpretation is supported by the presence of lighter colored layer, possibly a B2 horizon, below the interpreted A2 horizon. This interpretation would be explained if clear-cutting of the forest was followed by significant erosion and sediment redeposition on the landscape, at least at the local level.
4.2. Secondary Forest
Portions of the Santa Elena Forest Reserve closest to the entrance were clear-cut and allowed to reforest starting in 1976; the soils here were sampled in 2007, therefore the secondary forest had grown for 31 years at the time of sampling. The secondary forest has a relatively even upper canopy with few gaps, but a low basal stand area and a thick understory/ground layer (Figure 2(B)). Soil profiles in the secondary forest exhibit well-developed A and B horizons, whereas the O horizon is thin or poorly developed and C horizons are present locally (Figure 3(C)).
These secondary forest soils consistently exhibit a thin (1 cm to 2 cm) O horizon overlying a well-defined brown to very dark brown (7.5R 4/3 to 7.5YR 2.5/3) A horizon of variable (10 cm to 25 cm) thickness. The A horizon is heavily rooted to a depth of 5 cm to 10 cm. The underlying B horizon is typically much coarser grained, with a substantial coarse sand to granule component, mixed with translocated silt and clay, and is coarsest near the contact with the A horizon, with less coarse material down core. The color of the B horizon is variable, ranging from dark brown with orange-brown mottling, to brownish yellow (10YR 6/8). A lower B horizon, where preserved in the core, is finer grained (lacking granules and pebbles, but more clay-rich) than the upper B horizon. Therefore, we consider these separate horizons, B1, 7 cm to 12 cm thick, and B2, up to 18 cm thick. Similar
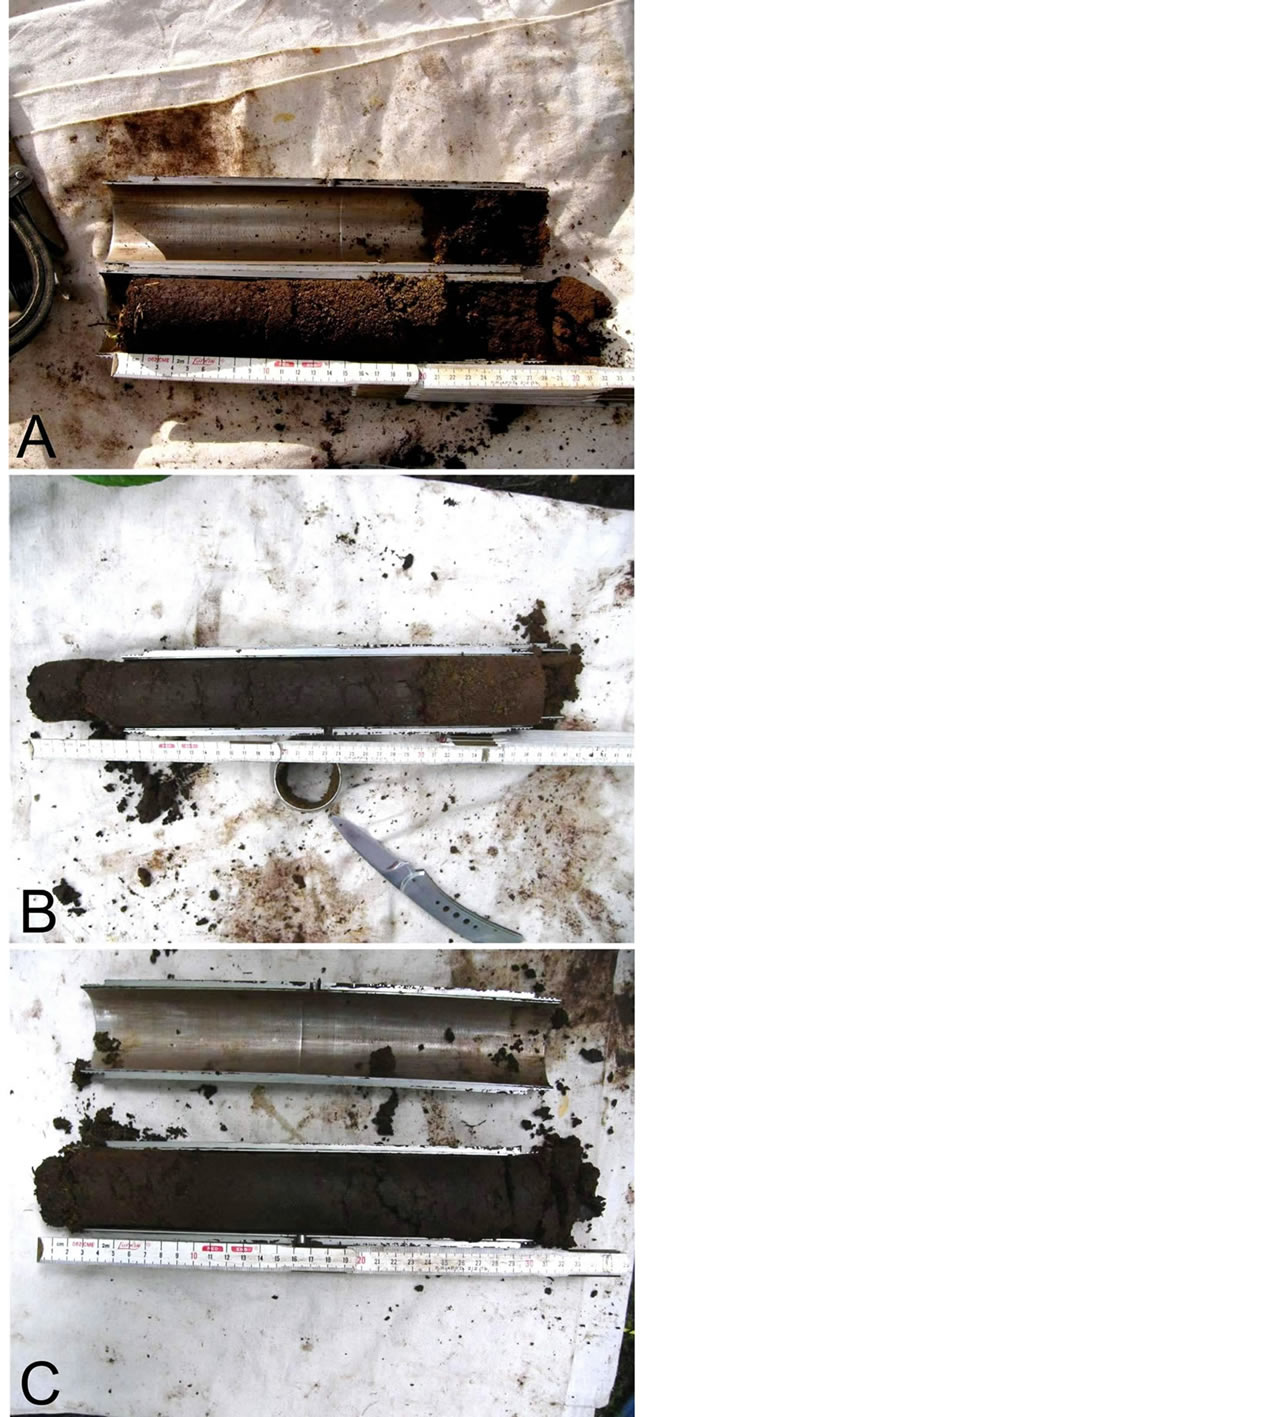
Figure 3. Soil cores representative of the landscapes studied here. (A) Pasture soil is coarse and pebbly from 10 cm to 21 cm, but darker and finer grained below 21 cm. (B) Core from secondary forest site has dark, thick A horizon to 30 cm depth, underlain by lighter-colored pebbly B horizon. A darker, finer (silty-sandy) layer occurs below 38 cm. (C) Mature forest soil displays a thick A horizon varying from heavily rooted and reddish brown (near top) to very dark grayish brown.
to our interpretation of the pasture soils described above, we propose here that the B horizon represents an episode of deposition of coarser sediments that followed clearcutting of the forest, that has since been modified by illuviation of clays and iron oxides elluviated from the A horizon. Below the B horizon in some cores is a very dark brown (10YR 2/2), fine grained layer that may represent a buried A horizon that existed prior to deforestation. Unfortunately, most of our cores were not sufficiently long to confirm this.
4.3. Mature Forest
The inner forest at the Santa Elena Reserve contains a continuous stand of mature forest characterized by a variable-height canopy with substantial gaps, a high basal stand area, abundant lianas and epiphytes and variable understory cover (Figure 2(A)). Soil profiles in cores of these mature forest soils exhibit significant variability, but most show only weak horizonation (Figure 3(C)).
Most of the cores lack a discernible O horizon. The A horizon varies in thickness from 15 cm to 30 cm and is typically extensively rooted to a depth of 10 cm to 15 cm. In some cores, the A horizon is uniformly dark brown (10YR 3/3), but in other cores the upper, rooted portion of the A horizon is dark yellowish-brown (10YR 4/4), and dark brown below. The texture is nearly uniform sandy to pebbly loam. The B horizon, penetrated in several cores at a depth of 30 cm to 35 cm, is pale grayishbrown (10YR 6/2). A few cores penetrated a coarse sandy to pebbly horizon at 25 to 30 cm depth, similar to that seen in most of the cores from the secondary forest, but most did not. These coarse horizons may reflect an older episode of forest soil disturbance.
5. Results
The goal of this project was to characterize the rate at which soils change, if at all, during reforestation of clearcut cloud forests. The results of the soil CO2 flux measurements conducted in the field and the laboratory analysis of the soil samples for carbon and nitrogen content are presented below and in Table 1.
5.1. Carbon and Nitrogen Analyses
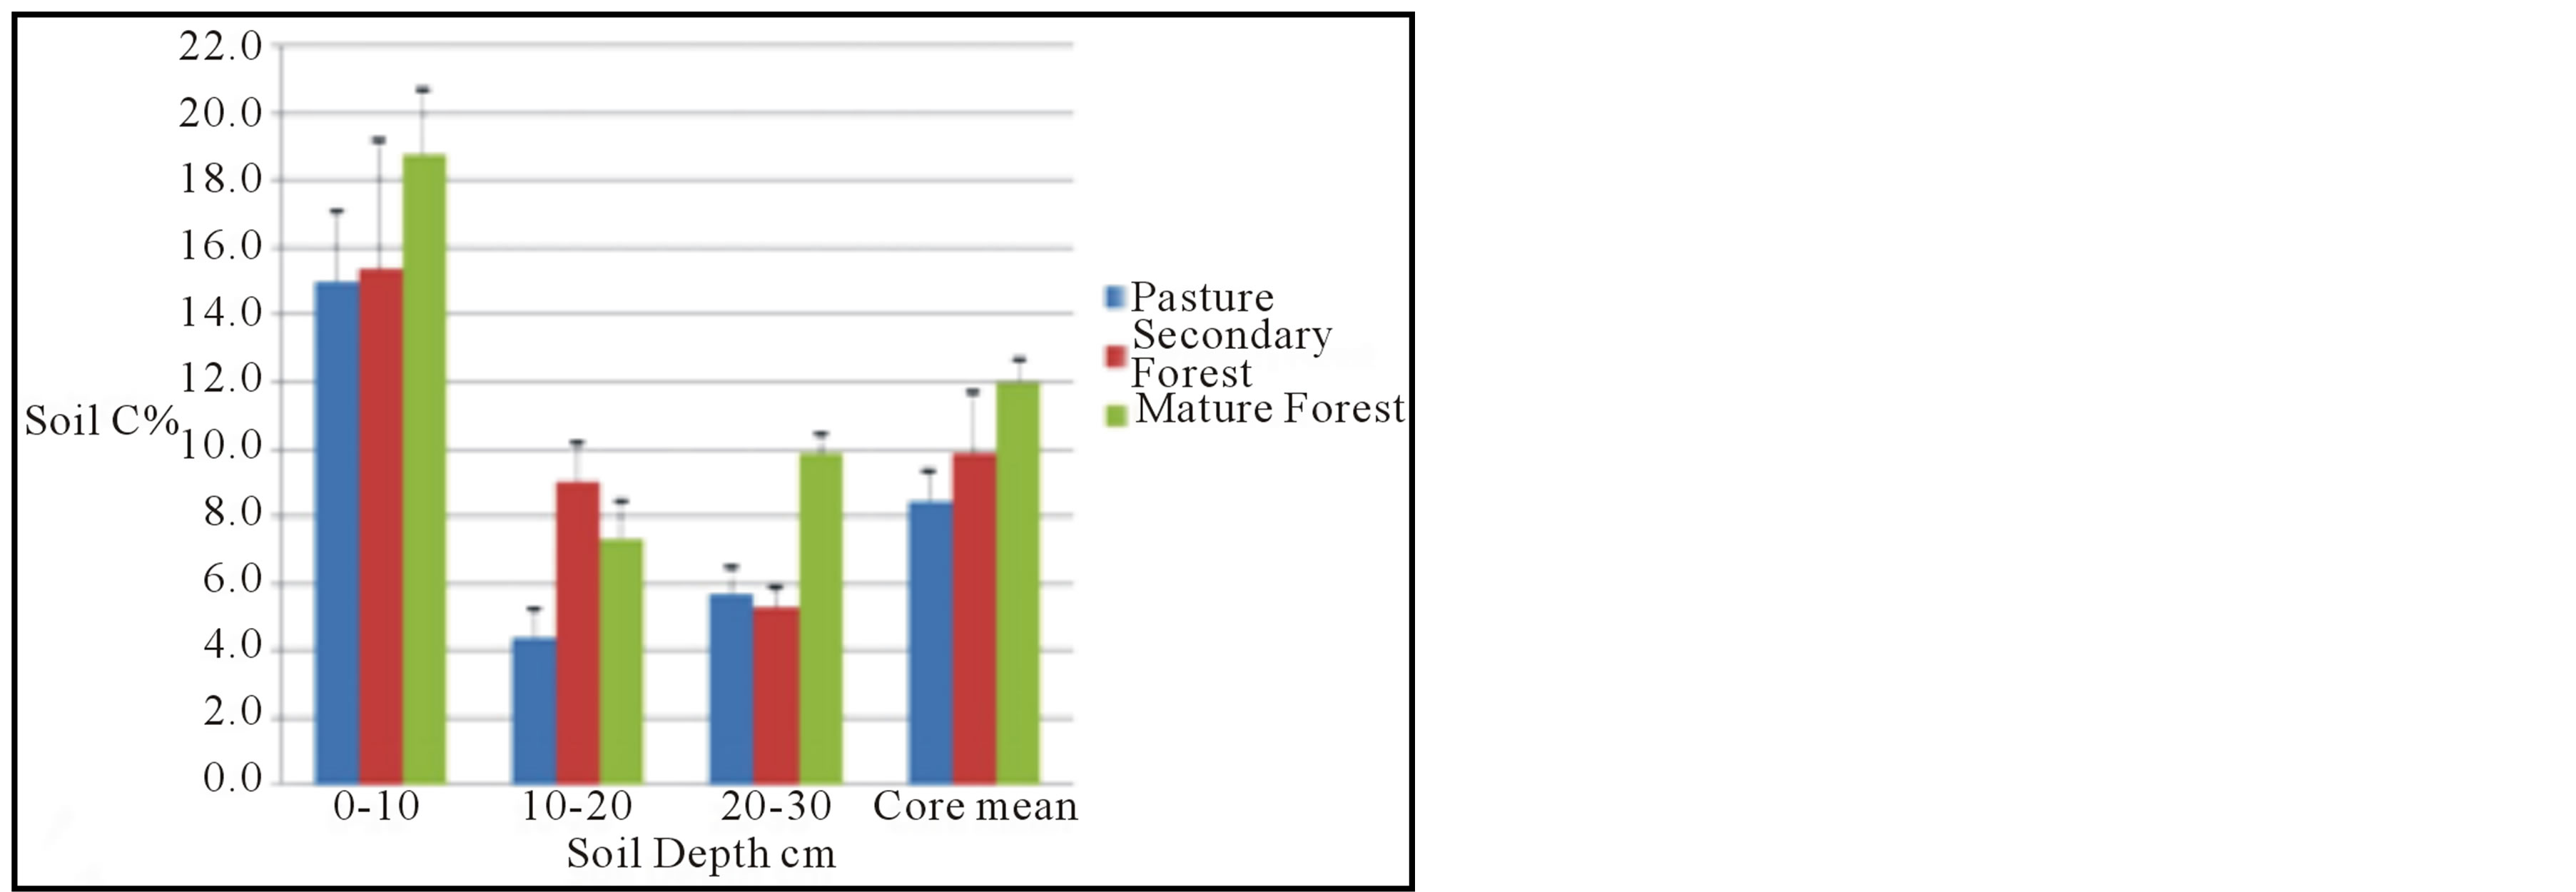
The laboratory analyses of the soil samples from Santa Elena demonstrate that the soil carbon content in all three landscapes has very significant spatial variability, particularly in the upper 10 cm (Table 1, Figure 4(a)). The secondary forest soils exhibit the most extreme variation, with individual samples ranging from 7.5% to 34.9% C. The upper soils of the mature forest and pasture, by contrast, are more consistent with respect to carbon content, although still variable. Csoil in the upper 10 cm of mature forest soils ranges from 7.0% to 30.7%, and in pasture soils from 9.3% to 19.6%. Nevertheless, there is a very clear trend of increasing soil carbon with land surface age in the upper 10 cm of these soils; % Csoil pasture < secondary forest < mature forest. The rate of increase is admittedly modest in the raw data (uncorrected for differences in soil density), amounting to a difference of <3% from pasture to secondary forest, but a more substantial 22% from secondary forest to mature forest, which, due to the great spatial variability, is still well within the standard error for the range of measurements.
The soil samples from 10 to 20 cm in the cores display much less spatial variability than the upper 10 cm. Perhaps counter-intuitively, the secondary forest soils display a 23% higher carbon content than the mature forest soils, but the latter are also more carbon-rich than the pasture soils. The trend in the lowermost sample interval (20 to 30 cm) reflects that of the uppermost interval; the mature forest soils contain almost 70% more carbon, on average, than the secondary forest soils, which are statistically indistinguishable from the pasture soils. The mean carbon for the whole cores mirrors the trend described above for the uppermost soil interval; within the 30 cm interval sampled, % Csoil pasture < secondary forest < mature forest.
Calculation of the spatial distribution of carbon stored in the soil must account for differences in the density of the soils [8]. We estimated the density of the upper 10 cm of the soils to range from 0.9 g∙cm−3 in the pasture soils to 0.7 g∙cm−3 in the forest soils; the greater density of the pasture soils may result from compaction by grazing animals For the entire 30 cm soil intervals studied, we estimated pasture soils to have a mean density of 0.7 g∙cm−3 and the forest soils to have a mean density of 0.5 g∙cm−3. At the landscape level, the pasture soils contain 201.6 Mg C∙ha−1 in the upper 30 cm of the soil (corrected for soil density), of which 135 Mg C occur in the upper 10 cm (Table 2). The secondary forest soils contain 207.9 Mg C∙ha−1 in the upper 30 cm of the soil, of which 92.4 Mg C occur in the upper 10 cm, and the mature forest soils contain 252.8 Mg C∙ha−1 in the upper 30 cm of the soil, of which 112.8 Mg C occur in the upper 10 cm.
The nitrogen content data for the soil samples display substantially less variation among the three landscapes (Table 1, Figure 4(b)); no trends are discernible for individual soil elevations within the soil cores, or for the whole core means. The only trend noted is a consistent downward decrease in the mean % Nsoil in all three settings.
5.2. Soil CO2 Flux
The relationship between soil CO2 flux and landscape is not nearly so clear as the soil carbon content described above. Soil CO2 is generated primarily by root respiration and aerobic decomposition of soil organic matter. Accordingly, the secondary and mature forests should produce higher CO2 fluxes due to the presence of more substantial tree roots in the subsurface. Our observations bear this out; CO2 fluxes from both forests types were measured at approximately 40% greater than in the pasture. This relationship is expressed also by the approximate correlation between % Csoil and soil CO2 flux (Figure 4(c)); the mature forest soils exhibit both the highest values of % Csoil and soil CO2 flux, followed by the secondary forest soils. The CO2 flux means in the secondary and mature forests are nearly indistinguishable; the flux in the mature forest is slightly higher, but the spatial variability of the measurements is much greater in the mature forest than in the secondary forest. This may be a function of the greater consistency of tree distribution and size in the secondary forest than in the mature
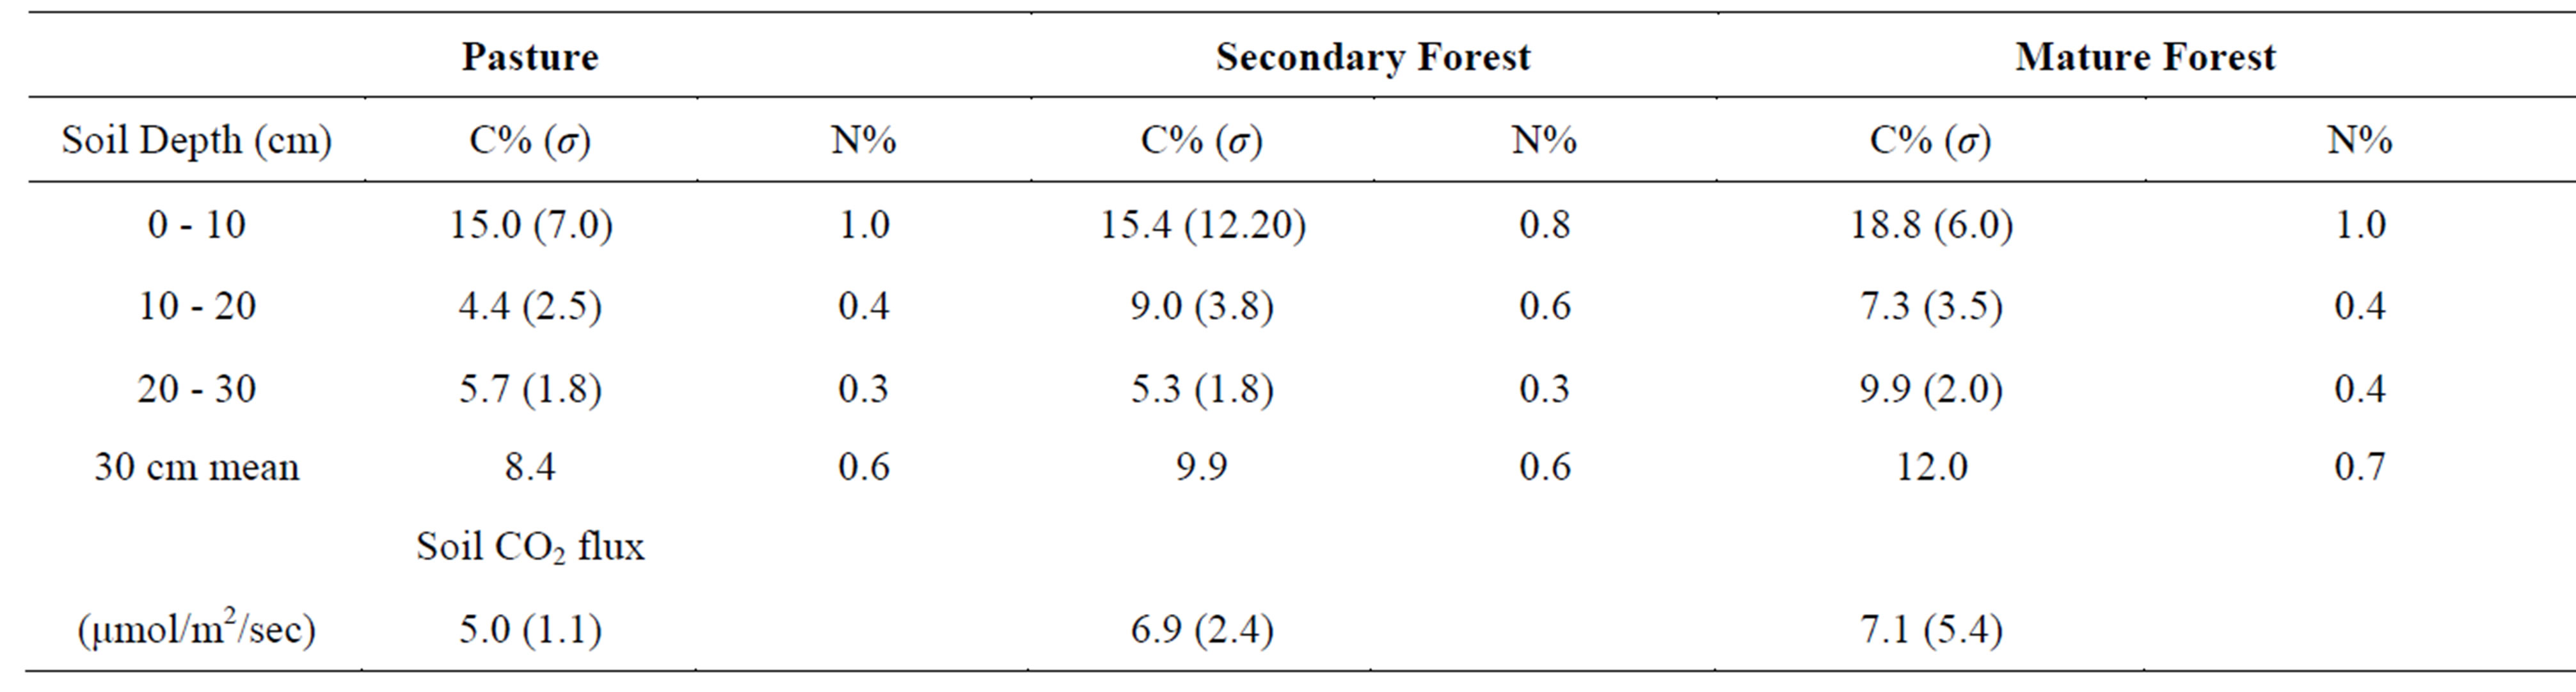
Table 1. Summary results of laboratory analyses and field measurements. Soil carbon and nitrogen analyses are mean of 10 measurements, presented with standard deviation of measurements.
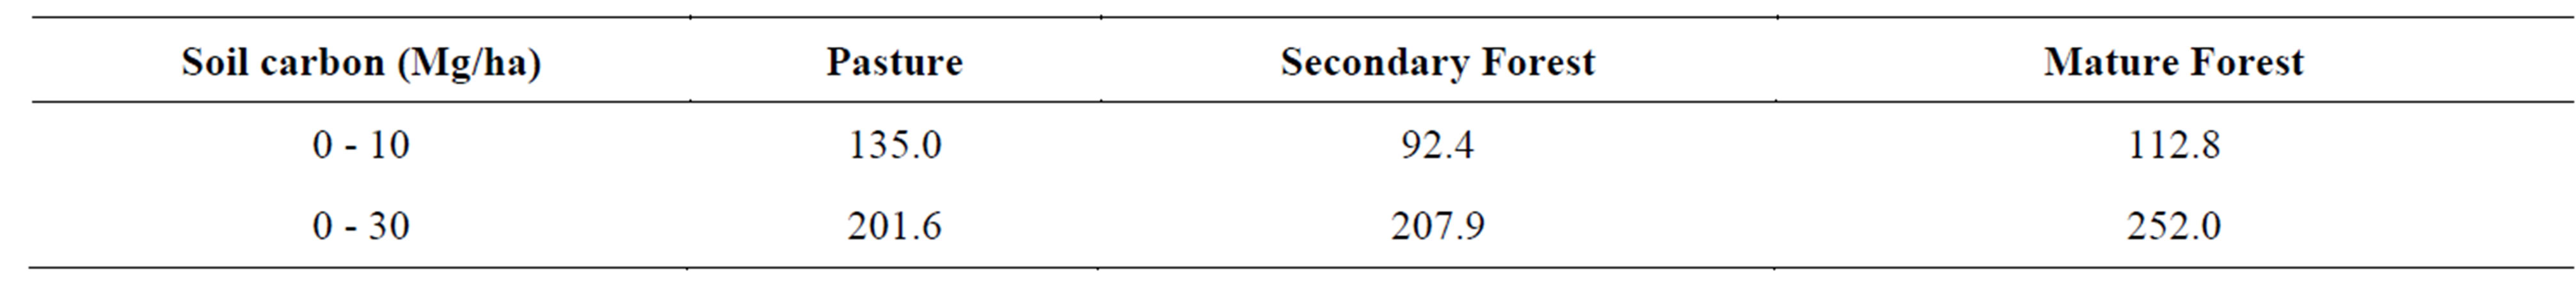
Table 2. Calculation of soil carbon content at landscape scale in top 10 cm of soil, assuming a bulk density of 0.9 g∙cm−3 for pasture soils and 0.6 g∙cm−3 for forest soils. For the 30 cm soil interval, a bulk density of 0.8 g∙cm−3 is assumed for pasture soils and 0.5 g∙cm−3 is assumed for forest soils. Results are presented as 106 g C per hectare.
 (a)
(a)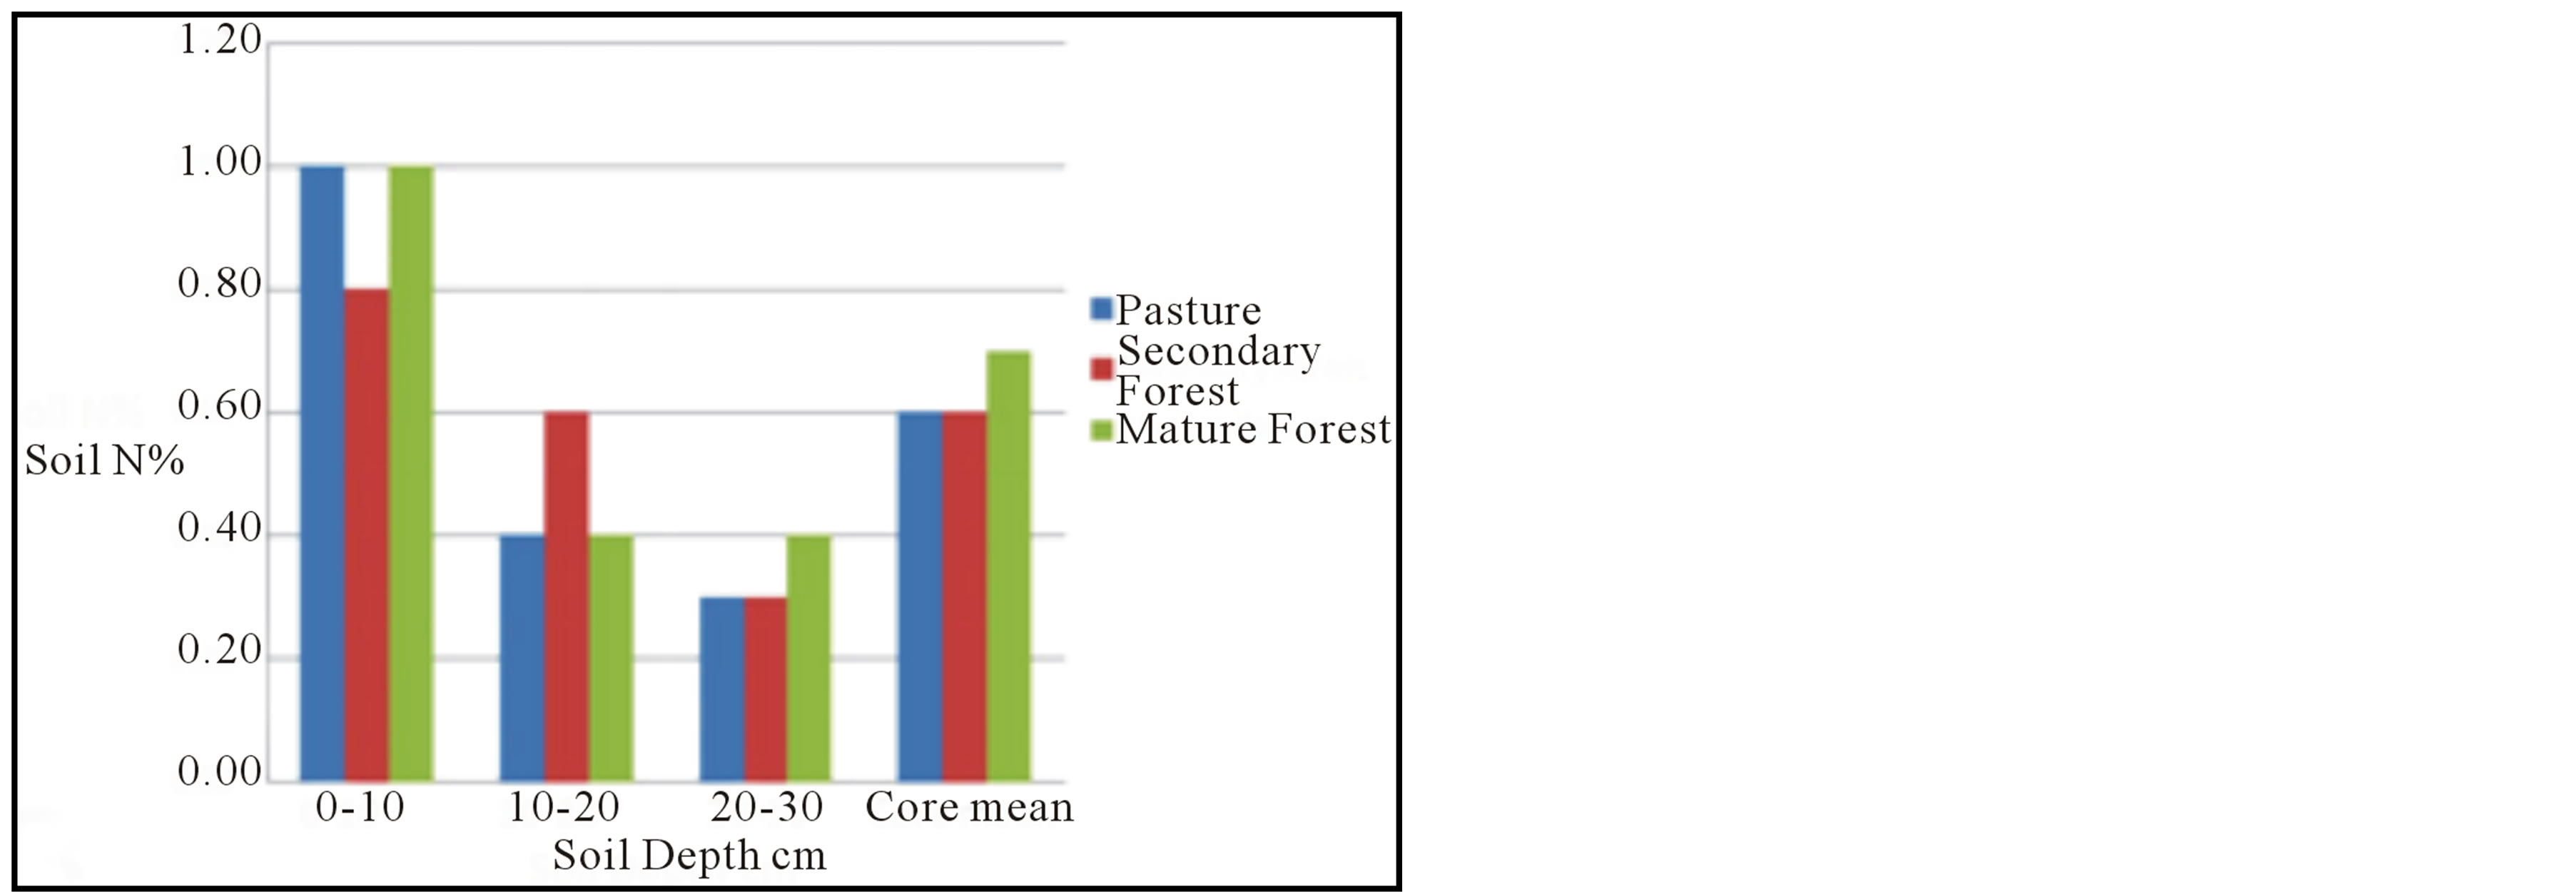 (b)
(b)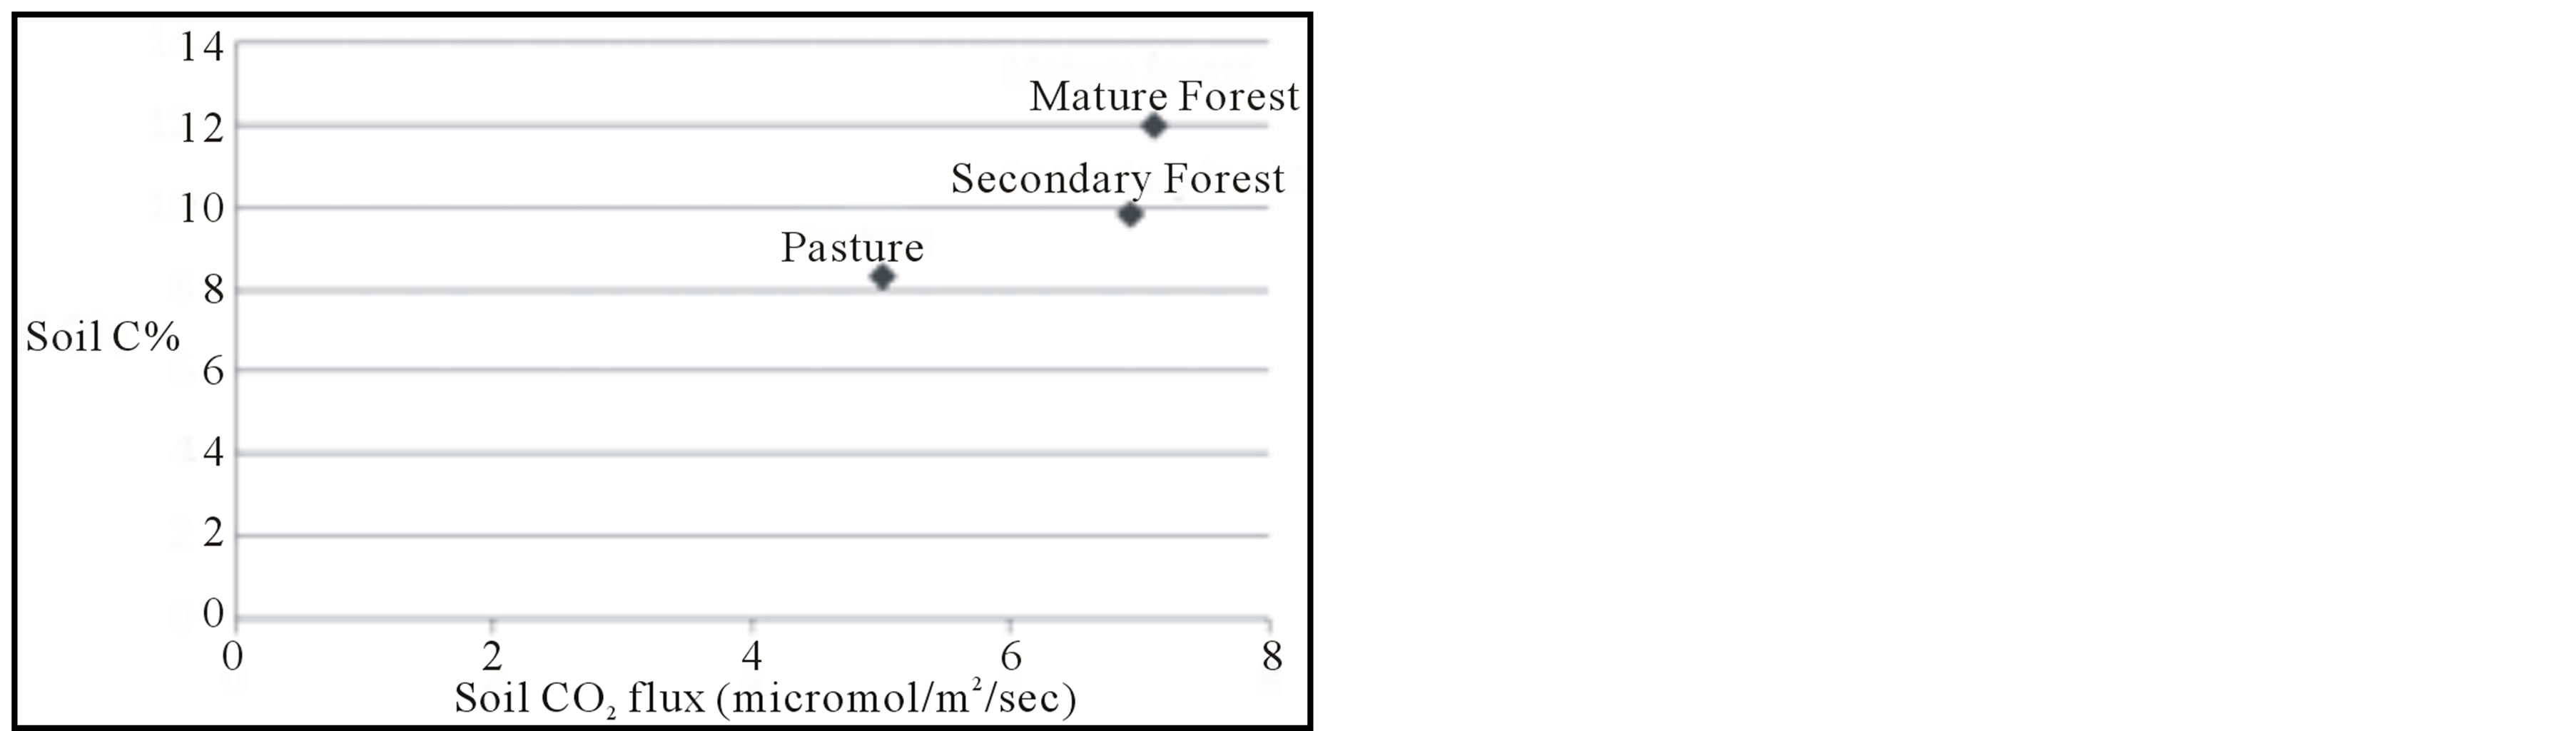 (c)
(c)
Figure 4. Results of analyses. (a) Soil carbon content, as measured by combustion analysis, for each of the 10 cm intervals for each landscape, and averaged over the entire 30 cm core interval. Bars are shown with standard error. (b) Soil nitrogen content for each 10 cm interval and whole core. (c) Mean soil CO2 flux for each landscape plotted against soil carbon content.
forest, which implies a greater consistency of size and distribution of roots in the subsurface. Soil CO2 flux is very consistent in the pasture setting, which undoubtedly reflects the nearly uniform root density in the grass-covered landscape.
6. Discussion
6.1. Soil Carbon Loss and Recovery
The soil carbon data provide substantive evidence that a great amount of soil carbon is lost during deforestation of cloud forests; at the landscape level, we find that the pasture soils contain 20% less carbon (a difference of 50.4 Mg C∙ha−1) than the mature forest soils in the upper 30 cm. Notably, restoration of this carbon proceeds very slowly. The secondary forest soil contains just 6.3 Mg C∙ha−1 in the top 30 cm than the pasture soils, an increase of 3.1%, which corresponds to a mean rate of C accumulation of just 0.2 Mg ha−1∙yr−1, most of which is added below 10 cm soil depth. This increase represents restoration of just 12.5% of the carbon lost to deforestation. Unfortunately, we have no estimate of the age of the mature forest landscape surface, and so we cannot compare the rate of carbon accumulation after 31 years, although we note that a simple linear function would suggest that a time span on the order of two to three centuries would be required for full soil carbon restoration. This interpretation has significant implications in considering fluctuations in the carbon cycle involving changes in forest coverage and loss of forest soils.
Previous studies of carbon sequestration during secondary succession have yielded contrasting results. Schedlbauer and Kavanagh [8], for example, in studying a lowland secondary forest chronosequence in northeastern Costa Rica, found no correlation between soil carbon and forest age; i.e., secondary forest soils did not exhibit increasing carbon accumulation with time compared to grassland pastures, mirroring the results of other earlier studies [4,6]. Bautista-Cruz and Castillo [7], however, studying secondary succession in cloud forests in southern Mexico, documented carbon sequestration accompanied by increasing thickness of the O horizon. This study found in particular that the highest rates of carbon sequestration occurred during the first 15 years, following which the rate of storage decreased significantly. For example, Bautista-Cruz and Castillo calculated an accumulation rate for the first 15 years of succession of 429 g C m−2∙yr−1 in the top 20 cm of soils, and 168 g C m−2∙yr−1 from 20 to 40 cm, compared to our average rate over 30 years of 237 g C m−2∙yr−1 for the top 30 cm.
6.2. Lowland versus Highland Forest Soils
Raich [14] measured substantially smaller carbon concentrations in tropical lowland rainforest Inceptisols in Costa Rica (at the La Selva field station of the Organization for Tropical Studies), with mature forest soil ranging from a high Csoil of 9.6% at the soil top, decreasing to 2.0% at 30 cm, and secondary forest soils similarly decreasing from 8.2% at the soil top to 1.9% at depth. Similarly, Schedlbauer and Kavanagh [8], studying lowland secondary forests in northeastern Costa Rica, found Csoil in pastures had a maximum value of 7.1% in the top 10 cm, decreasing to less than 2% at 20 to 30 cm depth. For the oldest forests studied in the same project, the soil carbon in the top 10 cm was somewhat lower than in pasture soils, but also slightly higher in the interval from 10 to 30 cm.
Notably, several studies have noted the importance of altitude in accumulating soil organic carbon in tropical forests. For example, Dieleman and others [15], measuring soil carbon in altitudinal transects in both forests and grasslands, established a linear correlation that predicts approximately twice the amount of carbon at an elevation of 1500 m compared to 500 m. They attribute this relationship to the effect of climate, in particular the decreased rate of organic decomposition at lower temperatures, as have previous authors [16-18]. Accordingly, we note that the soils studied by Raich [14] formed at an elevation of less than 100 m, compared to the soils examined in this study, which formed between 1600 and 1700 m.
6.3. Soil CO2 Flux
Raich [14], in studying lowland forests, calculated soil carbon flux as soil respired CO2 by the method of measuring the volume of CO2 absorbed by a NaOH solution on exposure in a closed chamber. The flux rates thus calculated are of similar magnitude as those we found, although the study of Raich found consistently higher carbon fluxes from secondary succession sites than in mature forest. Raich noted that some combination of decomposition of soil organic matter and leaf litter and root respiration could account for the trend he observed, but was not specific. As we noted above, however, our measurements exhibited great spatial variability, but in general, we observed higher CO2 fluxes from both secondary and mature forest soils.
7. Conclusions
Investigation of the properties of soils in and near the Santa Elena Forest Reserve indicates that pastures created by clear-cutting of the cloud forest contain less carbon than secondary forest soils, which in turn contain less soil carbon than mature forest soils. Measurements of soil CO2 flux follow the same trend as soil carbon; mature forest soils exhibit slightly higher CO2 flux, but greater spatial variability, and secondary forest soils have a higher flux than pasture soils. We explain the differences in soil CO2 flux between the different landscapes as the result of differences in root respiration, controlled by the size and abundance of plant roots in the subsurface.
Clear-cutting results in the loss of 20% of the soil carbon from the upper 30 cm of the forest soils when the results are corrected for soil density. This carbon is restored during secondary succession, albeit very slowly, with only 12.5% of the lost carbon restored after three decades of secondary forest growth. Thus, we estimate that more than two centuries would be required to restore soil carbon lost during deforestation.
Acknowledgments
We acknowledge the invaluable assistance of Ronald Calvo Aguilar in helping us to obtain permission to conduct research in the Santa Elena Reserve and for logistical assistance during our studies.
REFERENCES
- P. Bousquet, P. Peylin, P. Ciais, C. Le Quere, P. Friedlingstein and P. P. Tansa, “Regional Changes in Carbon Dioxide Fluxes of Land and Oceans Since 1980,” Science, Vol. 290, No. 5495, 2000, pp. 1342-1346. http://dx.doi.org/10.1126/science.290.5495.1342
- J. M. Mellilo, et al., “Tropical Deforestation and the Global Carbon Budget,” Annual Review of Energy and the Environment, Vol. 21, 1996, pp. 293-310. http://dx.doi.org/10.1146/annurev.energy.21.1.293
- E. G. Jobbagy and R. B. Jackson, “The Vertical Distribution of Soil Organic Carbon and Its Relation to Climate and Vegetation,” Ecological Applications, Vol. 10, No. 2, 2000, pp. 423-436. http://dx.doi.org/10.1890/1051-0761(2000)010[0423:TVDOSO]2.0.CO;2
- R. F. Hughes, J. B. Kauffman and V. J. Jaramillo, “Biomass, Carbon, and Nutrient Dynamics of Secondary Forests in a Humid Tropical Region of Mexico,” Ecology, Vol. 80, No. 6, 1999, pp. 1892-1907. http://dx.doi.org/10.2307/176667
- R. F. Hughes, J. B. Kauffman and D. L. Cummings, “Dynamics of Aboveground and Soil Carbon and Nitrogen Stocks and Cycling of Available Nitrogen along a LandUse Gradient in Rondonia, Brazil,” Ecosystems, Vol. 5, No. 3, 2002, pp. 244-259. http://dx.doi.org/10.1007/s10021-001-0069-1
- D. Markewitz, E. Davidson, P. Moutinho and D. Nepstad, “Nutrient Loss and Redistribution after Forest Clearing on a Highly Weathered Soil in Amazonia,” Ecological Applications, Vol. 14, No. 4S, 2004, pp. S177-S199. http://dx.doi.org/10.1890/01-6016
- A. Bautista-Cruz and R. F. del Castillo, “Soil Changes during Secondary Succession in a Tropical Montane Cloud Forest Area,” Soil Science Society of America Journal, Vol. 69, No. 3, 2005, pp. 906-914. http://dx.doi.org/10.2136/sssaj2004.0130
- J. L. Schedlbauer and K. L. Kavanagh, “Soil Carbon Dynamics in a Chronosequence of Secondary Forests in Northeastern Costa Rica,” Forest Ecology and Management, Vol. 255, No. 3-4, 2008, pp. 1326-1335. http://dx.doi.org/10.1016/j.foreco.2007.10.039
- M. E. Fagan, et al., “Land Cover Dynamics Following a Deforestation Ban in Northern Costa Rica,” Environmental Research Letters, Vol. 8, 2013, 9 p. http://dx.doi.org/10.1088/1748-9326/8/3/034017
- R. O. Lawton and V. J. Dryer, “The Vegetation of the Monteverde Cloud Forest Reserve,” Brenesia, Vol. 18, 1980, pp. 101-116.
- E. Vance and N. Nadkarni, “Microbial Biomass and Activity in Canopy Organic Matter and Forest Floor of a Tropical Cloud Forest,” Soil Biology and Biochemistry, Vol. 22, No. 5, 1990, pp. 677-684. http://dx.doi.org/10.1016/0038-0717(90)90015
- N. M. Nadkarni, T. J. Matelson and W. A. Haber, “Structural Characteristics and Floristic Composition of a Neotropical Cloud Forest, Monteverde, Costa Rica,” Journal of Tropical Ecology, Vol. 11, No. 4, 1995, pp. 481-495. http://dx.doi.org/10.1017/S0266467400009020
- N. M. Nadkarni and N. T. Wheelwright, “Monteverde: Ecology and Conservation of a Tropical Cloud Forest,” Oxford University Press, Oxford, 2000, 608 p.
- J. W. Raich, “Effects of Forest Conversion on the Carbon Budget of a Tropical Soil,” Biotropica, Vol. 15, No. 3, 1983, pp. 177-184.
- W. I. J. Dieleman, M. Ventner, A. Ramachandra, A. K. Krockenberger and M. I. Bird, “Soil Carbon Stocks Vary Predictably with Altitude in Tropical Forests: Implications for Soil Carbon Storage,” Geoderma, Vol. 204-205, 2013, pp. 59-67. http://dx.doi.org/10.1016/j.geoderma.2013.04.005
- K. Kitayama and S. I. Aiba, “Ecosystem Structure and Productivity of Tropical Rain Forests along Altitudinal Gradients with Contrasting Soil Phosphorus Pools on Mount Kinabalu, Borneo,” Journal of Ecology, Vol. 90, No. 1, 2002, pp. 37-51. http://dx.doi.org/10.1046/j.0022-0477.2001.00634.x
- E. S. Neto, et al., “Soil-Atmosphere Exchange of Nitrous Oxide, Methane and Carbon Dioxide in a Gradient of Elevation in the Coastal Brazilian Atlantic Forest,” Biogeosciences, Vol. 8, 2011, pp. 733-742. http://dx.doi.org/10.5194/bg-8-733-2011
- N. Salinas, et al., “The Sensitivity of Tropical Leaf Litter Decomposition to Temperature: Results from a LargeScale Leaf Translocation Experiment along an Elevation Gradient in Peruvian Forests,” The New Phytologist, Vol. 189, No. 4, 2011, pp. 967-977. http://dx.doi.org/10.1111/j.1469-8137.2010.03521.x