Open Journal of Soil Science
Vol.3 No.3(2013), Article ID:33490,5 pages DOI:10.4236/ojss.2013.33017
Biological Clogging of Sand Columns
![]()
Faculty of Business Administration, Toyo University, Tokyo, Japan.
Email: seki_k@toyo.jp
Copyright © 2013 Katsutoshi Seki. This is an open access article distributed under the Creative Commons Attribution License, which permits unrestricted use, distribution, and reproduction in any medium, provided the original work is properly cited.
Received April 29th, 2013; revised June 1st, 2013; accepted June 8th, 2013
Keywords: Bioclogging; Bacteria; Hydraulic Conductivity; Microbial Effect
ABSTRACT
Increased microbial activity leads to biological clogging (or bioclogging), i.e., the pore space is clogged by microbes and saturated hydraulic conductivity of porous media decreases. A series of column experiments were carried out to study the bioclogging of sand columns. Hydraulic conductivity remained unchanged when a sterilizing agent was applied; however, it decreased when a glucose solution was applied. In most cases, bioclogging proceeded from the inlet of the solution; but, in some cases, it started from the bottom or outlet of the column. In this experiment, the reduction of hydraulic conductivity was better explained by microcolony models compared to biofilm models.
1. Introduction
Microbial activity can reduce the saturated hydraulic conductivity by clogging soil pores with microbial cells and their synthesized products. This is called biological clogging (or bioclogging) of soil pores and is a major problem in in situ bioremediation practices [1]. Bioclogging also causes problems in the production of drinking water. Most wells in the river regions of the Netherlands are clogged, which has severely reduced the water production [2]. Bioclogging process can occur through many factors, including accumulation of bacterial cells, production of bacterial extracellular polymers, and entrapment of gaseous end products by microorganisms. The difficulty associated with the measurement of saturated hydraulic conductivity (Ks) to understand field clogging for unknown depth of saturation, non-uniform soil properties, and ill-defined flow geometry [3], has led many researchers to conduct controlled flow-cell experiments in the laboratory [4-7]. The researchers attempted to model using the data from controlled laboratory experiments, to estimate the extent of hydraulic conductivity reduction with respect to biomass growth [8-13].
The objective of this study was to observe bioclogging in a laboratory column experiment.
2. Materials and Methods
Flow-cell experiments were conducted under a constant temperature of 20˚C. Toyoura sand of 0.2-mm mean diameter was packed in an acrylic plastic flow system of 5- cm diameter and 10-cm height (Figure 1). The column consisted of five 2-cm rings. The top and bottom ends of the samples were supported by 4-mm-thick glass filters. Three piezometers were inserted equidistantly at different heights of the column, 0, 3, 10, 17, 30, 50, 70, 90, and 100 mm from the surface of the sample. The top and bottom piezometers, i.e., 0 and 100 mm from the surface, were set to contact the glass filters.
Sand was packed uniformly in the column (bulk den-
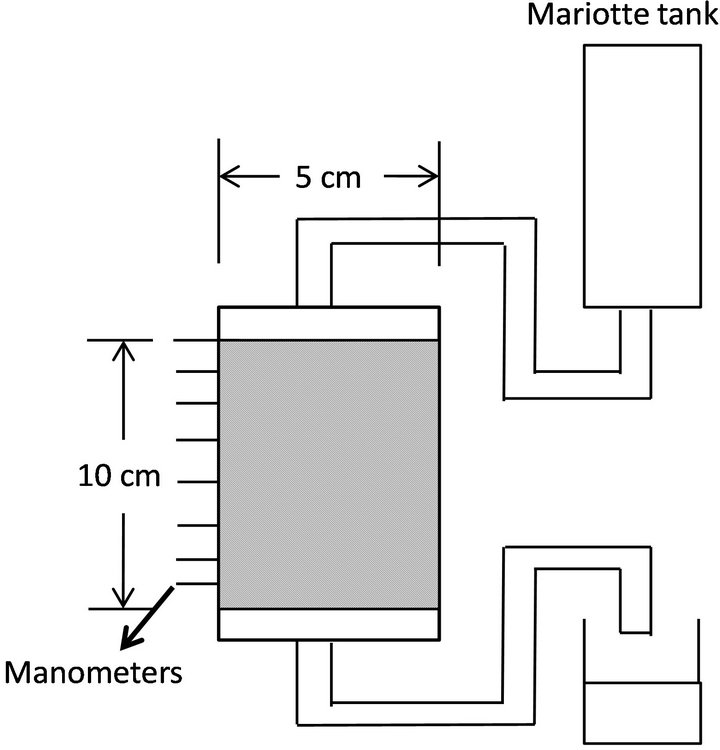
Figure 1. Schematic figure of sand and glass beads column.
sity = 1.64 g/cm3, porosity = 0.376) by hand to allow entry of water to fully saturate the sample. After packing of sand, water was supplied from the top of the column continuously for seven days. Seven runs were conducted. In Runs 1 - 3, sodium azide (NaN3) as germicide was dissolved in water to kill microbes in sand. In Runs 4-7, glucose solution of 50 g/m3 was used as a flow medium to enhance microbial activity in sand.
A Mariotte tank was used to maintain a constant head of water during percolation. The pressure of the piezometers was measured by reading the height of manometers, and the hydraulic head was calculated from the average value of the three manometer readings of each specified height. Saturated hydraulic conductivities, Ks, of each layer were calculated by Darcy’s equation.
After the flow experiment, the column was dismantled and the bulk density was measured by oven-drying the sand sample of 2 cm height to identify the increase of mass resulting from the growth of biomass.
3. Results and Discussion
3.1. Decrease in Saturated Hydraulic Conductivity
The extent of clogging (Ks[final]/Ks[initial]) of the top (0 - 3 cm), middle (3 - 7 cm), and bottom (7 - 10 cm) layers is compared in Table 1. The saturated hydraulic conductivity (Ks) in Runs 1-3, where sodium azide solution was applied, did not decrease remarkably (more than 10% of the initial value) for seven days in any of the sand layers or inside the glass filters. Therefore, the decrease in hydraulic conductivity in Runs 4 to 7 was attributed to the activity of microbes.
Figure 2 shows a typical profile of a hydraulic head at the beginning (0 day) and end (7 days) of the column experiments. After seven days of percolation, the hydraulic head decreased greatly at the top filter (from −0.4
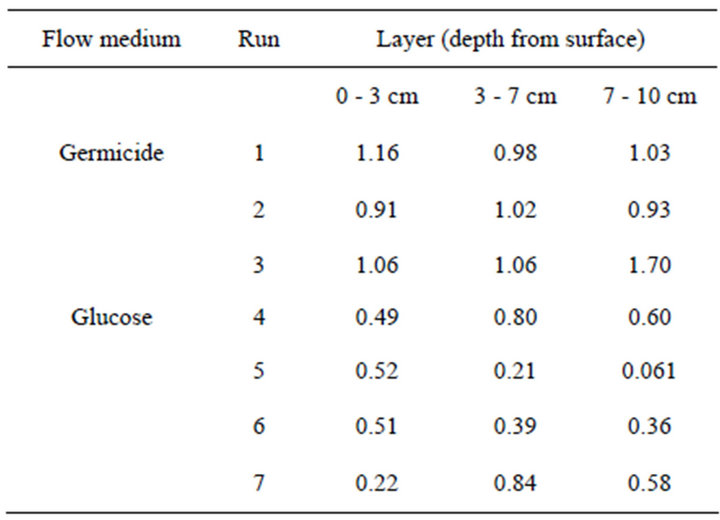
Table 1. Relative hydraulic conductivity at seven days of experiment to the initial value.
to 0 cm depth from the surface). In this column, the Ks of each layer decreased (Figure 3). The decrease in Ks was most severe at the top glass filter and in the 0 - 0.3 cm layer sample, followed by the 0.3 - 1.0 cm layer sample. This result agrees well with previous studies showing that bioclogging is most severe at the inlet of a solution [14]. However, not all of the experiments showed severe clogging at the inlet. In some cases, bioclogging proceeded from the bottom of the column as in Run 5 (Figures 4 and 5).
In Runs 4-7, the site of the clogging layer differed for every column (Table 1). In Runs 4 and 7, the severest clogging was observed at the inlet. In Runs 5 and 6, the clogging was severest at the bottom of the column. Most of the previous work on bioclogging stated that bioclogging proceeded from the inlet of the nutrient solution [4-6,11,13,14], where the concentrations of nutrients and oxygen were the highest.
The extent of bioclogging is determined by the growth of microbes, and the growth of microbes is determined by three factors: 1) glucose concentration, 2) oxygen
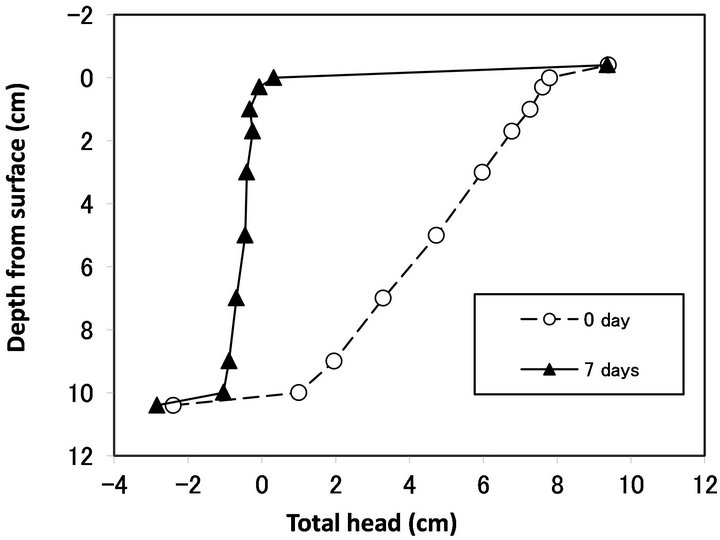
Figure 2. Hydraulic head profile measured by piezometer of Run 7.
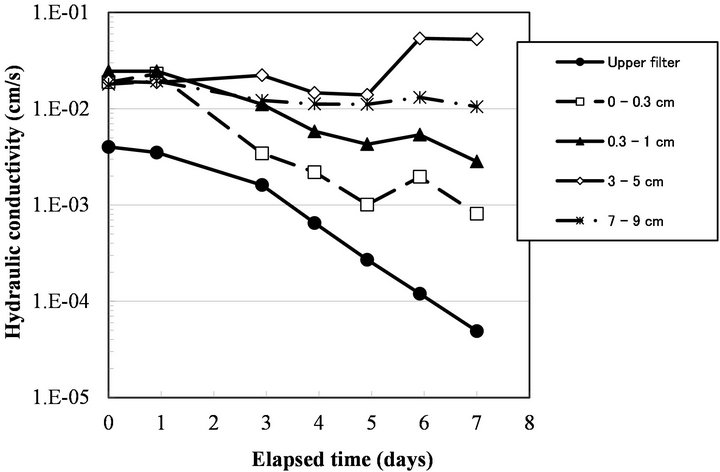
Figure 3. Change in hydraulic conductivity of each layer of sand and glass filters of Run 7.
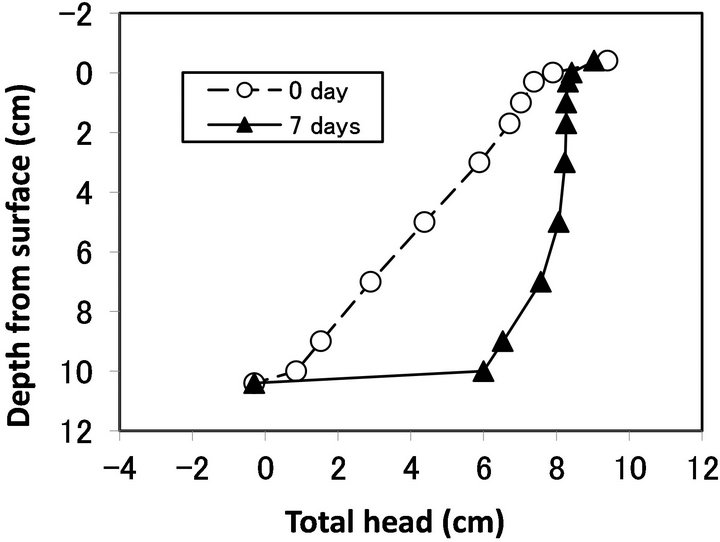
Figure 4. Hydraulic head profile measured by piezometer of Run 5.
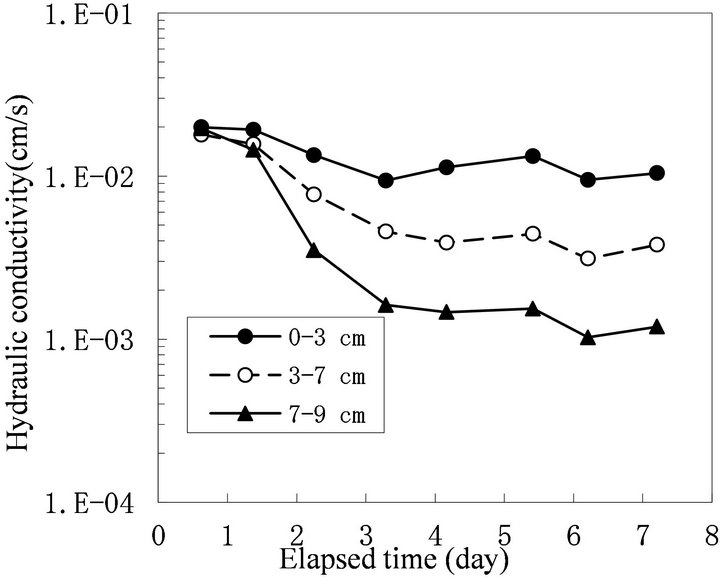
Figure 5. Change in hydraulic conductivity of each layer of sand of Run 5.
concentration, and 3) the initial number of microbes. In Runs 4 and 7, the glucose and oxygen concentration were high enough and Factor (3) mentioned above was dominant in determining the bioclogging rate. In Runs 5 and 6, the initial number of microbes at the bottom of the column was larger than that at the top, and clogging proceeded faster at the bottom of the column. This heterogeneous effect may be observed in other systems when the nutrient concentrations are very high and initial distribution of microbes is not too large.
3.2. Pore Space Reduction
Okubo and Matsumoto [9] calculated the effect of biological clogging to the reduction of hydraulic conductivity, by assuming that pore space is in the bundle of straight pore and uniform biofilm is formed in the pore. Their result can be written as the relationship between porosity reduction and hydraulic conductivity reduction as [8,11]:
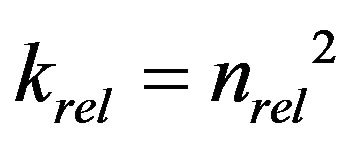 (1)
(1)
where, krel is relative hydraulic conductivity, defined as the saturated hydraulic conductivity of clogged porous medium divided by the saturated hydraulic conductivity of clean (unclogged) porous medium, and nrel is relative porosity, porosity of clogged porous medium divided by porosity of clean porous medium.
Clement et al. [10] also analyzed the reduction of hydraulic conductivity due to biofilm formation. By using the assumption that biofilm preferably clogs large pore and maximum pore radius is reduced, they deduced the following equation:
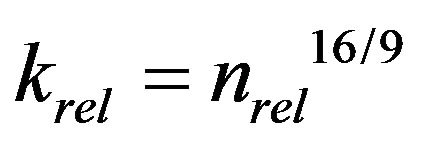 (2)
(2)
Equation (2) is similar to Equation (1) in that krel is expressed as a power function of nrel, but Equation (2) results in more hydraulic conductivity reduction than Equation (1) for the same amount of biomass.
The bulk density of each 2 cm layer measured at the end of the flow experiment did not show measurable increase of mass due to biomass formation. In all of the clogged layers, the largest bulk density observed was 1.67 g/cm3, which was a 1.8% increase from the initial value of 1.64 g/cm3. Therefore, the largest possible estimate of the biomass is 2% of the mass of the soil particle, corresponding to 6% of the volume of soil particle, as the density of soil particle is 3 times larger than that of biomass. The volume of biomass is smaller than 10% of the pore space, and the nrel value is larger than 0.9. Therefore, from Equation (2), krel value is larger than 0.71. However, in Table 1, in all the layer of Runs 4- 7, krel value was smaller than 0.71, except in the 3 - 7 cm layer of Runs 4 and 7. The biofilm model of Clement et al. [10] cannot explain the observed extent of reduction of hydraulic conductivity.
Vandevivere and Baveye [14] showed that biological clogging in fine porous media is more pronounced than that of coarse porous media. Biofilm models, such as Equations (1) and (2), cannot be applied in fine porous media where microcolony is formed rather than uniform biofilm. There have been three model approaches to express biological clogging with microcolony [11-13].
Vandevivere [11] assumed the porous medium to be a bundle of parallel pores, and the microcolony formation corresponds to the biomass forming plugs in the pores, and obtained the following equation.
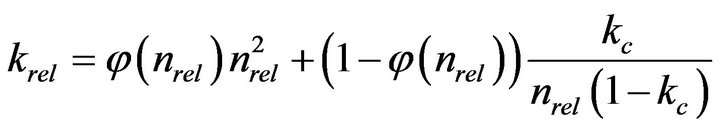 (3)
(3)
where,
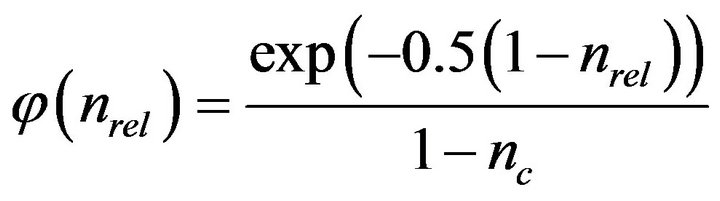 (4)
(4)
and nc, the critical porosity change at which biofilm growth switches into plug growth is suggested to be 0.9, and kc, the relative hydraulic conductivity of the plug, was suggested to be 0.00025.
Seki and Miyazaki [12] introduced a concept of “colonial shape factor”, β, to express the extent of decrease in hydraulic conductivity due to colony formation. Colonial shape factor is defined as the volume ratio of biomass in the conceptual “colony-enveloping space” over which a film of uniform thickness of Lb covers soil particle. If the soil particle is covered with uniform biofilm, β is equal to 1, but when microcolony is formed, β is less than 1. By fitting previous works of pore-space reduction and hydraulic conductivity reduction, relationship between maximum colony thickness and colonial shape factor was obtained. With sand sample of mean diameter of 0.095 mm, the value of β was about 0.2. Relationship between relative porosity and hydraulic conductivity can be obtained as:
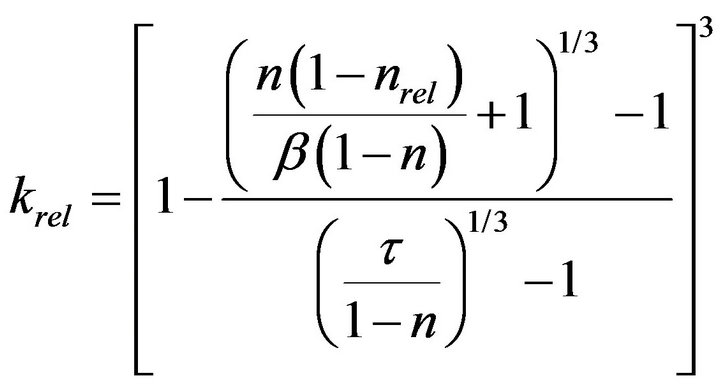 (5)
(5)
where τ is a shape factor of solid phase introduced by Miyazaki [15] and n is porosity of clean porous media.
Thullner et al. [13] simulated the bioclogging with two-dimensional rectangular pore network, and obtained following equation:
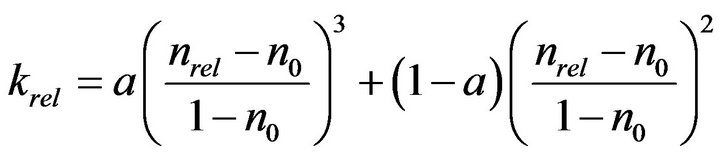 (6)
(6)
where a and n0 are parameters depending on pore structure, and hydraulic conductivity reaches 0 when nrel becomes smaller than n0. By assuming the pore radii of lognormal distribution, they obtained values of −1.7 to −1.9 for a and 0.7 to 0.9 for n0.
Figure 6 shows the relationship between relative porosity and relative hydraulic conductivity, calculated by biofilm models (Clement [10] and β = 1 for Seki [12]), and microcolony models (Vandevivere [11], β < 1 for Seki [12], and Thullner [13]). With Vandevivere model, nc = 0.9 and kc = 0.00025 were used. With Seki model, β = 1 and n = 0.376 were used. With Thullner model, a = −1.8 and n0 = 0.8, 0.9 were used. As discussed above, nrel value is estimated to be larger than 0.9, and biofilm
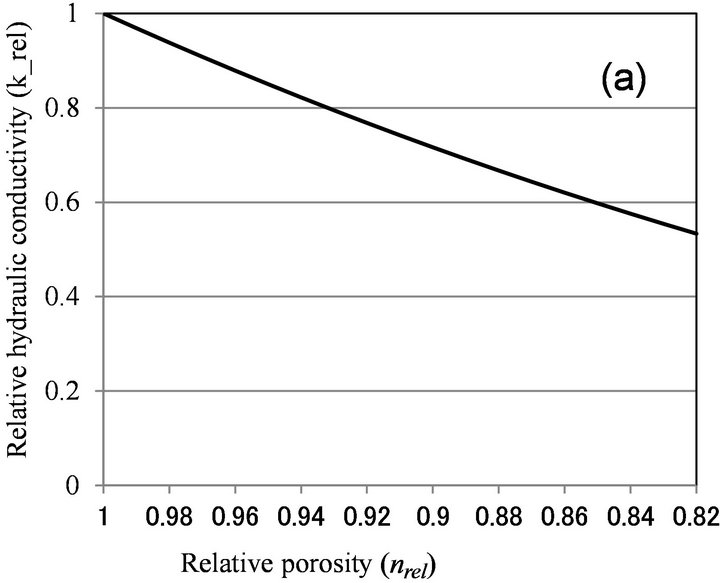
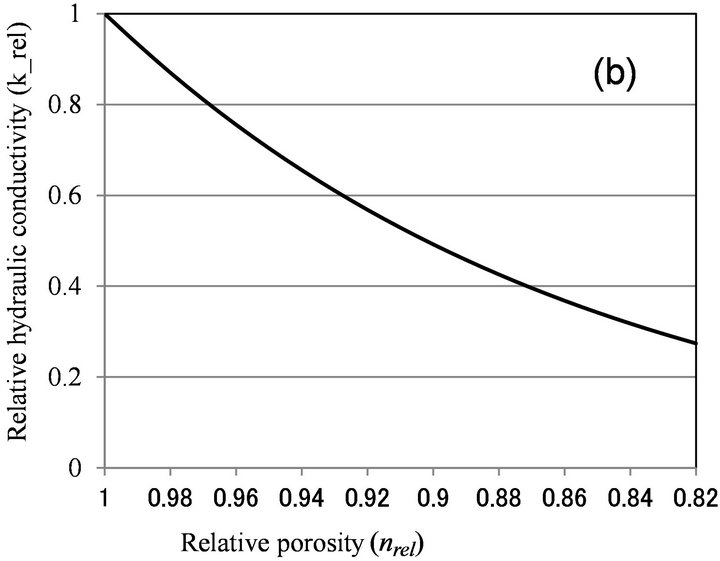
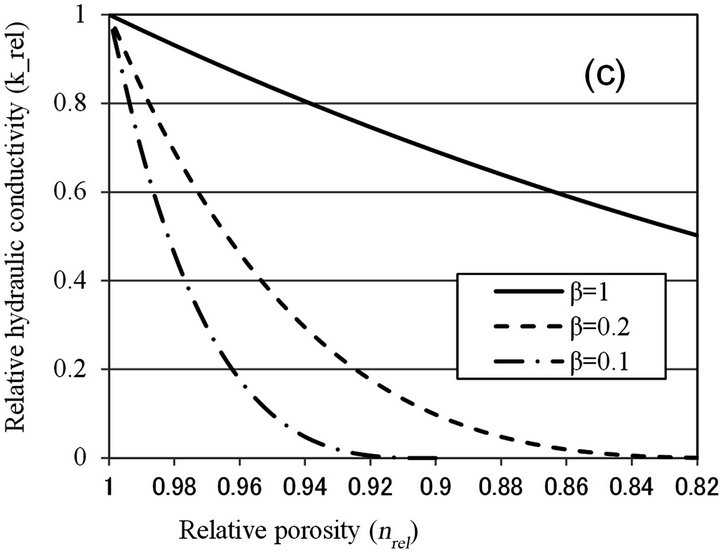
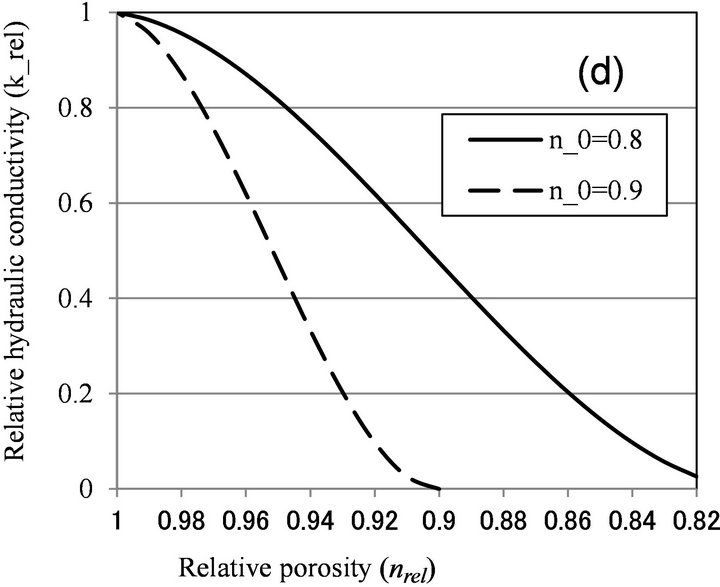
Figure 6. Relationship between relative porosity (nrel) versus relative hydraulic conductivity (krel) calculated by (a) Clement et al. [10]; (b) Vandevivere [11]; (c) Seki and Miyazaki [12]; and (d) Thullner et al. [13].
models can explain moderate clogging of krel > 0.7, while microcolony model can explain severe clogging observed in Table 1. As nrel value was not determined in this study, more detailed examination of the applicability of microcolony model is not possible.
4. Conclusions
Previous laboratory experiments on biological clogging show that generally clogging proceeds from inlet of nutrient solution, because concentration of nutrient solution is the largest at the inlet, and it gradually decreases with flow direction. In this series of laboratory experiment, it was shown that biological clogging may start from middle or bottom of the flow column.
Reduction of hydraulic conductivity due to biological clogging can be better explained by microcolony models compared to biofilm models in the experimental condition of this study.
REFERENCES
- M. D. Lee, J. M. Thomas, R. C. Borden, P. B. Bedient, C. H. Ward and J. T. Wilson, “Biorestoration of Aquifers Contaminated with Organic Compounds,” Critical Review in Environmental Control, Vol. 18, No. 1, 1998, pp. 29-89. doi:10.1080/10643388809388342
- C. G. E. M. van Beek and D. van der Kooij, “Sulfate-Reducing Bacteria in Ground Water from Clogging and Non-Clogging Shallow Wells in the Netherlands River Region,” Ground Water, Vol. 20, No. 3, 1982, pp. 298-302. doi:10.1111/j.1745-6584.1982.tb01350.x
- P. Baveye, P. Vandevivere, B. L. Hoyle, P. C. DeLeo and D. S. de Lozada, “Environmental Impact and Mechanisms of the Biological Clogging of Saturated Soils and Aquifer Materials,” Critical Reviews in Environmental Science and Technology, Vol. 28, No. 2, 1998, pp. 123-191. doi:10.1080/10643389891254197
- R. C. Rice, “Soil Clogging during Infiltration of Secondary Effluent,” Journal of Water Pollution Control Federation, Vol. 46, No. 4, 1974, pp. 708-716.
- R. Kristiansen, “Sand-Filter Trenches for Purification of Septic Tank Effluent: 1. The Clogging Mechanism and Soil Physical Environment,” Journal of Environmental Quality, Vol. 10, No. 3, 1981, pp. 353-357. doi:10.2134/jeq1981.00472425001000030020x
- D. A. Jennings, J. N. Petersen, R. S. Skeen, B. S. Hooker, B. M. Peyton, D. L. Johnstone and D. R. Yonge, “Effects of Slight Variations in Nutrient Loadings on Pore Plugging in Soil Columns,” Applied Biochemistry and Biotechnology, Vol. 51-52, No. 1, 1995, pp. 727-734. doi:10.1007/BF02933473
- K. Seki, M. Thullner, J. Hanada and T. Miyazaki, “Moderate Bioclogging Leading to Preferential Flow Paths in Biobarriers,” Ground Water Monitoring and Remediation, Vol. 26, No. 3, 2006, pp. 68-76. doi:10.1111/j.1745-6592.2006.00086.x
- K. J. Ives and V. Pienvichitr, “Kinetics of Filtration of Dilute Suspensions,” Chemical Engineering Science, Vol. 20, No. 11, 1965, pp. 965-973. doi:10.1016/0009-2509(65)80094-X
- T. Okubo and J. Matsumoto, “Biological Clogging of Sand and Changes of Organic Constituents during Artificial Recharge,” Water Research, Vol. 17, No. 7, 1983, pp. 813-821. doi:10.1016/0043-1354(83)90077-5
- T. P. Clement, B. S. Hooker and R. S. Skeen, “Macroscopic Models for Predicting Changes in Saturated Porous Media Properties Caused by Microbial Growth,” Ground Water, Vol. 34, No. 5, 1996, pp. 934-942. doi:10.1111/j.1745-6584.1996.tb02088.x
- P. Vandevivere, “Bacterial Clogging of Porous-Media: A New Modeling Approach,” Biofouling, Vol. 8, No. 4, 1995, pp. 281-291. doi:10.1080/08927019509378281
- K. Seki and T. Miyazaki, “A Mathematical Model for Biological Clogging of Uniform Porous Media,” Water Resources Research, Vol. 37, No. 12, 2001, pp. 2995- 2999. doi:10.1029/2001WR000395
- M. Thullner, J. Zeyer and W. Kinzelbach, “Influence of Microbial Growth on Hydraulic Properties of Pore Networks,” Transport of Porous Media, Vol. 49, No. 1, 2002, pp. 99-122. doi:10.1023/A:1016030112089
- P. Vandevivere and P. Baveye, “Saturated Hydraulic Conductivity Reduction Caused by Aerobic-Bacteria in Sand Columns,” Soil Science Society of America Journal, Vol. 56, No. 1, 1992, pp. 1-13. doi:10.2136/sssaj1992.03615995005600010001x
- T. Miyazaki, “Bulk Density Dependence of Air Entry Suctions and Saturated Hydraulic Conductivities of Soils,” Soil Science, Vol. 161, No. 8, 1996, pp. 484-490. doi:10.1097/00010694-199608000-00003
NOTES
*Temporarily at Laboratory of Hydrology and Geochemistry of Strasbourg, University of Strasbourg, Strasbourg, France.