Open Journal of Soil Science
Vol.1 No.3(2011), Article ID:16493,11 pages DOI:10.4236/ojss.2011.13012
Litter Decomposition and Soluble Carbon, Nitrogen, and Phosphorus Release in a Forest Ecosystem
![]()
1Range Cattle Research and Education Center, University of Florida, Ona, USA; 2Soil and Water Science Department, University of Florida, Gainesville, USA; 3North Florida Research and Education Center, Quincy, USA.
Email: mlas@ufl.edu
Received November 2nd, 2011; revised November 30th, 2011; accepted December 11th, 2011.
Keywords: Decomposition, Dissolved Organic Carbon, Forest Soil, Litter Quality
ABSTRACT
Litter is an important source of easily mineralizable C, N, and P for microbial metabolism in forest ecosystems; however, its decomposition is dependent upon a variety of biotic and abiotic factors, including litter chemical composition and plant specie, soil properties, and climate. We investigated C, N, and P mineralization patterns of pine litter, oak and a mixture of various species commonly found in wetland landscape position. Litter species were incubated (alone and with soils) under laboratory conditions in the dark for 120 days. Samples were leached weekly and the leachates were analyzed for pH, E4:E6 ratio, dissolved organic carbon (DOC), total N, NO3, NH4, soluble reactive P, and total P. CO2 effluxes during the 120-d incubation period were measure using NaOH traps. Carbon loss was calculated as the sum of DOC and CO2 effluxes. Results indicated that patterns of C and N release varied with litter species and soil type. Mix species treatment resulted in larger DOC and N pulses compared to pine and oak treatments. The majority of the DOC, N, and P leached was retained by the soils. When litters were added to the soils, a greater proportion of the C was lost as CO2, while litter incubated alone lost more C as DOC. This result demonstrated the importance of the soil microbial community affecting the patterns of litter mineralization. Total N concentration and C:N ratio of the litter species were significantly correlated to C loss.
1. Introduction
Net primary production is the basic C and energy source for heterotrophic production [1] and is the major source of humus in the mineral soils. Litter decomposition leads to the conversion of C into CO2 by microorganisms, with a portion of the C incorporated into microbial biomass, leached from the profile or stabilized into humus substances.
Litter is an important source of easily mineralizable C for microbial metabolism [2]. However, decomposition of litter in soils is dependent upon a variety of factors, including both the quality of carbon input and soil characteristics. Plant species composition is considered one of the most important factors affecting litter degradation, and, therefore, C balances in soils. [3] showed that different litter species exhibited contrasting patterns of dissolved organic carbon (DOC) release, possibly related to differences in the initial C chemistry of these materials. [4] showed that eucalyptus litter produced acidic leachates, which may negatively affect microbial activity. [5] reported that legume litters account for greater nutrient release than grasses over similar time periods. In recent years, researchers have studied the interaction of different litter species during the decomposition process [6,7]. Mixing litters from different species can increase microbial activity and/or abundance and, consequently, increase litter decomposition [8].
Some chemical characteristics of the litter material, such as lignin, polyphenol, cellulose and hemicellulose and C:N ratio affect decomposition. [5] reported that liginin-to-N ratio was the best indicator of organic matter decomposition and N release. Litter with higher initial N concentrations usually shows higher mass loss and respiration rates than those with lower N concentration, but the importance of initial N concentration decreased with time [9,10] concluded that the relationships between litter decomposition and their C:N ratios appear to be complex and species dependent and might not be an appropriate general indicator for changes in decomposition rates. These inconsistent results and the lack of a single a parameter that explains the mineralization process indicate the complexity of litter decomposition in soils and suggest that a combination of environmental and biological factors are involved in the C mineralization.
Microbes are primary agents responsible for litter degradation, and consequently, abiotic factors that affect microbial activity, such as temperature, soil type, bulk density and moisture content also influence carbon decomposition. [11] observed that organic soils exhibited greater C loss than mineral soils. This is consistent with the assumption that rates of litter decomposition are signifycantly affected by biotic environment in which decomposition takes place [12]. For instance, soil pH has been suggested to determine the specific C source that will be used by microbial community. In addition, soil pH may also affect the nitrification of mineralized N [13,14] observed that soil texture had no effect on litter decomposition, however when soil texture and water pressure were combined into one variable (percentage water-filled pore space), they explained satisfactorily the variability of litter degradation and soil C mineralization.
Despite the fact that labile C accounts for a small portion of the total organic matter in the soils, it can greatly influence soil biological activity. Dissolved organic C is considered the most mobile and important C-source for microorganisms in soils. Labile constituents generally decompose faster and in a greater degree than more recalcitrant molecules. However, DOC decomposition is variable and depends on the C source quality and structure (sugars, proteins, phenols, tannins contents). It has been suggested that DOC concentrations decrease gradually with time due to the decrease decomposition and depolymerisation rates [9-15] reported that about 10 to 40% of DOC could be easily decomposable by microbes within a period of days to a few months. [2], studying the bioavailability of DOC in forest soils, found that the degradation of leaf leachate and throughfall ranged from 40% to 70%.
Despite the vast literature on this topic, it is still unclear how N and P will affect the decomposition of litter material, and, consequently C dynamics in forest soils. It has been suggested that N inputs can affected litter decomposition by increasing respiration [3,9]. However, other reports indicated no relationship between nutrient addition and/or internal initial N concentration in the litter and CO2 released [9,16,17] reported that the addition of triple super phosphate suppressed microbial activity in soils with higher P concentration, however no effects on litter decomposition were found. These authors concluded that N fertilizers could temporarily increase microbial metabolic quotient; however, significant suppression was detected with time. The inconsistencies found in different studies may be attributed to the differences in the time scale and the rate and the type of fertilized used in the study, as well as the productivity of the forest involved [17].
Our experiment was designed to investigate the decomposition of different litter species from upland and wetland landscape positions incubated alone and with soils and to examine C, N, and P release during the mineralization process. The following hypothesis were assumed: 1) litter species exhibit different chemical quality parameters, such as labile C, total N and P contents, and consequently, will show distinguished mineralization rates; 2) soil types respond differently to litter addition in terms of CO2 production and C, N, and P release; 3) both soil type and litter specie will affect microbial activity and mineralization rates.
2. Materials and Methods
2.1. Site Description
Soil and litter samples were colleted from Fort Benning military reservation in west-central Georgia, south of the city of Columbus, Georgia and east of Phoenix City, Alabama. This site lies on the border between the lower Coastal Plains and Flatwoods in the Sand Hills ecological unit and the Coastal Plains, Middle, Upper Loam Hills ecological unit. The climate is characterized by hot summers and mild winters, and has an average annual rainfall of about 1321 mm. The topography of Fort Benning is nearly level to gently sloping ridgetops, moderately steep and steep hillsides, and nearly level valleys along stream channels and other tributaries. Upland soils in the area are primarily well to excessively drained Ultisols and Entisols, supporting forests of slash (Pinus elliottii), longleaf (Pinus palustris), and loblolly pine (Pinus taeda). Sandhill communities associated with excessively-drained Lakeland soils (Entisol) and featuring longleaf pine, turkey oak (Quercus laevis), blackjack oak (Quercus marilandica), and post oak (Quercus stellata) are commonly associated with ridgetops in the central and northern portion of Ft. Benning. Soils of relatively high clay content occur in a band across the southern portion of the installation. Wetlands and hydric soils are generally restricted to bottomlands along streams and creeks.
2.2. Soil and Litter Samples
Soil and litter samples were collected at the same site from both upland and wetland landscape position. Soil samples were collected at 0 - 15 cm depth. Moist soil samples were sieved (<2 mm) to remove visible roots, debris and stones. Freshly fallen leaf litters of 1) a mixed stand of loblolly pine (Pinus taeda) and longleaf pine (Pinus palustris); 2) Oak (Quercus spp.); and 3) a mixture of sweetgum (Liquidambar styraciflua), red maple (Acer rubrum), and blackgum (Nyssa sylvatica) were collected in late November 2002 after the main period of litterfall. Litter species were chosen to represent natural vegetation composition in upland and wetland landscape positions. After collection, litter was placed in paper bags, air dried at room temperature and cut into pieces of 1- to 2-cm square.
Initial soil (Table 1) and litter materials (Table 2) were analyzed for total C and total N by dry combustion using a Carlo-Erba NA-1500 C.N.S analyzer (Haak-Buchler Instruments, Saddlebrook, NJ). Prior to analysis, subsamples of oven-dried soil and litter were finely ground to a powder, and approximately 20 to 40 mg (soil) and 2 to 4 mg (litter) were used for total C and N analyses. Microbial biomass C and N were measured in fresh samples by chloroform fumigation-extraction procedure adapted by [18] as described in [19]. Fiber analysis of the litters was performed on an Ankom A200 fiber analyzer (Ankom Technology, Macedon, NY) using oven-dried grounded samples.
At the end of the experiment, remaining soil and litter were recovered separately and fresh weights measured. Subsamples were oven-dried at 70˚C for 24 h and rerun for the same parameters as the initial samples described above. The remaining fresh sample was used for microbial analyses as described above.
2.3. Experiment Design
Approximately 100 g of field-moisture soil was placed in a funnel vacuum filter system (Figure 1) then 3 g of litter were added to the soil surface. The quantity of litter was calculated based on the average annual litterfall for the study site (about 4.45 t/ha/year), scaled to the area of the soil in the filtration system. Surface application was chosen to avoid high initial immobilization of N as observed by [20] and to better mimic the natural occurrence of litter on the surface of forest soils. The treatments consisted of: 1) upland soil + pine litter; 2) upland soil + oak litter; 3) upland soil + mixture litter; 4) wetland soil + pine litter;
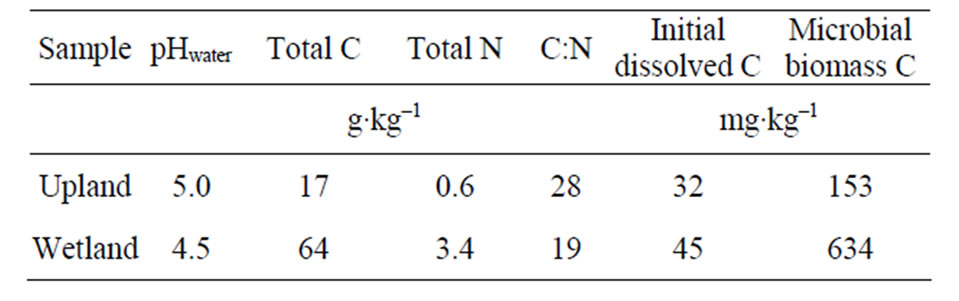
Table 1. Soil chemical characteristics.
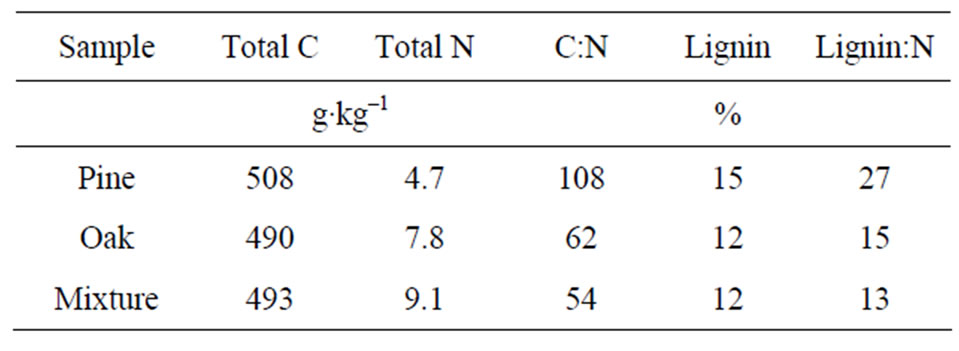
Table 2. Litter chemical characteristics.
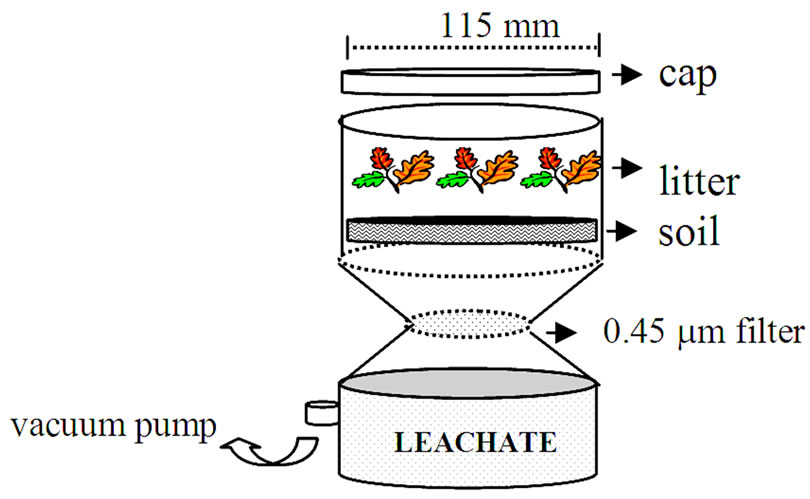
Figure 1. Schematic representation of the filtration apparatus.
5) wetland soil + oak litter; 6) wetland soil + mixture litter; 7) control 1 (pine litter); 8) control 2 (oak litter); 9) control 3 (mixture litter); 10) control 4 (upland soil); 11) control 5 (wetland soil). A chamber with no residue (soil or litter) was used as a blank.
The apparatus was tightly closed and rubber gaskets were used to seal connections and avoid gas exchange. The chambers were incubated in the dark at 25˚C (±2˚C). The experiment was run for 16 weeks.
2.4. Leaching and Solution Analysis
Samples were leached with 100 mL of DDI water once a week. The combined volume of leaching water was equivalent to the expected volume of rainfall in the region, relative to the area of the cup. Preliminary data showed that the annual precipitation in 2002 was ~1100 mm. The water was added slowly using a syringe to avoid physical disturbance of the samples. A vacuum pump was used to filter the solution through a 0.45 mm-size membrane. Due to the constant clogging of the filter membrane during the first 4 weeks, subsequent samples were first filtered through a glass microfiber filter, and then refiltered through a 0.45 mm membrane. The solution pH was measured immediately after each leaching event. Leachates were then acidified with concentrated sulfuric acid and stored at 4˚C until analysis. All solutions were analyzed within 14 days of collection.
Solutions were analyzed for  with a Technicon continuous flow autoanalyzer using the semi-automated colorimetry method (EPA 350.1), in which the sample was buffered at pH 9.5 and distilled into a solution of boric acid. Alkaline phenol and hypochloride react with ammonia to form indophenol blue that is proportional to the ammonia concentration. The blue is intensified with nitroprusside and measured colorimetrically. NO3-N was analyzed using the automated cadmium reduction method (EPA 353.2). Total Kjeldahl N was determined after the digestion of 10 mL of leachate with 0.5 mL of concentrate H2SO4 and subsequently quantified in a Technicon autoanalyzer (EPA 351.2). Total dissolved organic N was calculated by the difference between total N and the sum of total inorganic N.
Dissolved organic carbon concentrations were measured using a Shimadzu TOC-5050. The composition of DOC was characterized by the UV absorbance ratio measured at 465 and 665 nm wavelength (E4/E6 ratio) using a spectrophotometer Shimadzu UV 160. The E4/E6 ratio was determined in non-acidified leachates to avoid the precipitation of humic acids [21].
2.5. CO2 Evolution
CO2 effluxes were calculated based on the amount of CO2 that was trapped in 3 mL of 2 M NaOH. Vials containing NaOH solution were placed inside the chamber and, replaced every day. After 2 weeks, this interval was increased periodically up to one week. Intervals longer than 1 week were avoided to prevent build up of CO2 and to avoid O2 depletion. Vials containing NaOH traps were immediately sealed with caps fitted with rubber septa. Excess of HCl was added through septa to neutralize NaOH solution and give a pH below 2.0 [22]. A sample of CO2 produced in the headspace was collected and analyzed by gas chromatography using a Shimadzu GC 8A gas-chromatograph fitted with thermal conductivity detector (120˚C) and a 0.3 cm × 2 m Poropak N column (Supelco Inc., Bellefonte, PA) at 40˚C. Gas pressure in the vials was measured using a digital pressure meter (KaneMay, UK). The calculation of CO2 trapped in the NaOH solution was based on a modification of the method described by [23].
2.6. Statistics Analysis
A completely randomized experimental design was used with three replicates of each treatment and with factors being soil type and litter material. Significant differences between the treatments were determined using one-way ANOVA (P £ 0.05) [24]. Repeated measures analysis was performed, where main effect was litter type. All chemical analyses and cumulative concentrations in the leachates (sum of concentrations from each leaching event) were reported based on the initial dry weights.
The SAS nonlinear (NLIN SAS Institute, Release 8.01) program was used to fit the loss of organic C over time in a double-exponential decay model [25,26]:
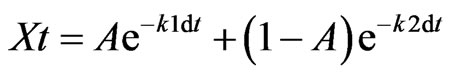 (1)
(1)
where, k1 and k2 are decomposition rate constants, A is the initial proportion of labile material, and (1 – A) is the initial proportion of resistant material.
3. Results and Discussion
3.1. Leachate DOC
All treatments showed larger DOC pulses in the initial weeks, and then decreased gradually over time (Figure 2). This pattern suggests that more labile compounds were preferentially released in the first leaching events. Subsequently, less assimilated forms of C were mineralized and released as DOC. Pine control treatment (no soil) exhibited the largest DOC pulse in the first week (~3 mg DOC-C g–1 litter), and then decreased considerably (~0.8 mg DOC-C g–1 litter) by the second leaching event (Figure 2(a)). On the other hand, oak and mixture control treatments showed the largest DOC pulse in the third week of incubation (3.4 and 4.0 mg DOC-C g–1 litter, for the oak and mixture treatments, respectively) (Figure 2(b) and 2(c)). Litter amended soils were followed similar patter to control samples (litter alone).
The concentrations of DOC leached varied by litter specie and soil type. Although the majority of the C released as DOC was due to litter decomposition and the relatively minor contribution of the soils to the DOC pulses, upland treated soils released greater DOC concentrations than wetland treated soils regardless of the litter specie (Figure 2). Possibly differences in soil texture and the ability to sorb C between both soils resulted in larger DOC pulses in the upland soil. Differences in microbial biomass and/or activity may also contribute to the differences in the amount of DOC released by both soils. Despite some fluctuations in DOC concentrations, after 8 weeks of incubation soils treated with pine and oak litter released similar amounts of DOC, while for the mixture treatment, differences in DOC pulses between both soils were observed until the end of the experiment. These differences can be explained in part by the greater DOC concentration in the leachates from mixture treatments compared to the others, suggesting that maybe in the wetland soil DOC is being more efficiently accumulated and/or consumed by the microbial community, while in the upland soil, because its smaller affinity to retain DOC, larger concentrations were leached.
Cumulative DOC release followed the order: Mixture (33 mg DOC-C g–1 litter) > Oak (27 mg DOC-C g–1 litter) > Pine (19 mg DOC-C g–1 litter) (Figure 2). Lower cumulative DOC in leachates was related to the chemical characteristics of the litter. For instance, pine litter showed higher C:N and lignin:N ratios compared to the other treatments (Table 2), which may indicate poor litter quality. Consequently, with less easily assimilated C compounds in the pine litter, less C was released to the solution.
The amount of leached DOC was relatively small compared to the total C in the treated soils and/or litter alone (Figure 2). Pine alone released ~3.8% of the total C, while oak and mixture litter released 5.6% and 6.7% of the total C, respectively. The percentage of total C leached when litter was incubated with soils was significantly less than

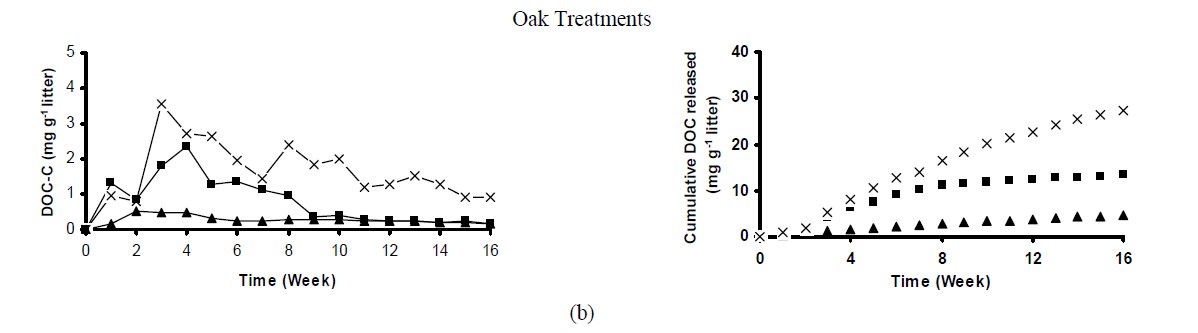
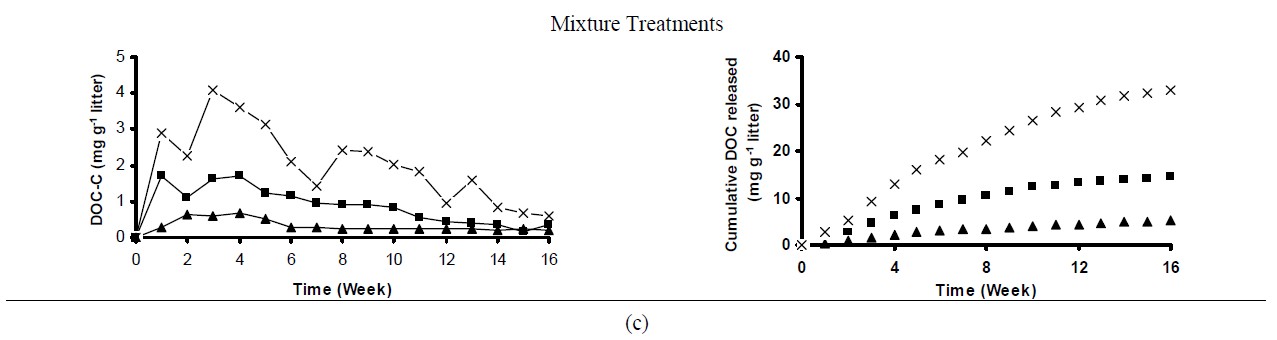
Figure 2. Weekly DOC concentration and cumulative DOC released during the 16-week incubation experiment. Each point represents the mean of three replicates.
that for the litter alone. Despite the relatively small percentage of total C released as DOC, this component consists primarily of humic substances and hydrophilic acids and is a major route responsible for transformation of humus in the mineral soils [27]. [3] studying litter decomposition found much greater DOC concentration in leachates, accounting for 10 to 30% of the total C. Probably the differences between our data and those reported by [3] were due to the soil’s affinity to retain DOC and the chemical characteristics of litter studied.
Leachate pH was relatively constant throughout the 16- week experiment and was similar among the litter species. However, leachate pH was slightly greater for the upland treated soils (5 to 6.1) as compared to the wetland treated soils (4.7 to 5.2), which reflects the differences in the initial soil pH. At the end of experiment, control pine litter (no soil) leachates exhibited more acidic leachates (pH of 4.5) compared to oak (pH 5.2) and mixture (pH 5.5) treatments. [4] also observed that leachates from pine exhibited lower pH values compared to other forest species. This pattern may have important implications on the microbial community composition responsible for litter decomposition [13].
Leachate E4:E6 ratio varied considerably when litter species were incubated. The E4/E6 ratio varied from 3.8 to 25 for pine, 4.5 to 15 for oak, and 3.6 to 13 for mixture leachates. When litter species were incubated with soils, leachate E4:E6 ratio was, on average, around 5. Data indicated that because of the high variability associated with E4/E6 ratio measurements, this procedure showed not to be suitable for characterizing soluble C compounds.
3.2. Leachate Dissolved Organic/Inorganic Nitrogen
Cumulative dissolved N in leachates varied depending upon the litter specie (Figure 3). In general, pine alone resulted in significant less total dissolved N in leachates (Figure 3(a)), followed by oak and mixture treatments
(Figures 3(b) and 3(c), respectively). When litter species were incubated with soils, the majority of the N released by the litter species was retained by both soils (data not presented). In litter treated soils, pine treatments release significantly less N, while oak and mixture treatments leached similar N concentrations. The results demonstrated that although the amount of N released was directly related to the litter specie, soils also played an important role controlling N leaching.
Cumulative N leached after 16 weeks of incubation represented between 1% - 2% and 0.3% - 0.4% of initial nitrogen concentration for uplands and wetland treated samples, respectively. Litter samples alone released about 6% of the initial N content. Nitrogen release from the control litters (no soils) was less than that found by [28] who found that 4% to 20% of the total initial N present in fens was potentially released. Pine release approximately 37% and 52% less N than oak and mixture treatments, respect-
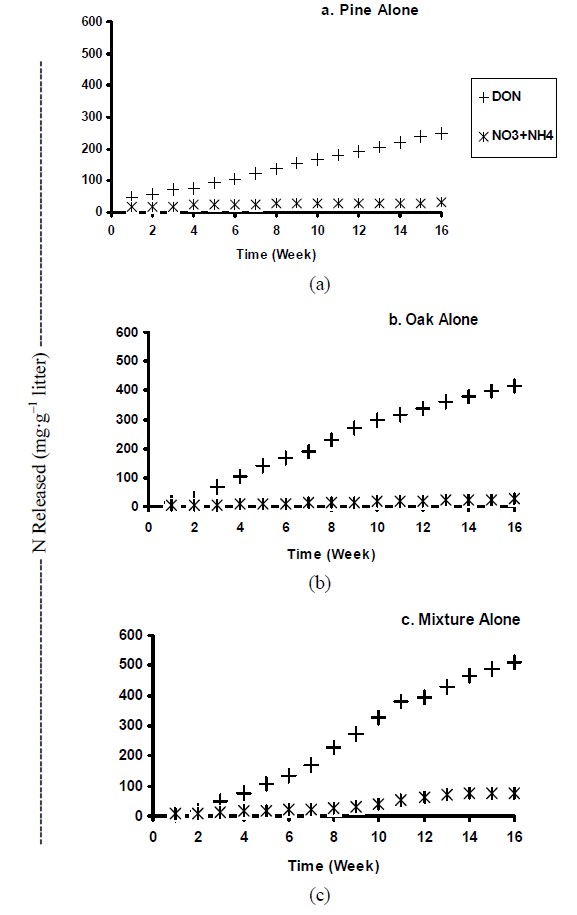
Figure 3. Cumulative dissolved organic-(DON) and inorganic-N (NH4 + NO3) released from litter species incubated alone.
tively, possibly due to the considerable lower initial N concentrations exhibited by pine litter. Similar trend was observed by [4], who suggested that highly leachable species (such as the mixture treatment used in our study) have the potential to release more N compared to less decomposable species. Our data demonstrated the potential of litter to provide considerable amounts of N into solution, and also emphasized the differences in the potential N leachable pools exhibited by contrasting litter species.
Dissolved organic nitrogen (DON) was the major N form released from control litter samples (Figure 4) and accounted for ~83%, 93% and 82% of total N dissolved from pine, oak and mixture treatments, correspondingly. Similar pattern was observed for the upland treated soil, in which 84% to 99% of total N released was organic-N over the 16 week incubation (Figure 4). These results were similar to that found by [27], who examining soil solution from Oi and Oa horizons in forest ecosystems observed that 94% of the dissolved N was organic. [9] also reported that DON was the major source of N transport from pine needles. In contrast, in the wetland treated soils organic N ranged from 17% to 54% of total N (Figure 6). Concentration of dissolved inorganic N (especially NO3) was significantly higher in wetland treated samples than that in uplands, accounting for up to 83% of total N in leachates. This suggested that the majority of nitrogen added in wetland soils was rapidly mineralized to inorganic N forms. Possibly in wetland soils, the  supply and availability was higher than that for uplands, resulting in higher NO3-N production [29]. Conversely, in uplands due to differences in microbial community and soil properties that govern N mineralization, such as C:N ratio (Table 1), the majority of N was immobilized by the microbial community. The importance of C:N ratio on N dynamics in soils has been widely reported by various studies [13].
3.3. DOC:DON Ratios of the Leachates
Leachates DOC to DON ratios varied considerable with time and litter species (Figure 5). Mixture litter treatment showed significantly greater DOC:DON ratio (~549) in the first week of incubation, and decreased substantially after 16 weeks of incubation (DOC:DON ratio = 75). Possibly this pattern was due to the lower DON concentrations released by the mixture treatments during the first weeks of incubation. For oak and pine treatments there were no significant changes in DOC:DON rations over time. Average DOC:DON ratio for pine litter was 78, while for oak litter was 69. At the end of the 16-week incubation, there were no significant differences in DOC:DON ratios among litter species. Litter treated soils showed considerably lower DOC:DON ratios compared to litter incubated alone (data not presented). Although C:N ratios of
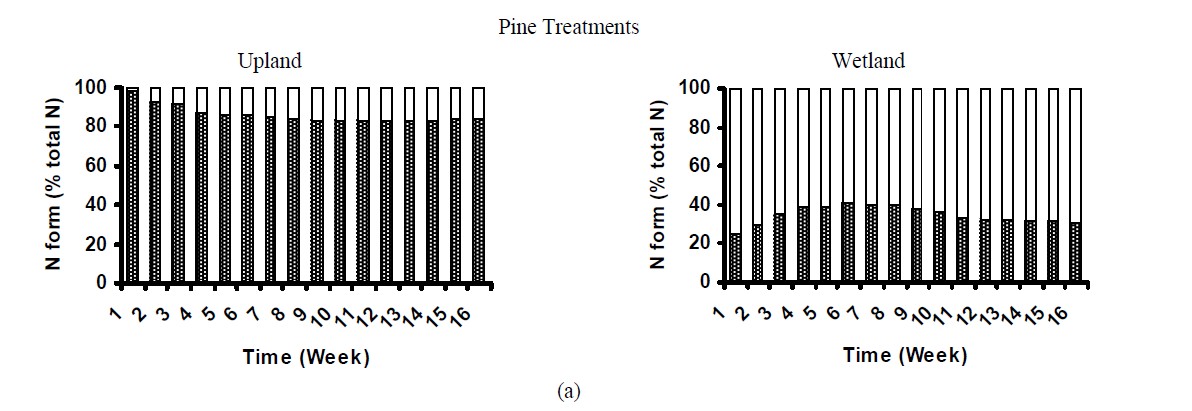
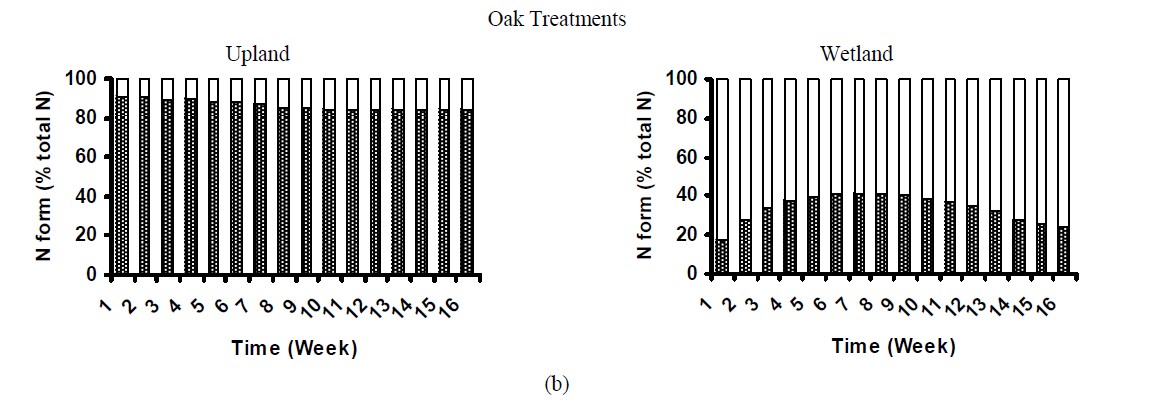
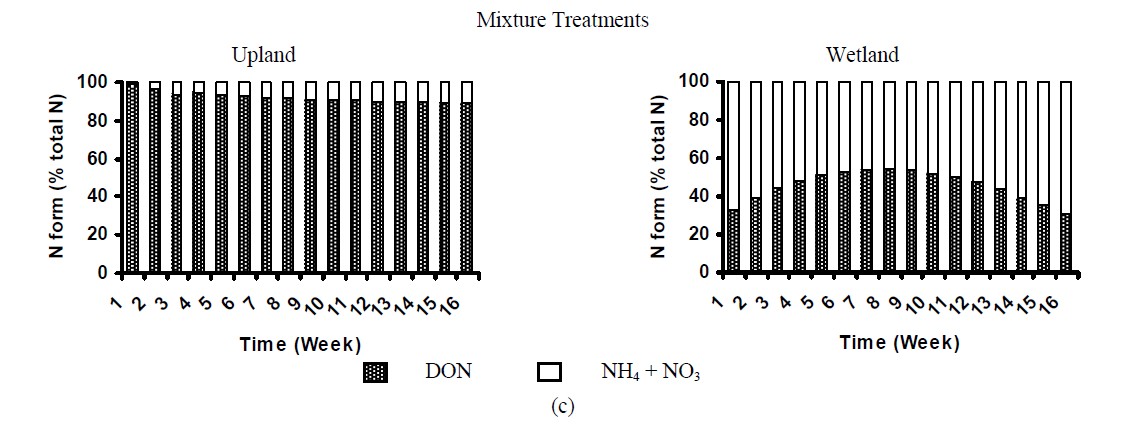
Figure 4. Nitrogen distribution in the leachates of treated soils.
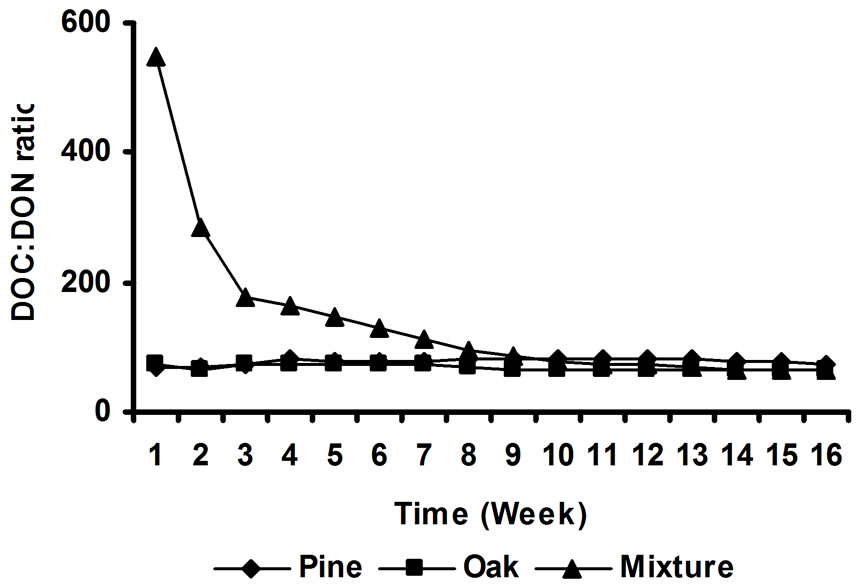
Figure 5. Changes in DOC:DON ratios over time.
litter leachates were much lower than those found by [27], who found values ranging from 290 to 820, our results confirmed that C:N ratio of litter leachates were much higher than that found for forest floor, probably because when litters where incubated with soils N mineralization was increased. In N-deficient soils, such as those used in this study, DON released by the litters was rapidly converted into inorganic forms.
3.4. Leachate P
Cumulative P leached varied depending upon the litter specie. Mixture litter treatment released more P (26 μg∙P∙g–1 litter) than oak (11 μg∙P∙g–1 litter) and pine (4.8 μg∙P∙g–1 litter) treatments. There was a significant interaction (P < 0.001) between N and P leaching. This result support those found by [28] who also observed correlation between P and N leaching. Cumulative P leached observed in our study was considerably lower than those reported by [28] for four Carex species. Phosphorus leached of the soils incubated with litter was below the detection limit of our instrument (<0.01 µg∙g–1), thus it could not be measured accurately. This suggests that both soils retained the majority of the P released by the litters. It is also possible that the P mineralized was immediately fixed by the soil microbial community, and, thus, low P concentrations were leached.
3.5. Carbon Dioxide Efflux
Litter samples incubated alone (no soil) showed markedly lower cumulative CO2 production compared to the samples that were incubated with both upland and wetland soils (Figure 6). Greater CO2 production rates were observed during the first 11-d incubation, and then declined progressively. This result demonstrated differences in availability of C compounds. The change in CO2 evolution rates after the early stages of incubation is often related to mineralization of active and slow pools of SOC [30]. Possibly, the more labile C compounds were degraded initially, and subsequently, the more complex/recalcitrant
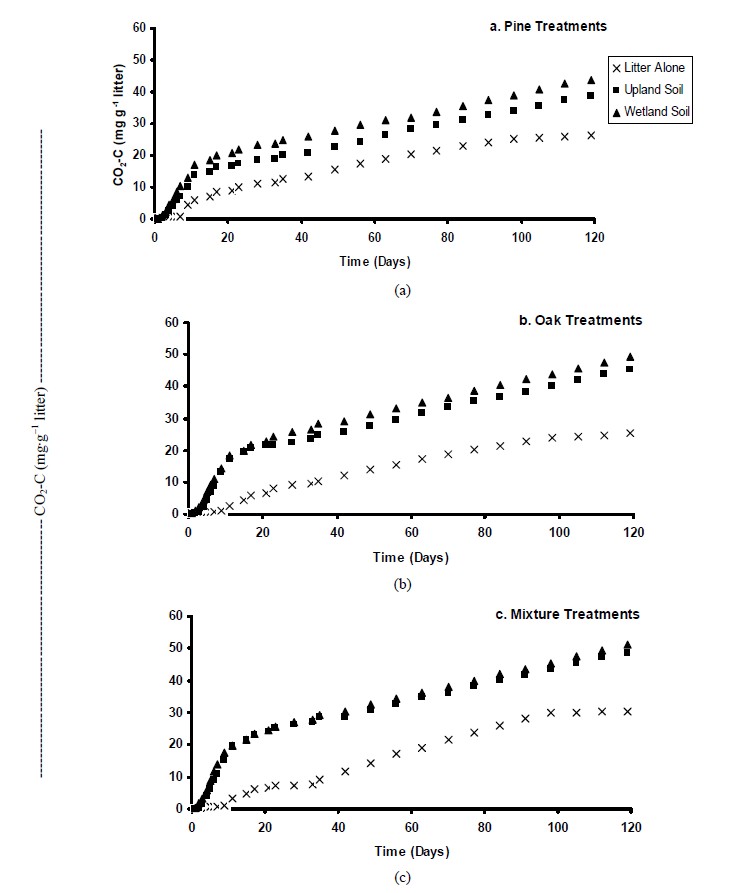
Figure 6. Cumulative total CO2 produced by litter species incubated for 120 days.
molecules were gradually decomposed. Since the majority of CO2 loss is dominated by microbial respiration [31], it is most likely that the microbial community was forced to change their activity in order to mineralize the more resistant compounds. [9] also observed that CO2 emissions of pine litter reached maximal values after 1 to 2 weeks of incubation.
For all treatments, wetlands exhibited significantly higher cumulative respiration rates than uplands, possibly due the higher amount of C and microbial biomass showed by wetland soils. [30] also observed that CO2 evolution was greater in residues that exhibited higher total C. There were no significant differences (P ≤ 0.05) in the cumulative CO2 efflux among the pine and oak litter treatments. However, in both soils mixture treatment produced greater CO2 efflux compared to pine and oak litter. This result suggested that mixture treatment had a greater proportion of available C for biological mineralization compared to the other species. The interaction between different litter species present in the mixture treatment may have promoted a greater respiration rates compared to pure litter species [4]. At the end of the experiment, microbial biomass C was significantly higher in the mixture treatment than that for the pine and oak treatments (data not presented). Although we have no data on the microbial community diversity, the greater microbial biomass is an indicative that mixing different litter species may have affected decomposer community as suggested by other studies [4]. It is also possible that differences in litter quality (i.e., N and P concentrations) affected microbial composition and/or efficiency to decompose the litter materials.
Cumulative mineralization rates (C-CO2) ranged from 7.6% to 8.6%, 9.2% to 10.1% and 9.9% to 10.4% of initial total C for pine, oak, and mixture treated soils, respecttively. For the litter species incubated in the absence of soil, there were no significant differences in the cumulative C released by pine and oak (~5.2% of total C), while mixture treatments exhibited the greatest CO2 evolution (6.2% of total C).
3.6. C Loss and Its Relationship with Soil and Litter Quality Variables
Carbon loss was calculated as a sum of the total amount of CO2-C and the C dissolved as DOC. Percentage of C loss varied noticeably among the treatments (Table 3). After 119-d of incubation, from 87% to 91% of the initial total C was remained in litter incubated alone. Similar mineralization rates were observed when litters were incubated with soils, however, it was observed that litters responded differently when incubated with soils.
Carbon losses via microbial respiration were signifycantly higher when litters were incubated with soils (Figure 7), probably due to differences in biotic and abiotic factors. The majority (~77% to 96% of total C) of the C
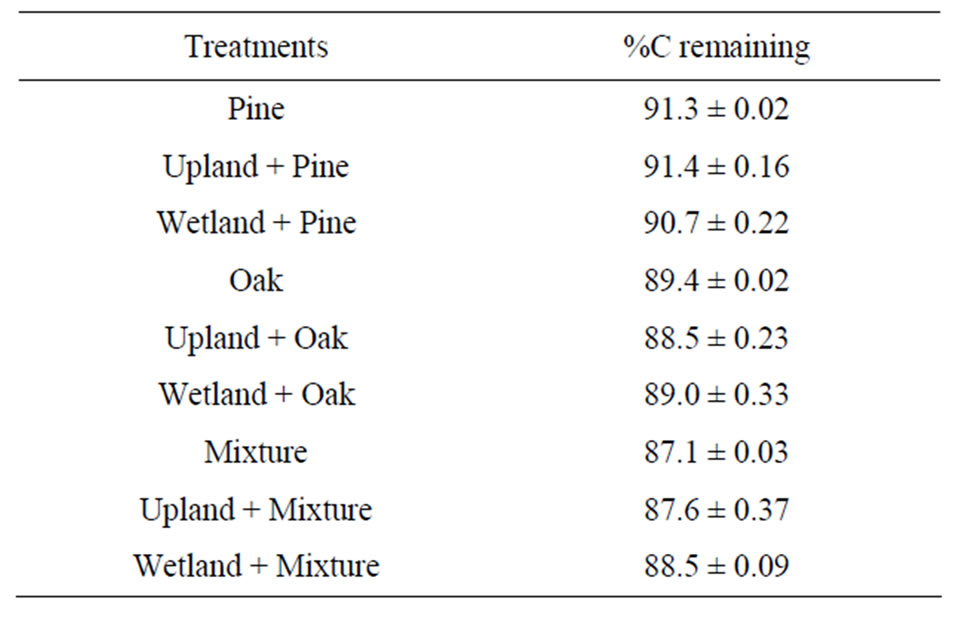
Table 3. Percentage of remaining C after 119-d incubation. Data are means ± SD.
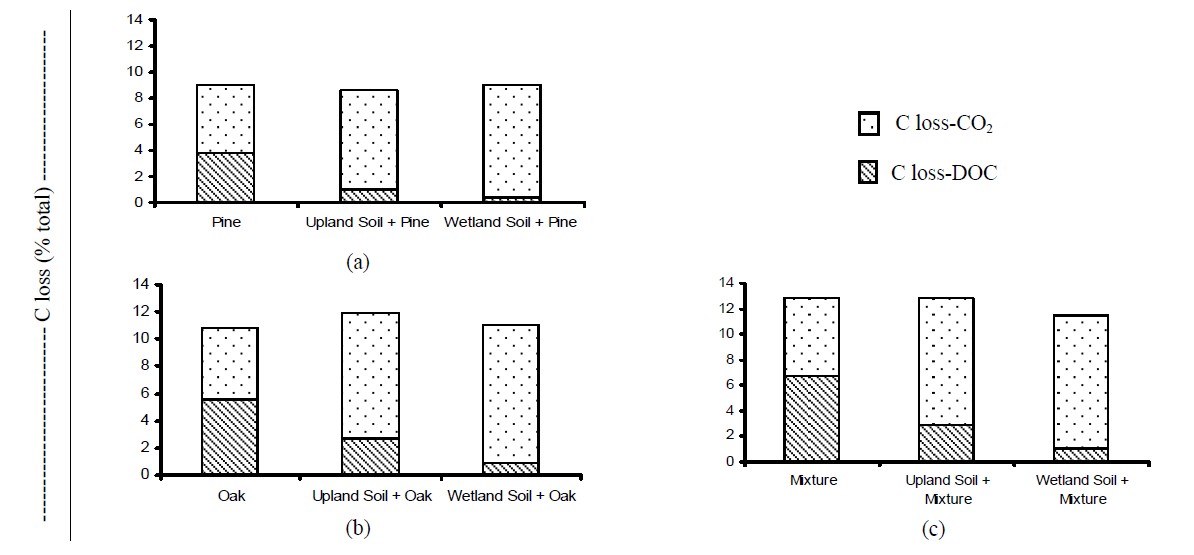
Figure 7. Carbon loss partition after 119-d incubation. (a) Pine treatments; (b) Oak treatments; and (c) Mixture treatments.
loss in the soil treated samples was due to CO2 evolution, while the proportion of total C loss via leaching was more important for the litters incubated alone, accounting for ~42% - 52% of total C loss. Possibly due to the soil microorganisms, DOC released from decomposing litter was more efficiently used as a C source compared to that for the control litter samples (no soil). It is also possible that part of the DOC was transformed to more recalcitrant fractions, contributing to the overall C budget in the soils. In the absence of soil (less microbial biomass), C was mineralized in dissolved forms, which may be follow different pathways in forest soils.
Preliminary testing reveled that a double exponential model gave the best fit to the C loss data (F test, P £ 0.001). The order of decomposition constants was mixture > oak = pine. Over 119-d incubation, our results did not confirm the hypothesis that pine produces recalcitrant litter, with slow decomposition rates [32]. Similar trend was found by [4], who observed that pine decomposition rate was somewhat higher than that observed for oak litter. C loss observed in this present study was comparable to that found by [33] in soils with low nutrient status.
Of the soil and litter quality parameters studied, total N and C:N ratio were significantly (P £ 0.0001) correlated to C loss (r = 0.79 and 0.40, respectively). Contrarily of results obtained by [33], initial lignin was not significantly correlated with C loss, possibly due to the relatively small differences in lignin concentration among the litter species. [28] also observed significant positive relation between C loss and initial N and C concentration of residues, as well as C:N ratio. As observed by [4], initial total N showed strong correlation with C loss (r = 0.79, P £ 0.0001), indicating that this parameter could be used to predict decomposition rates. [9] reported that there was a significant positive effect of internal N concentration on litter decomposition, mainly because the N requirement of the decomposers. Decomposition was more rapidly in mixture treatments, which exhibited greater total N concentration, as well as, lower C:N ratio compared to pine and oak species. As observed by other studies [28,34], N concentration (or C:N ratio) can be used as good predicttor of early stages of litter decomposition. However, for the mixture treatment a number of other traits associated with litter quality and decomposition may have also contributed to the mineralization of mixed litters [7].
Lignin concentration increased in litters over time. During the incubation, lignin concentration increased about 81%, 83% and 127% for pine, oak, and mixture, respectively. The changes in chemical composition of litters after incubation revealed a preferential loss of more labile components in response to litter decomposition.
4. Conclusions
Litter is an important source of DOC and N to the forest soil. This study demonstrated that the patterns of C, N, and P release varied with litter species and soil type. In general, Litter mixtures showed higher C loss and N and P release as compared to single-species dynamics. Further studies are warranted to better understand the process controlling C losses in forest soils.
REFERENCES
- H. Insan and K. H. Domsch, “Relationship between Organic Carbon and Microbial Biomass on Chronosequences of Reclamation Sites,” Microbial Ecology, Vol. 15, No. 2, 1988, pp. 177-188. doi:10.1007/BF02011711
- R. G. Qualls and B. L. Haines, “Biodegradability of Dissolved Organic Matter in Forest Throughfall, Soil Solution and Stream Water,” Soil Science Society of America Journal, Vol. 56, No. 2, 1992, pp. 578-586. doi:10.2136/sssaj1992.03615995005600020038x
- A. H. Magill and L. D. Aber, “Dissolved Organic Carbon and Nitrogen Relationships in Forest Litter as Affected by Nitrogen Deposition,” Soil Biology and Biochemistry, Vol. 32, No. 5, 2000, pp. 603-613. doi:10.1016/S0038-0717(99)00187-X
- M. J. I. Briones and P. Ineson, “Decomposition of Eucalyptus Laves in Litter Mixtures,” Soil Biology and Biochemistry, Vol. 28, No. 10-11, 1996, pp. 1381-1388. doi:10.1016/S0038-0717(96)00158-7
- R. J. Thomas and N. M. Asakawa, “Decomposition of Leaf Litter from Tropical Forage Grasses and Legumes,” Soil Biology and Biochemistry, Vol. 25, No. 10, 1993, pp. 1351- 1361. doi:10.1016/0038-0717(93)90050-L
- T. B. Gartnes and Z. G. Cardon, “Decomposition Dynamics in Mix-Species Leaf Litter,” Oikos, Vol. 104, No. 2, 2004, pp. 230-246. doi:10.1111/j.0030-1299.2004.12738.x
- V. C. Smith and M. A. Bradford, “Do Non-Additive Effects on Decomposition in Litter-Mix Experiments Result from Differences in Resource Quality between Litters?” Oikos, Vol. 102, No. 2, 2003, pp. 235-242. doi:10.1034/j.1600-0706.2003.12503.x
- R. A. Hanse and D. C. Coleman, “Litter Complexity and Composition are Determinants of the Diversity and Species Composition of Orabatid Mites (Acari: Oribatida) in Litterbags,” Applied Soil Ecology, Vol. 9, No. 1-3, 1998, pp. 17-23. doi:10.1016/S0929-1393(98)00048-1
- L. S. Vestgarden, “Carbon and Nitrogen Turnover in the Early Stage of Scots Pine (Pinus sylvestris L.) Needle Litter Decomposition: Effects of Internal and External Nitrogen,” Soil Biology and Biochemistry, Vol. 33, No. 4-5, 2001, pp. 465-474. doi:10.1016/S0038-0717(00)00187-5
- D. J. Ross, K. R. Tate, P. C. D. Newton and H. Clark, “Decomposability of C3 and C4 Grass Litter Sampled under Different Concentrations of Atmospheric Carbon Dioxide at a Natural CO2 Spring,” Plant and Soil, Vol. 240, No. 2, 2002, pp. 275-286. doi:10.1023/A:1015779431271
- P. Dalias, J. M. Anderson, P. Bottner and M. M. C. Teaux, “Temperature Responses of Carbon Mineralization in Conifer Forest Soils from Different Regional Climates under Standard Laboratory Conditions,” Global Change Biology, Vol. 7, No. 2, 2001, pp. 181-192. doi:10.1046/j.1365-2486.2001.00386.x
- T. Sariyildiz and J. M. Andersom, “Interactions between Litter Quality, Decomposition and Soil Fertility: A Laboratory Study,” Soil Biology and Biochemistry, Vol. 35, No. 3, 2003, pp. 391-399. doi:10.1016/S0038-0717(02)00290-0
- G. Seneviratne, L. H. J. Van Holm, L. J. A. Balachandra, and S. A. Kulasooriya, “Differential Effects of Soil Properties on Leaf Nitrogen Release,” Biology of Soils, Vol. 28, No. 3, 1999, pp. 238-243. doi:10.1007/s003740050488
- N. A. Scott, C. V. Cole, E. T. Elliot and S. A. Huffman, “Soil Textural Control on Decomposition and Soil Organic Matter Dynamics,” Soil Society of America Journal, Vol. 60, No. 4, 1996, pp. 1102-1109. doi:10.2136/sssaj1996.03615995006000040020x
- K. Kalbitz, S, Solinger, J. H. Park, B. Michalzik and E. Matzner, “Controls on the Dynamics of Dissolved Organic Matter in Soils: A Review,” Soil Science, Vol. 165, No. 4, 2000, pp. 277-304. doi:10.1097/00010694-200004000-00001
- G. Villegas-Pangga, G. J. Blair and D. B. Lefroy, “Measurement of Decomposition and Associated Nutrient Release from Barrel Medic (Medicago truncatula) Hay and Chickpea (Cicer arientinum) Straw Using In Vitro Perfusion System,” Australian Journal of Agriculture Research, Vol. 51, No. 5, 2000, pp. 563-568. doi:10.1071/AR99118
- C. M. Thirukkumaran and D. Parkinson, “Microbial Respiration, Biomass, Metabolic Quotient and Litter Decomposition in a Lodgepole Pine Forest Floor Amended with Nitrogen and Phosphorus Fertilizers,” Soil Biology and Biochemistry, Vol. 32, No. 1, 2000, pp. 59-66. doi:10.1016/S0038-0717(99)00129-7
- W. R. Horwath and E. A. Paul, “Microbial Biomass,” In: Weaver, R. W. et al., Ed., Methods of Soil Analysis, Part 2. Microbiological and Biochemical Properties, Soil Science Society of America, Madison, 1994, pp. 753-773.
- W. F. DeBusk and K. R. Reddy, “Turnover of Detrital Organic Carbon in a Nutrient-Impacted Everglades Marsh,” Soil Science Society of America Journal, Vol. 62, No. 5, 1998, pp. 1460-1468. doi:10.2136/sssaj1998.03615995006200050045x
- M. Corbeels, A. M. O’Connell, T. S. Grove, D. S. Mendham and S. J. Rance, “Nitrogen Release from Eucalyptus Leaves and Legumes Residues as Influenced by Their Biochemical Quality and Degree of Contact with Soil,” Plant and Soil, Vol. 250, No. 1, 2003, pp. 15-28. doi:10.1023/A:1022899212115
- S. J. You, Y. Yin and H. E. Allen, “Partitioning of Dissolved Organic Matter in Soils: Effects of pH and Water: Soil Ratio,” The Science of the Total Environment, Vol. 227, No. 2-3, 1999, pp. 155-160. doi:10.1016/S0048-9697(99)00024-8
- A. L. Wright and K. R. Reddy, “Heterotrophic Microbial Activity in Northern Everglades Wetland Soils,” Soil Science Society of America Journal, Vol. 65, No. 6, 2001, pp. 1856-1864. doi:10.2136/sssaj2001.1856
- R. Martens, “Estimation of Microbial Biomass in Soil by the Respiration Method: Importance of Soil pH and Flushing Methods for the Measurement of Respired CO2,” Soil Biology and Biochemistry, Vol. 19, No. 1, 1987, pp. 77-81. doi:10.1016/0038-0717(87)90128-3
- SAS Institute, “SAS/STAT Guide for Personal Computers. Version 6,” SAS Inst., Cary, 1999.
- H. W. Hunt, “A Simulation Model for Decomposition in Grasslands,” Ecology, Vol. 58, No. 3, 1977, pp. 469-484. doi:10.2307/1938998
- R. K. Wieder, J. E. Carrel, J. K. Rapp and C. L. Kucera, “Decomposition of Tall Fescue (Festuca elatior var. Arundinacea) and Cellulose Litter on Surface Mines and a Tallgrass Prairie in Central Missouri, USA,” Journal of Applied Ecology, Vol. 20, No. 1, 1983, pp. 303-321. doi:10.2307/2403394
- R. G. Qualls and B. L. Haines, “Fluxes of Dissolved Organic Nutrients and Humic Substances in a Deciduous Forest,” Ecology, Vol. 72, No. 1, 1991, pp. 254-266. doi:10.2307/1938919
- R. Aerts and H. Caluwe, “Nutritional and Plant-Mediated Controls on Leaf Litter Decomposition of Carex Species,” Ecology, Vol. 78, No. 1, 1997, pp. 244-260.
- S. L. Tisdale, W. L. Nelson, J. D. Beaton and J. L. Havlin, “Soil Fertility and Fertilizers,” 5th Edition, Prentice Hall, New Delhi, 1995.
- E. A. Paul, D. Harris, H. P. Collins, U. Schulthess and G. P. Robertson, “Evolution of CO2 and Soil Carbon Dynamics in Biologically Managed, Row-Crop Agroecosystems,” Applied Soil Ecology, Vol. 11, No. 1, 1999, pp. 53- 65. doi:10.1016/S0929-1393(98)00130-9
- N. Buchmann, “Biotic and Abiotic Factors Controlling Soil Respiration Rates in Picea Abies Stands,” Soil Biology and Biochemistry, Vol. 32, No. 11-12, 2000, pp. 1625- 1635. doi:10.1016/S0038-0717(00)00077-8
- B. R. Wood, “Field Investigations on the Decomposition of Leaves of Eucalyptus Delegatensis in Relation to Environmental Factors,” Pedobiologia, Vol. 14, 1974, pp. 343-371.
- T. Sariyildiz and J. M. Anderson, “Interactions between Litter Quality, Decomposition and Soil Fertility: A Laboratory Study,” Soil Biology and Biochemistry, Vol. 35, No. 3, 2003, pp. 391-399. doi:10.1016/S0038-0717(02)00290-0
- A. Hector, A. J. Beale, A. Minns, S. J. Otway and J. H. Lawton, “Consequences of the Reduction of Plant Diversity for Litter Decomposition: Effects through Litter Quality and Microenvironment,” Oikos, Vol. 90, No. 2, 2000, pp. 357-371. doi:10.1034/j.1600-0706.2000.900217.x