Open Journal of Soil Science
Vol.1 No.2(2011), Article ID:7587,15 pages DOI:10.4236/ojss.2011.12004
Identification of Soil Management Factors from Spatially Variable Soil Properties of Coastal Plain Sands in Southeastern Nigeria
![]()
Department of Soil Science, University of Uyo, Uyo, Nigeria.
Email: *obijbc@yahoo.com
Received August 3rd, 2011; revised August 22nd 2011; accepted August 29th, 2011.
Keywords: Spatial Variability, Factor Analysis, Pedogenesis, Precision Agriculture
ABSTRACT
Variability in soil properties is a critical element across wide areas of researches especially in several aspects of agriculture and environment including sewage disposal and global climate change. Particle size fraction (sand, silt, and clay), effective cation exchange capacity, base saturation, pH, organic carbon, total nitrogen, carbon nitrogen ratio, available phosphorus, exchangeable bases (calcium, magnesium, sodium, potassium) and acidity are frequently used in agriculture for soil management. The objective of this study therefore was to identify soil management factors from these set of 15 soil properties and spatial distribution of representative soil management properties. The study was carried out in the University of Uyo Teaching and Research Farm measuring 8.19 hectares in University of Uyo Annex, Uyo in Akwa Ibom State of Nigeria. Nine and ten traverses were made horizontally and vertically respectively at 40 meters intervals. A total of 58 soil samples were collected at 0 - 15 cm depth on the grid nodes of the traverses. Particle size distributions, exchangeable bases and acidity, effective cation exchange capacity (ECEC), available phosphorus (avail. P), base saturation (BS), organic carbon, total nitrogen, carbon nitrogen ratio (CNR) and pH of the samples were determined in the laboratory. Coefficient of variation indicated that 26.6% of the soil properties (sand content, pH, CNR and sodium) were least variable, 40.1% comprising silt, clay contents, ECEC, base saturation, phosphorus and magnesium were moderately. Whereas 33.3% of the soil properties comprising clay content, organic carbon, total nitrogen, exchangeable Ca, K and acidity (i.e.) were highly variable. There were significant correlation (p < 0.05) in 26.6% of the soil properties, the strongest negative significant (p < 0.01) correlations were between sand and clay (r = –0.85), exchangeable acidity and base saturation (r = –0.85), whereas the strongest positive significant correlations were between ECEC and Ca (r = 0.80), Ca and BS (r = 0.74), organic carbon and total nitrogen (r = 0.80). Principal component analysis indicated the existence of six factors including mineralogical or weathering, soil organic matter, cation exchange activity, soil texture, and dispersion and soil phosphorus based on either management or pedological considerations. Semivariance statistics showed that sand and clay contents, ECEC, BS and total N were moderately (≥25.7% ≤47.3%), while silt content, pH, organic carbon, CNR, avail. P, exchangeable Ca, Mg, Na and acidity (≥0.18% ≤22.8%) were strongly spatially dependent. The variability observed was primarily incident upon factors of soil formation. Therefore, the utilization of spatial structure of organic matter and texture factors in the management of nutrient and soil water will facilitate planning of crop production scheme on coastal plain sands soils.
1. Introduction
Variability in soil properties is a critical element across wide areas of researches especially in several aspects of agriculture and environment including sewage disposal [1] and global climate change [2]. Spatial variability of soil properties is inherent in nature due the influence of geogenetic/pedogenetic processes and management/land use related activities. Pedogenetic (intrinsic) variables interact with each other across spatial and temporal scales and their effects are further modified by erosional and depositional processes [3] which influence landscape evolution. Management and land use related forces may not completely be spatiotemporal on a large scale considering production systems largely practiced in subSaharan Africa which consist minimal application of agrochemicals and equipment utilization.
The overall effect of forces that act in concert to modify the properties of soil as it evolved indicated that the characteristics of factors responsible for variability imposes both short and long range variability that is equally multivariate in nature [4]. The knowledge of major contributors to soil variability especially at a single plot scale should be complemented with the establishment of minimum data set that could enhance management decision processes for optimum output. It has been reported that many of the soil properties are highly correlated and function in concert with each other [5,6]. The correlation and intercorrelation among soil properties suggests the use of superior statistical procedure that will simultaneously account for relationship among several soil properties. Multivariate statistical analyses provide techniques for simultaneously analyzing correlated variables. This method of statistical analysis could reveal relationships not previously suspected when variables were analysed separately [7]. The use of factor analysis facilitates reduction of large number (p) of correlated variables to m < p uncorrelated factors that are linear functions of the original variables. Each factor is responsible for the correlation among the group of soil properties that comprised it. Duffera, et al., [8] conducted two mixed model analysis and principal component analysis to describe the field scale horizontal and vertical variability of soil physical properties and their relations to soil map units in typical southeastern US coastal plain sands soils. Their results indicated that some of the soil physical properties such as texture, soil water content and plant available water showed significant spatial structure and were captured by soil map units.
Soils of southeastern Nigeria formed on unconsolidated coastal plain sands are characterized by the dominance of sandy textured fragments (comprising larger quantities of coarse over fine textured materials), have low physical and chemical fertility due to dominance of low activity clays and inherent low organic matter contents [9-11]. Agricultural production on these soils which previously possess capacity for moderately high yield under typical traditional shifting cultivation and fallow system is largely at the subsistence level. The population pressure had drastically shortened the length of fallow and subsequently reduced soil organic matter contents which complements low cation exchange capacity that characterize low activity clay soils that dominates the sub-Saharan Africa. These soils may not possibly sustain large-scale intensive production system which must be introduced in a sustainable manner if sub-Saharan Africa could improve agricultural production as they grapple with the millennium development goals. The enormous problems of crop production and management systems associated with sub-Saharan Africa ranging from unavailability of inputs, poverty, low soil fertility and resilience and technology creates the need to establish some soil management factors that will facilitate reduction in the dimensionality of parameter indicative of capacity of soils to give optimal crop yield and at the same time adaptive for site-specific management.
The objective of this study therefore was to identify soil management factors from a set of 15 soil properties documented frequently as components of routine analysis and accompanying spatial structure for site specific soil management. The soil properties included Particle size fraction (sand, silt, and clay), effective cation exchange capacity, base saturation, pH, organic carbon, total nitrogen, carbon nitrogen ratio, available phosphorus, exchangeable calcium, magnesium, sodium, potassium and acidity.
2. Materials and Methods
2.1. Description of Study Area
The study was carried out in the University of Uyo Teaching and Research Farm (measuring 8.19 hectares) in University of Uyo Annex, Uyo in Akwa Ibom State of Nigeria. Akwa Ibom State (Figure 1) is located within a tropical climate characterized by rainy season (February/ March-November) and dry season (November-February/ March). Rainfall ranges from 3000mm along the Atlantic coast to 2000mm in the hinterland [12] with overall topography typically of unconsolidated marine and fluvial deposit formation. The State falls within the sedimentary areas of Nigeria with up to 80% of the soil formed on coastal plain sands (>70%) and alluvium [9,10, 12]. Soils on coastal plain sands are normally deep,
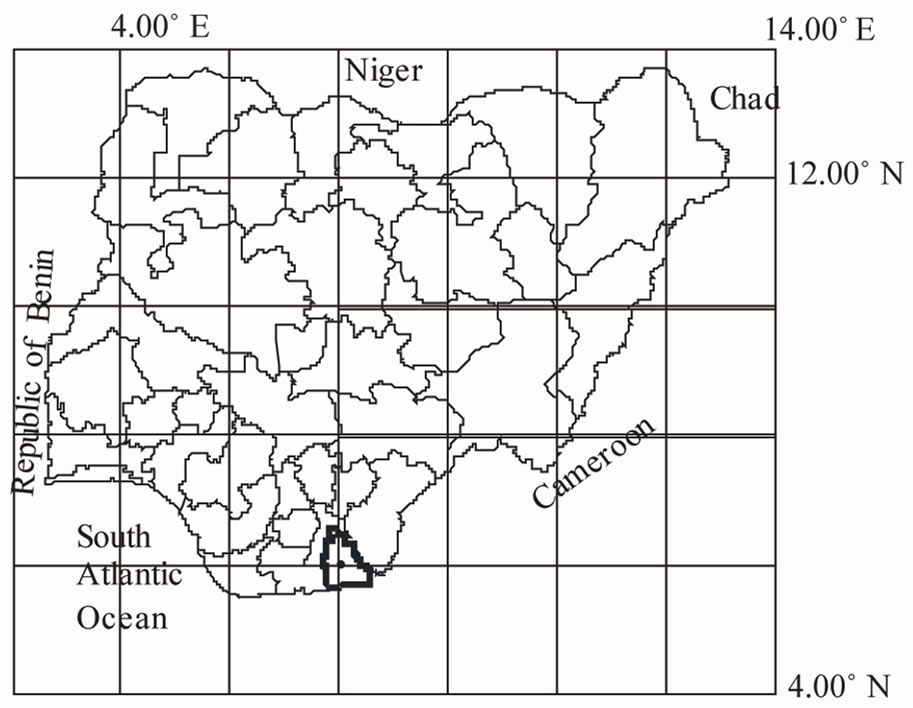
Figure 1. Location map showing Uyo (•) in Akwa Ibom State (bold lines) of Nigeria.
dominantly sandy with low clay, organic matter content and pH. The soils are well drained, deeply weathered and formed on sandy, coarse-loamy materials, have udic moisture regime. There is greater clay content in the Bt horizons and less sand in Ap horizons. The soil temperature regime is isohypertermic.
The farm was used for intensive leafy vegetable production that comprised Talinum triangulare and Telferia occidentalis on raised beds under low organic amendment (poultry droppings), whereas some parts are either under fallow or low intensity cattle grazing (Figure 2). The soils were classified as Aerenic Hapludalf coarseloamy siliceous isohyperthermic (25%), Aerenic Paleudult coarse-loamy siliceous isohyperthermic (15%) and Typic Paleudult coarse-loamy siliceous isohyperthermic (60%).
2.2. Soil Sampling and Analysis
Nine horizontal and ten vertical traverses were made at 40 meter intervals (Figure 2). Soil samples were collected at 0 - 15 cm depth on the grid nodes of the traverses. Fifty-eight (58) soil samples were collected based on the allowable number of points considering the shape of the farm. The sampling points comprised maximum of nine points at the first traverse and minimum of two at the tenth with each traverse consisting n – 1 sampling points with the exception of traverses 2, 3 and 4 that had 8 each. Schematic presentation of the sampling scheme was presented as Figure 2. The samples were air dried, pulverized and made to pass through 2-mm mesh sieve. Particle size distribution was carried out through hydrometer method [13]. Total nitrogen and organic carbon were determined by Kjeldahl [14] and dichromate oxidation [15] methods respectively. Soil pH was determined in a 1:2 (soil:water) solution using pH meter [16]. Exchangeable bases and available phosphorus (avail. P) were extracted with Mehlick No. 3 extraction [17]. Potassium (K) and sodium (Na) content were read with the aid of flame emission spectroscopy, calcium (Ca2+) and magnesium (Mg2+) were read with the aid of atomic absorption spectroscopy (AAS), while total phosphorus was determined colorimetrically. Exchangeable acidity was extracted with un-buffered potassium chloride solution and titration with 0.01M-solution of sodium hydroxide to the first permanent pink endpoint as described by Anderson and Ingram [18], while effective cation exchange capacity (ECEC) was determined through summation [19].
2.3. Statistical Analysis
2.3.1. Descriptive statistics
The soil properties were analyzed using classical statistical methods to obtain descriptive statistics, measure of central tendency and normality of distribution [20] using SAS Institute [21]. Soil properties significantly skewed or kurtous were either log or square root transformed [22, 23] and normality recalculated. Data were then back transformed using weighted technique which is superior to simple back transformation because it more closely approximates true population statistics [24] before using geostatistical analysis.
2.3.2. Principal Component Analysis
Factor analysis was also used to group the fifteen (15) soil properties into statistical factors based on their correlation structure using SAS Institute [21]. Factor analysis as a generic term includes principal component analysis and common factor analysis. While the two techniques are functionally very similar and are used for the same purpose (data reduction), they are quite different in
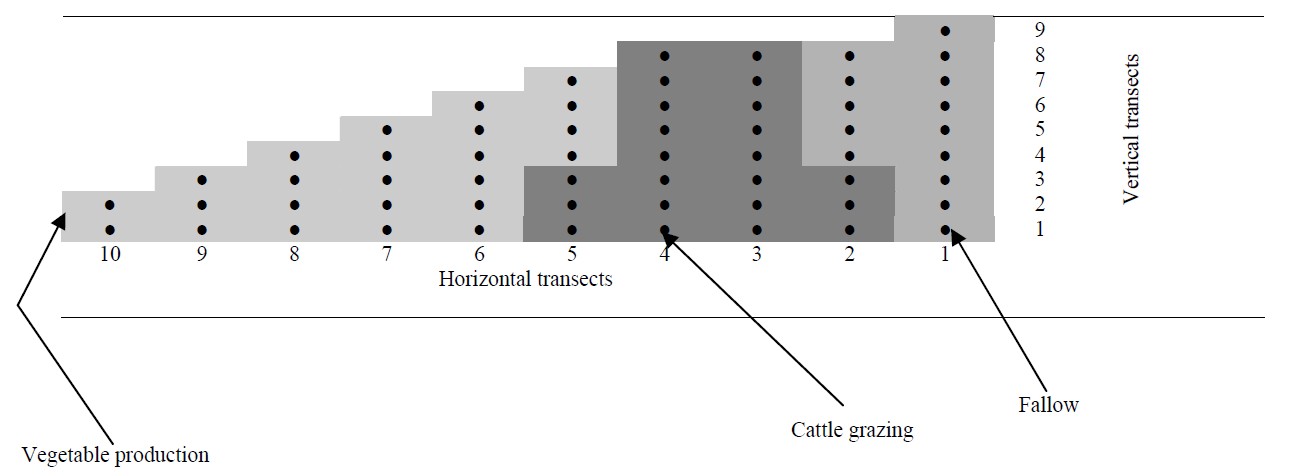
Figure 1. Showing approximate distribution of sampling points (●) considering the shape of the farm and concentration of various land uses ( ).
).
terms of underlying assumptions. The term “common” in common factor analysis describes the variance that is analyzed. It is assumed that the variance of a single variable can be decomposed into common variance that is shared by other variables included in the model, and unique variance that is unique to a particular variable and includes the error component. Common factor analysis (CFA) analyzes only the common variance of the observed variables while principal component analysis (PCA) considers the total variance and makes no distinction between common and unique variance and researchers does not have to allot weights. Principal component analysis was used as the method of factor extraction because it does not require prior estimates of the amount of variation in each of the soil properties explained by the factors. Factor (principal component) analysis was performed on standardized variables using correlation matrix (Table 2) to eliminate the effect of different measurement units on the determination of factor loadings [7, 25].
Factor loadings are the simple correlation between properties and each factor [26]. Eigenvalues are the amount of variance explained by each factor [26]. Standardization of soil properties lead to the arrival on variance value 1 for each variable and a total of 15 for the entire data set. Factors with eigenvalues > 1 explained more total variation in the data than individual soil properties, and factors with eigenvalues < 1 explained less total variation than individual soil properties. Therefore, only factors with eigenvalues > 1 were retained for interpretation. Retained factors were subjected to varimax rotation. A varimax rotation redistributed the variance of each factor to maximize relationships between the interdependent soil properties [21].
Commonalities estimate the proportions of variance in each soil property explained by the factors. A high commonality for soil property indicates a high proportion of its variance is explained by the factors. In contrast, a low commonality for a soil property indicates much of that property’s variance remains unexplained. Less importance should be ascribed to soil properties with low commonalities at interpretation of factors. Each of the factors could be useful in management decision with regard to the individual members and probably could reduce activities involved in field sample collection, laboratory analysis and difficulties in the effort to be able to combine the various research output to arrive at a suitable recommendations for optimal agricultural production and sustainable environmental management.
2.3.3. Geostatistics and Kriging
The degree of spatial variability for each soil property was determined by geostatistical methods using semivariogram analysis and kriging [27-29]. Prior to the application of geostatistics, each variable was checked for normality, trend, and anisotropy. A geographic trend was determined using exploratory data analysis tools in Spatial Module of S-Plus [30]. If a variable had a geographic trend, then a first-order (linear) model was developed between soil variable z (dependent variable) and the x, y geographic coordinates (independent variables). The linear trend model was tested as an ordinary regression by ANOVA. If the linear trend model was significant (p ≤ 0.05), then the soil variable was detrended by subtracting the soil variable values from the linear model calculations. The residuals were regarded as closer to stationary and were used to calculate semivariograms. The residual interpolation was performed with ordinary kriging. Finally, adding the kriged residuals to the first order trend completed the mapping of the variate. Since the exact form of semivariogram model was never known, the given model selected and used was only an approximation of its function [31]. However, to come up with a best model, a jack-knifing procedure was performed. In this trial-and-error method, every known point was estimated using the surrounding data points but not the measured data point. Thus, every semivariogram for each soil variable was adjusted by trial and error until a best fit between the estimated and actual values was found [28]. A semivariogram was determined for each variable to ascertain the degree of spatial variability between neighboring observations, and the appropriate model function was fit to the semivariogram. The semivariogram function [32] was calculated as follows:
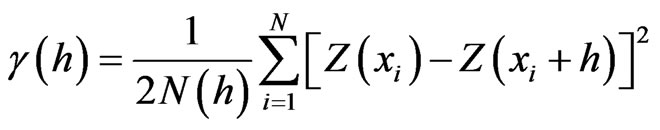 (1)
(1)
where h is the lag distance
 is the semivariance at lag h
Z is a random variable (value of soil property)
Z(xi) is random variable for a fixed location xi
N(h) is the number of pairs of values Z(xi)
Z(xi + h) separated by a vector h.
The three basic parameters which describe spatial structure of semivariogram plots comprised
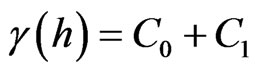
where C0 is the nugget effect
C1 is the structural variance,
a the range of spatial dependence and
C0 + C1 is the sill.
Finally contour maps of each variable at each depth were created through ordinary kriging [31,33,34] using their respective semivariogram models in Spatial Module of S-Plus [30].
3. Results and Discussion
3.1. Variation of Soil Properties
The mean and median values served as primary estimates of central tendency, while standard deviation (SD), coefficient of variation (CV), skewness and kurtosis served as estimates of variability (Table 1). Normality was accepted or reject on the consideration of p-value labeled as PR < W (Shapiro-Wilk test) in relation to the anticipated level of significance. The null hypothesis that data set is from normally distributed population was either accepted or rejected on the consideration that the p value (PW < R) is either greater or less than the anticipated level of significance. For instance, PR < W values that were less than 0.05 indicated that data set were not drawn from a normally distributed population. The variables that were normally distributed included sand, base saturation (BS), organic carbon (Org. C), total nitrogen (Total N), available phosphorus (avail. P) and exchangeable acidity (Exch. Acidity), while silt content, clay content, effective cation exchange capacity (ECEC), pH, carbon: nitrogen ratio (CNR), exchangeable calcium (Ca), magnesium (Mg), sodium (Na) and potassium (K) were non normally distributed (i.e. either skewed or kurtous). Despite skewness and kurtosis of the soil properties, the mean and median values were similar to each other indicating that the outliers did not dominate the measure of central tendency and could be used in exploratory data analysis. The underlying reasons for normal and non-normal distributions were unknown, but management and land use seems to be possible causes. The area was used for vegetable production, cattle grazing and fallow and these various uses may have contributed to the variation of some of the soil properties. The non-normal variables were either square root or natural logarithm transformed (Table 1). It was reported that many skewed or kurtous soil properties were normalized with either log or square root transformation [22,35]. It was observed that silt content, clay content, ECEC, pH (log transformed), Ca, and Mg (square root transformed) were normalized while CNR, Na and K were not. It is instructive to note that outliers did not dominate the measure of central tendencies in the entire data including CNR, Na, and K that had median equal to mean in Na, and less than it did by 3.3% and 11.1% in CNR and K respectively. Cambardella et al., [23] and Shukla et al., [5,36] reported similarity in mean and median values for several soil physical, chemical and biological properties. Cambardella et al., [23] tried transformation but without achieving normality in some variables, while Shukla et al., [5] did not attempt transformation but both were still able to arrive at good result in their spatial analysis.
Ranking of coefficient of variation (CV) of soil properties into different classes including least (<15%), moderately (15% - 35%), and highly (>35) variable according to Wilding [37] was adopted in this study. Results shown in Table 1 indicated that among the 15 soil properties measured, 26.6% (i.e. sand content, pH, CNR and Na) were least variable, they had coefficient of variation less
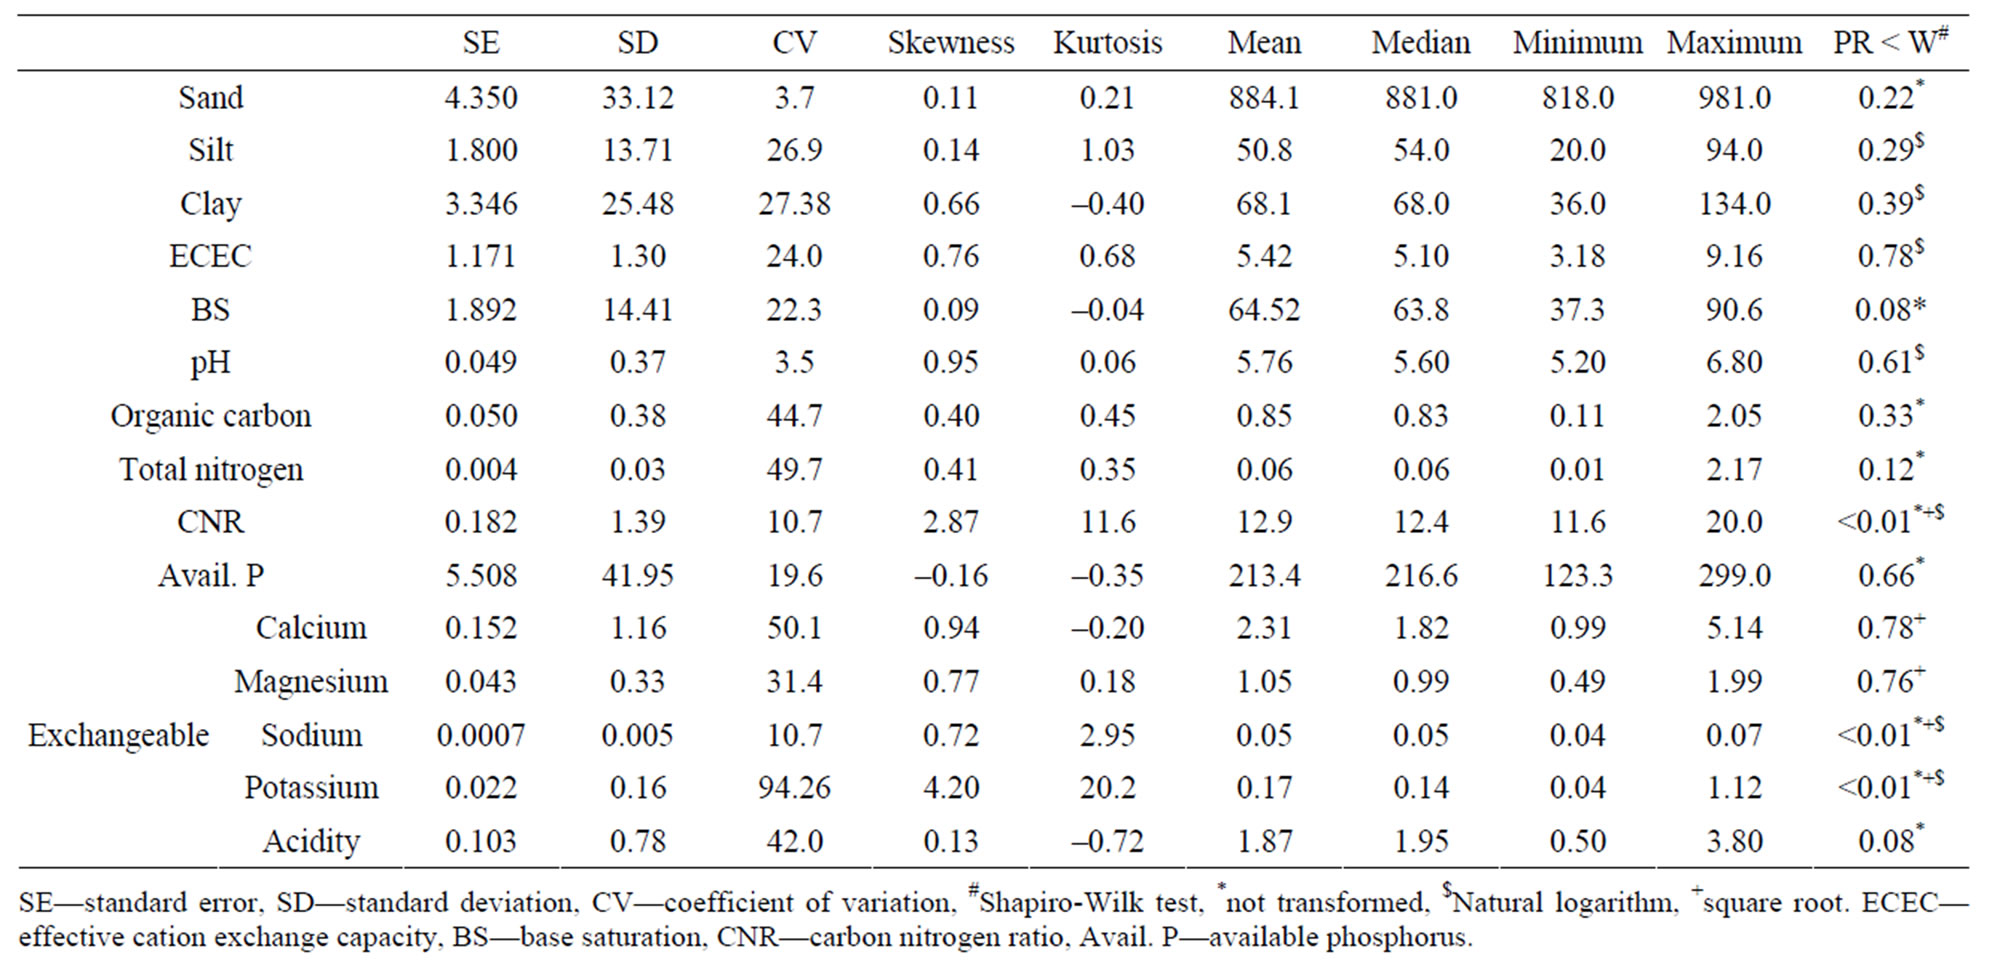
Table 1. Descriptive statistics of properties of coastal plain sands soils in the humid tropical southeastern Nigeria.
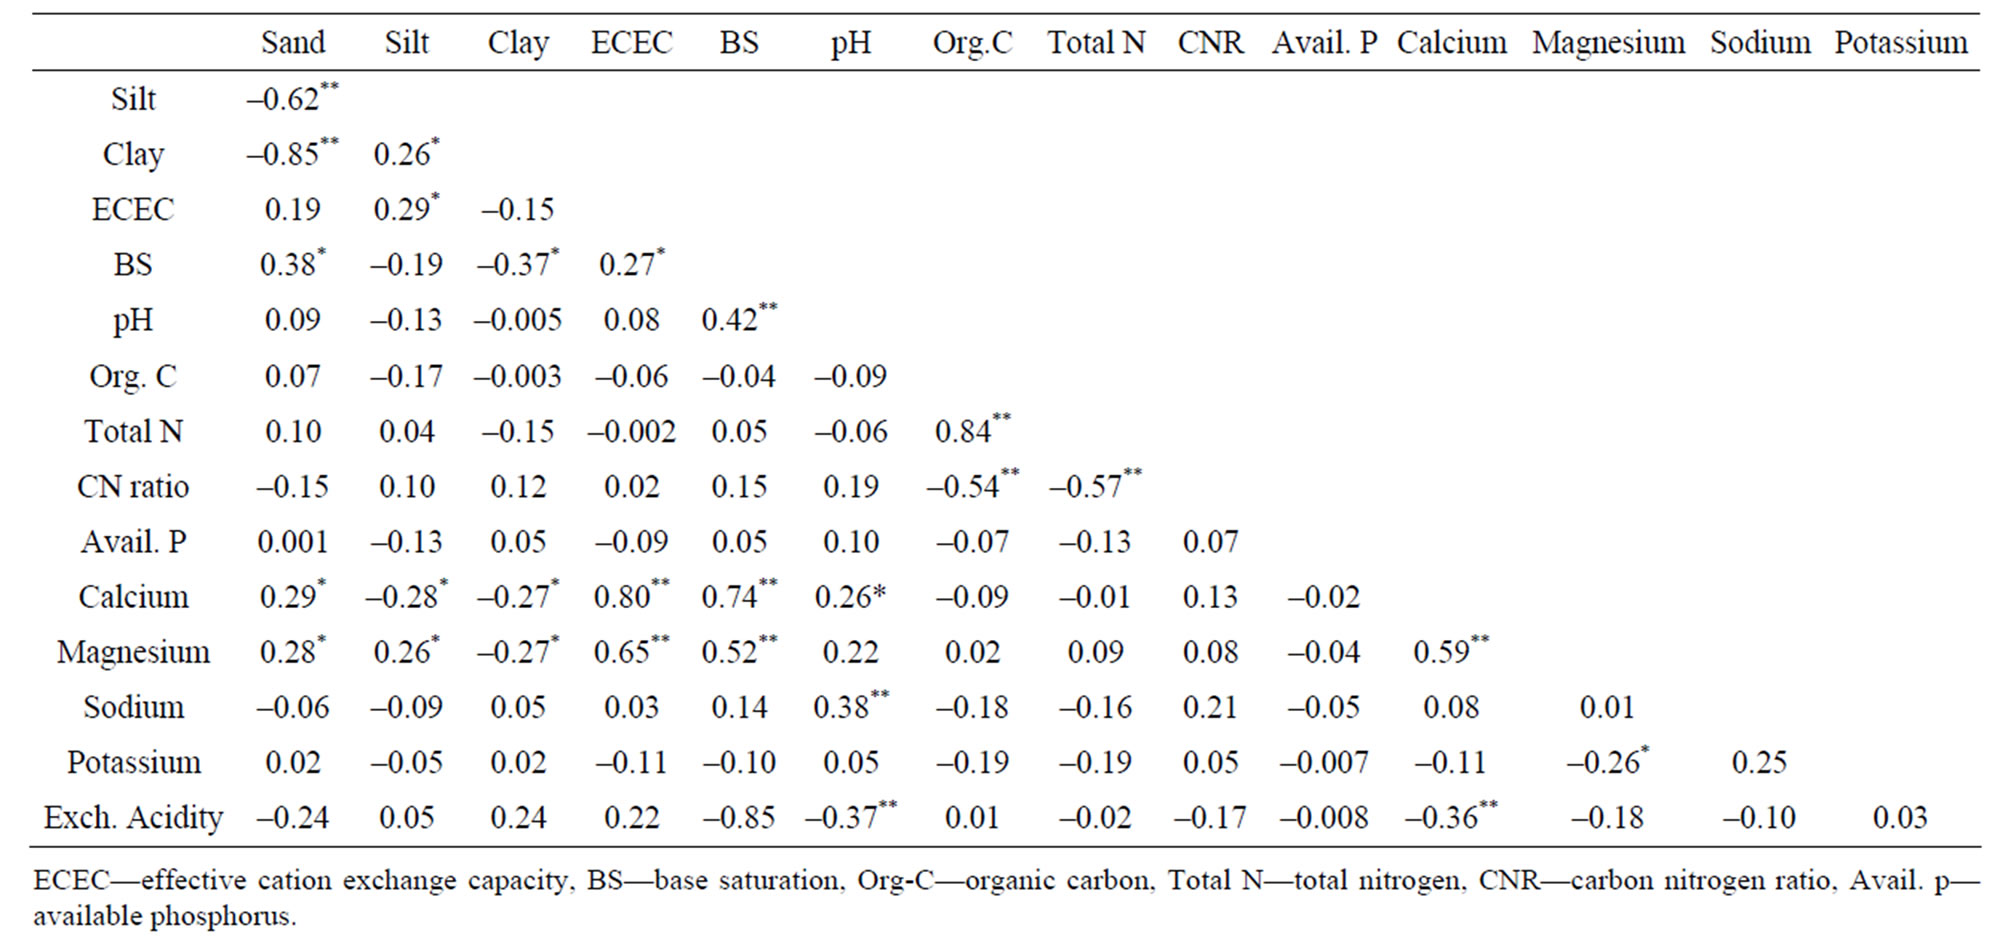
Table 2. Pearson correlation coefficient of coastal plain sands soil properties in southeastern Nigeria.
than 15%, whereas 40.1% comprising silt content, clay content, ECEC, base saturation, available phosphorus and exchangeable magnesium were moderately variable as they had CV > 15 ≤ 35%. The remaining soil properties organic carbon, total nitrogen, exchangeable Ca, K and acidity (33.3%) were highly variable (CV > 35%). There were significant correlation (p < 0.05) in 26.6% (Table 2) of the soil property pairs and that was reasonable for identification of underlying factor pattern. This result was expected based on the characteristics of the study area indicating significant correlation among soil properties that bear relationship with one another [11,38]. The established trend indicated the possibilities of grouping soil properties into similarity factors based on their correlation patterns. Exchangeable Ca and Mg significantly correlated with the highest number of soil properties (i.e. each correlated with 6 other soil properties), while the least was available P. that did not significantly correlate with any, then closely followed by Na and K that significantly correlated with pH (r = 0.38, p < 0.01) and Mg (r = 0.26, p < 0.05) respectively. The strongest negative significant (p < 0.01) correlations were between sand and clay (r = –0.85), exchangeable acidity and base saturation (r = –0.85), whereas the strongest positive significant correlations were between ECEC and Ca (r = 0.80), Ca and BS (r = 0.74), organic carbon and total nitrogen (r = 0.80). The few significant correlations observed between Na/K and other soil properties could be because of their very low concentration in the coastal plain sands soils [11].
3.2. Discrimination of Soil Properties into Pedological and Management Factors
The result of principal component analysis shown in Table 3 indicated that first six factors had eigenvalues greater than 1 and were retained for interpretation. Commonalities, which can be regarded as indicators of the importance of the variables in the analysis are generally high (>60%). This was a confirmation of the allusion that significant correlations observed in the soil properties was the characteristics of the coastal plain sand soils and reasonable for identification of underlying factor pattern. Commonalities for the soil properties showed that the six retained factors explained 90% of the variance in sand content, ECEC, BS and exchangeable acidity and ≥ 80 < 90% in clay content, organic carbon content, total nitrogen and exchangeable calcium. However, the factors explained > 60 < 80% in silt content, pH, CNR available P, Mg, Na and K. The order in which factors were interpreted was determined by the magnitude of their eigenvalues. The signs of the eigenvalues indicated that the variables made either negative or positive contribution to the factor. However, if the signs were ignored, each of the coefficients represented the relative contributions of its associated value to the function. The terms used for the extracted factors in their order were mineralogical or weathering, soil organic matter, cation exchange activity, soil texture, and dispersion and soil phosphorus factors. These listings were based on either management or pedeological considerations.
The weathering factor had the highest loading of >0.36 in base saturation, Ca and Mg, with comparably high
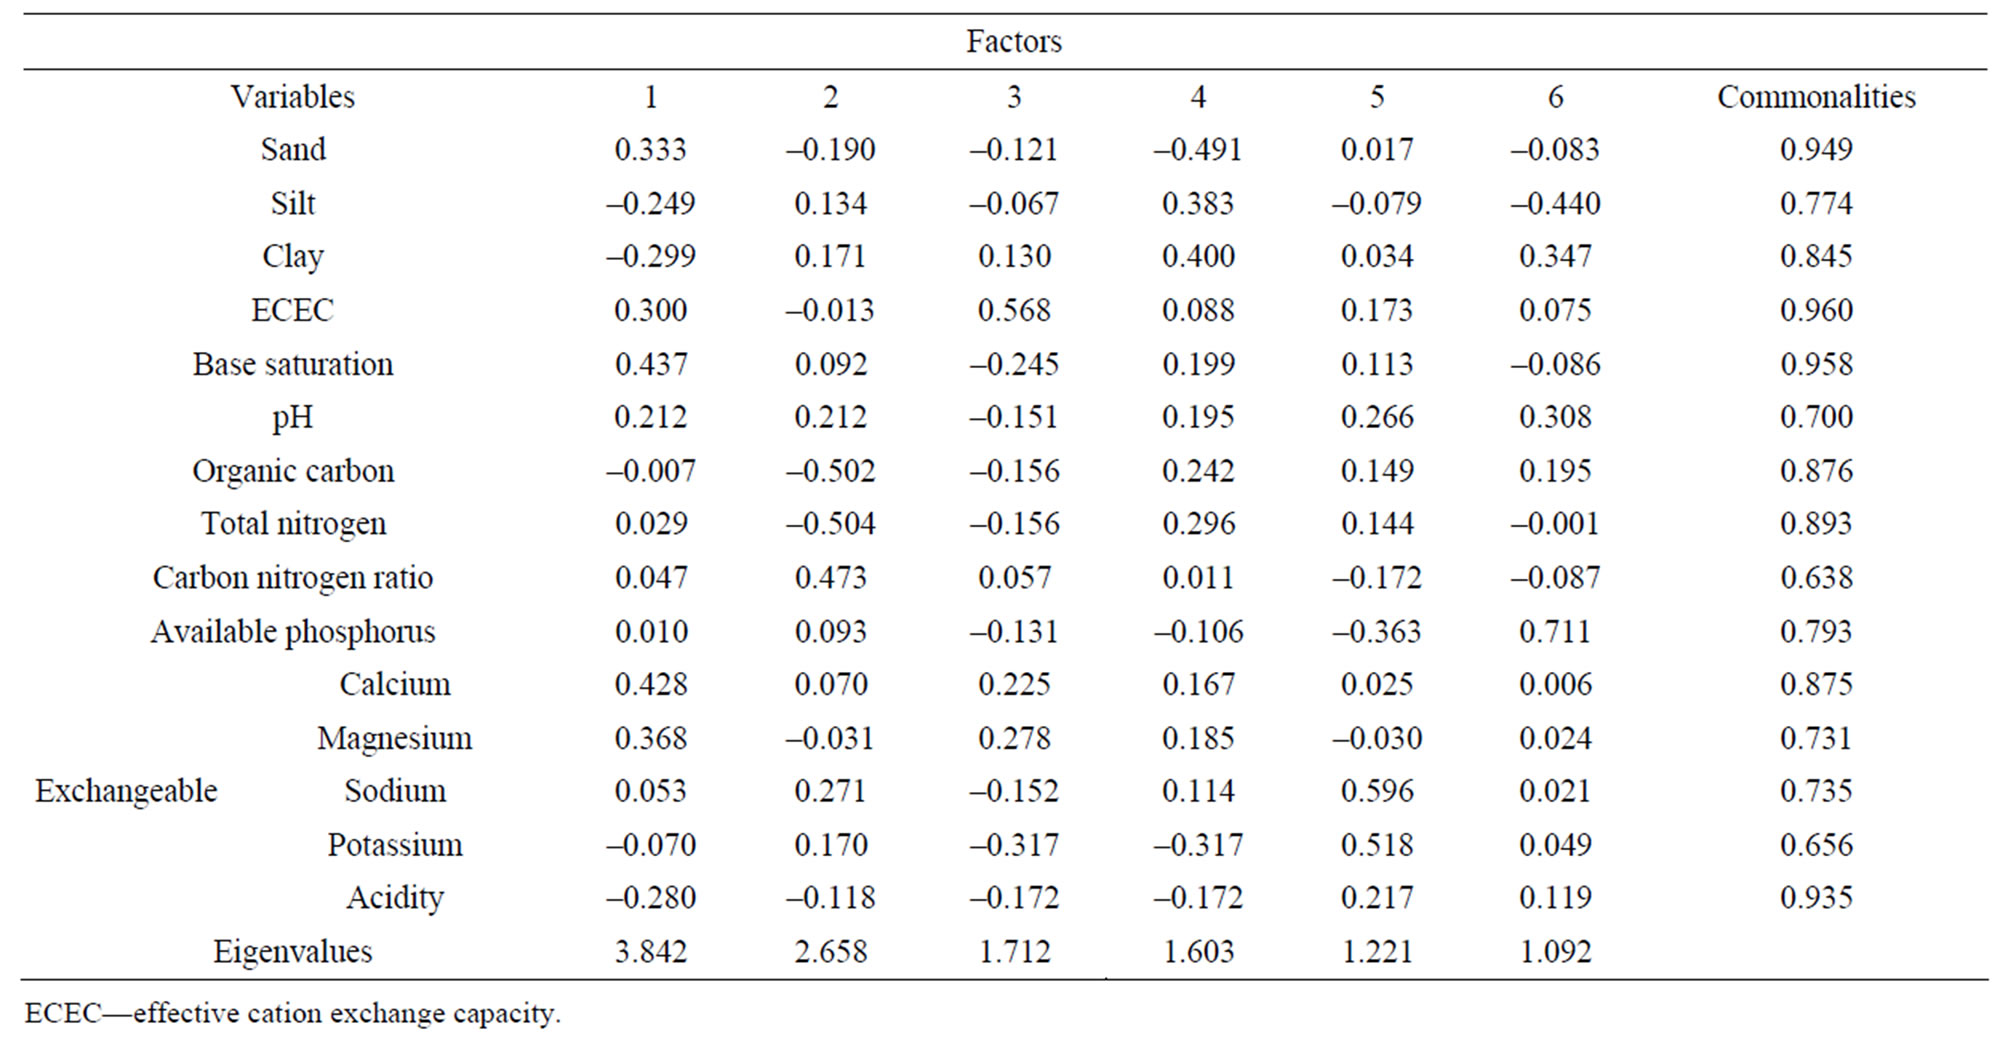
Table 3. Rotated factor loadings and commonalities of a six factor model of soil properties in the coastal plain sands soil of southeastern Nigeria.
positive loadings for sand content and ECEC and moderate negative loadings for silt (–0.24), clay (–0.29) and exch. acidity (–0.28). This may have resulted from the highest frequency of correlation displayed by Ca, Mg and BS with majority of the soil properties. Soil survey staff [21] used base saturation to indicate extent of weathering and in classification/differentiation between Alfisols and Ultisols. Also Shaw et al., [39], Voortman et al., [40] Olatunji, et al., [41] used ratios of the exchangeable bases (Ca, Mg and K) as indicators of extent of leaching/ weathering (age) in soils. The second factor was soil organic matter that comprised organic carbon content, total nitrogen and CNR which loaded ≥ 0.47 < 0.51 and are variables frequently used in evaluation and management of soil organic matter [42]. The third factor was termed soil cation exchange activity factor. Seybold et al., [43] defined cation exchange capacity (CEC) as the sum of the exchangeable cation that a soil can hold at a specified pH. The importance of CEC in the management of soils for agricultural purposes informed its use in the classification of soils at the family level (Soil Survey Staff, 2006). ECEC (rather than CEC for acid soils, Soil Survey Staff, 2006) had the highest loadings of >0.56 and associated with the exchangeable bases (Ca, Mg, K and BS) that loaded 0.22, 0.27, –0.31 and –0.24 respectively. The fourth factor was the soil texture factor because it had the highest positive loadings of silt (0.38) and clay (0.40), negative loadings of –0.41 (sand content) and possibly –0.31 (K) found in biotites, muscovites, vermiculite, montmorilonites etc. apart from silicon, aluminum and iron oxides. The fifth factor had highest positive loadings in Na (0.59) and K (0.51), with accompanying high positive loadings of 0.26 (pH), 0.21 (exch. Acidity) and negative loadings of –0.36 (avail. phosphorus). This factor was termed dispersion factor as it was the only factor that had Na loading highly, was not classified under any of the other previous factors and is not a major factor in soil management so long as it remains very low in the soils of the study area. This factor could equally be termed soil acidity factor for the occurrence of both pH and exch. Acidity. The sixth was termed the soil P factor which loaded 0.71 (avail. P), while accompanying silt, clay and pH loading –0.44, –0.34 and 0.30 respectively. pH had its highest loading at the sixth factor indicating its very close association with availability and management of soil and plant available phosphorus [38]. Generally, it was suspected that low factor loadings could affect classification of the soil properties but it did not because the factors were actually management and pedological groupings that could assist in designing of agronomic/crop husbandry experimental research and planning of site-specific crop production strategies for optimum output and knowledge of pedogenesis.
3.3. Spatial Structure Analysis
The degree of spatial variability for each soil property determined by geostatistical methods using semivariogram analysis and kriging were shown in Figures 3-7. Figure 3, comprised particle size fractions, Figure 4, base saturation, exchangeable calcium and magnesium and Figure 5 organic carbon, total nitrogen and carbon nitrogen ratio. Whereas Figure 6 comprised pH, available phosphorus and exchangeable acidity and Figure 7, effective cation exchanges capacity, exchangeable sodium and potassium.
The semivariogram parameters were presented in Ta-

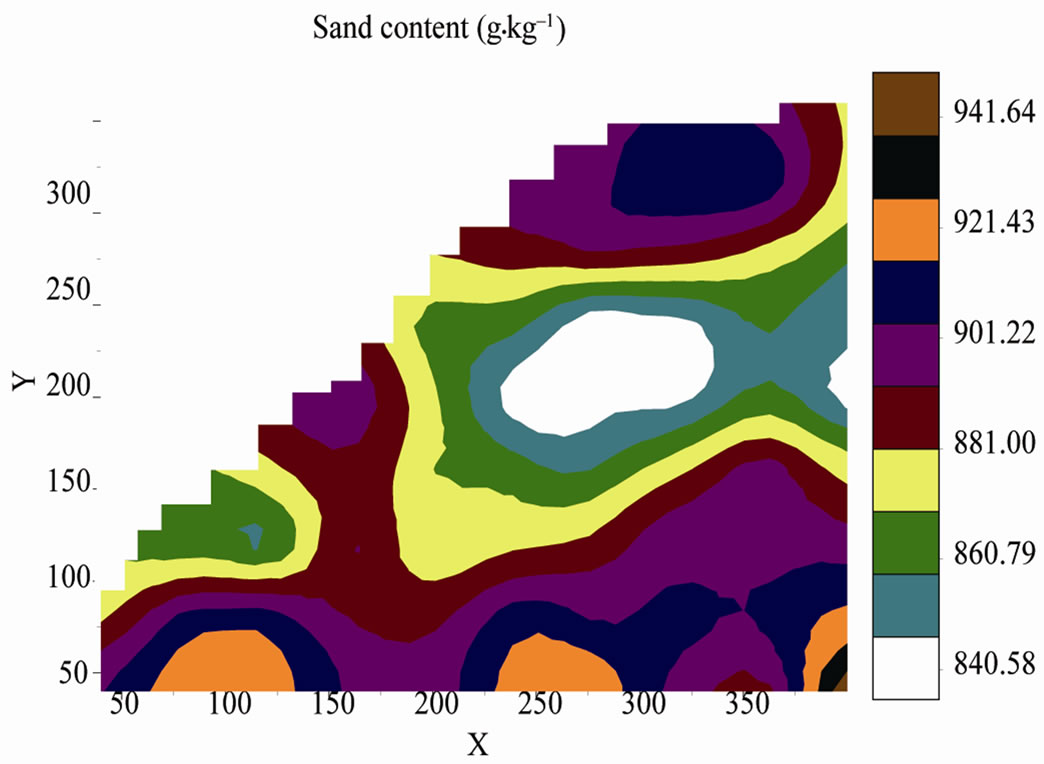
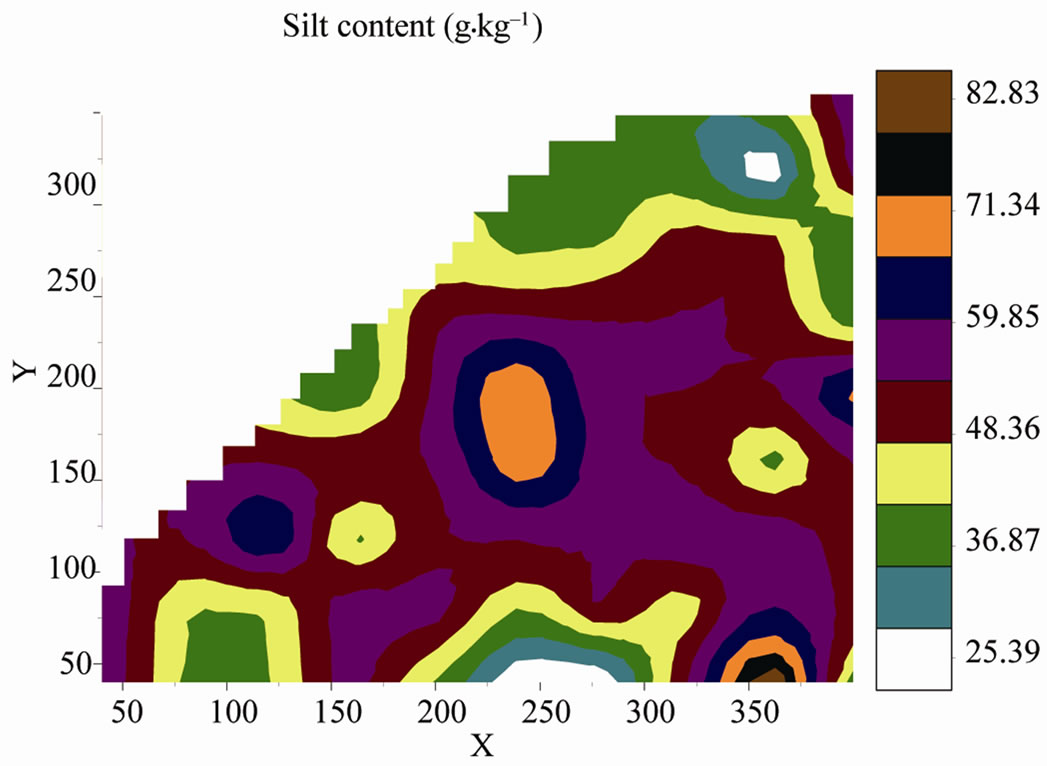
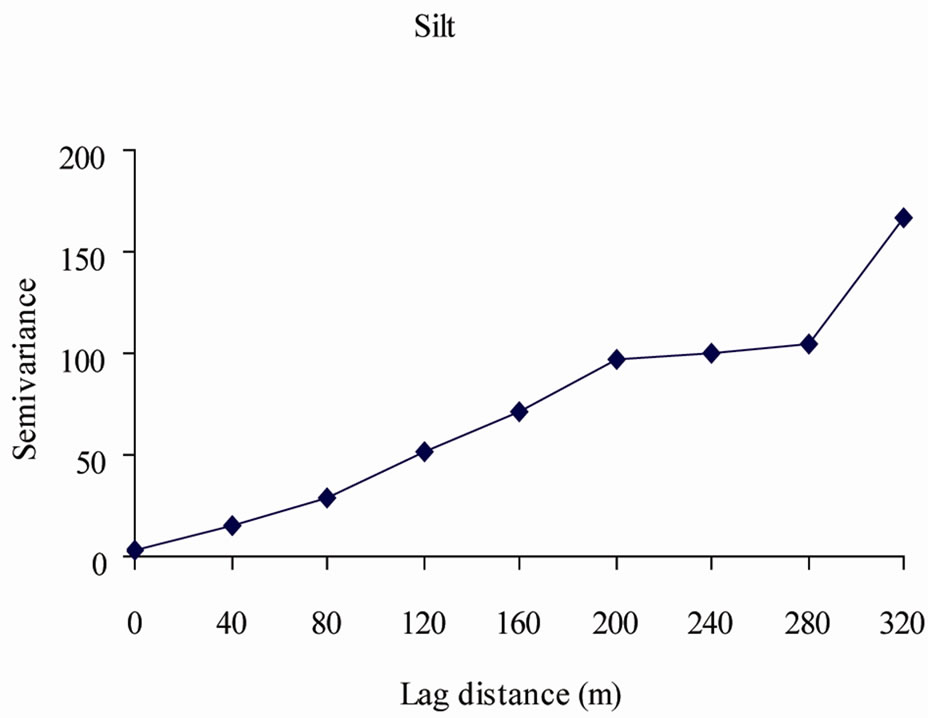
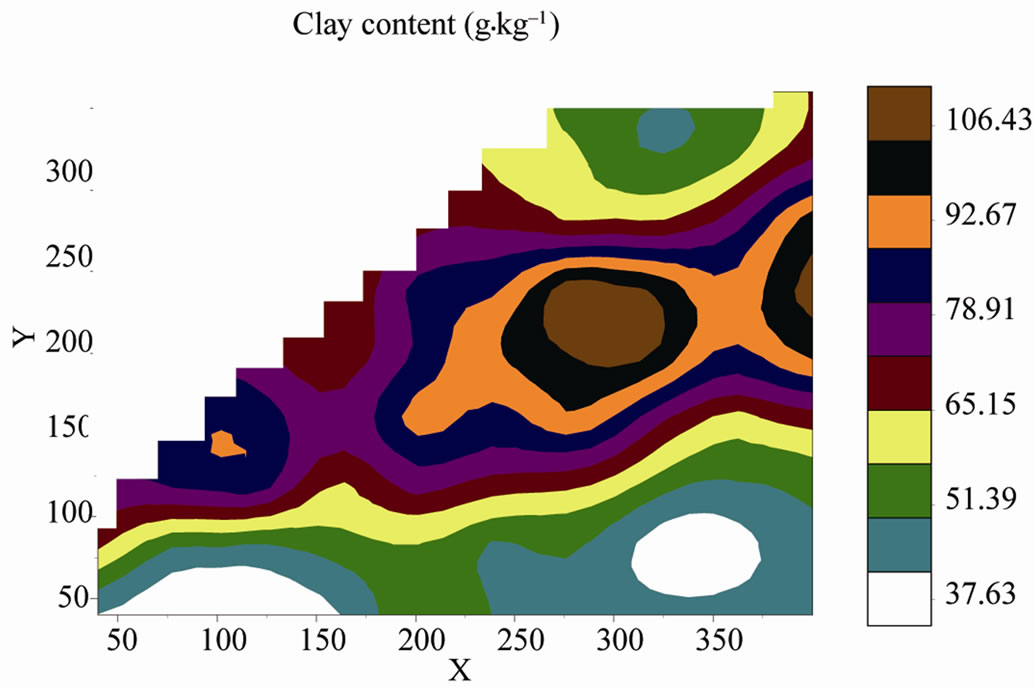
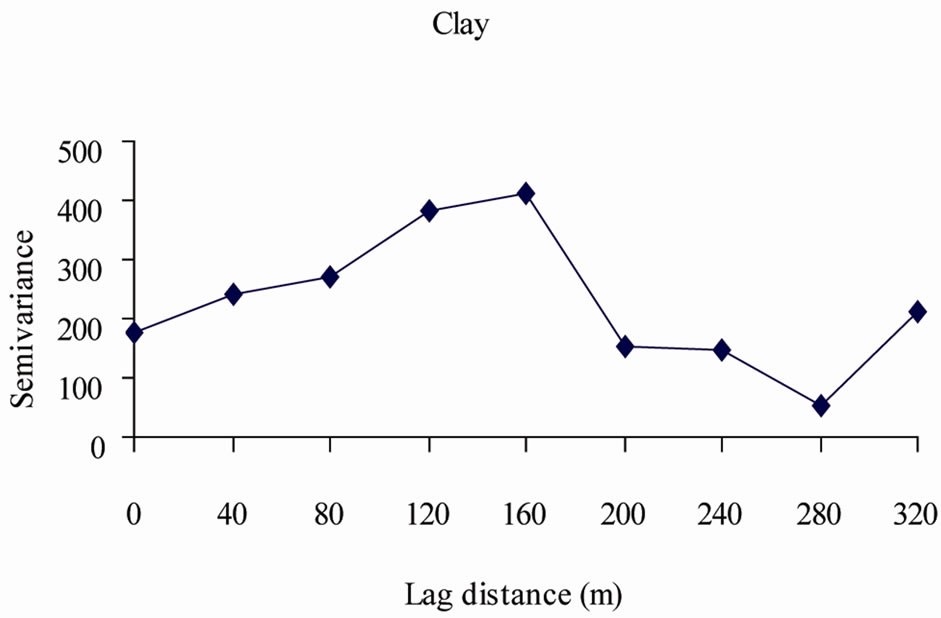
Figure 3. Semivariograms and contour maps of sand, silt and clay contents of the coastal plain sands soils.
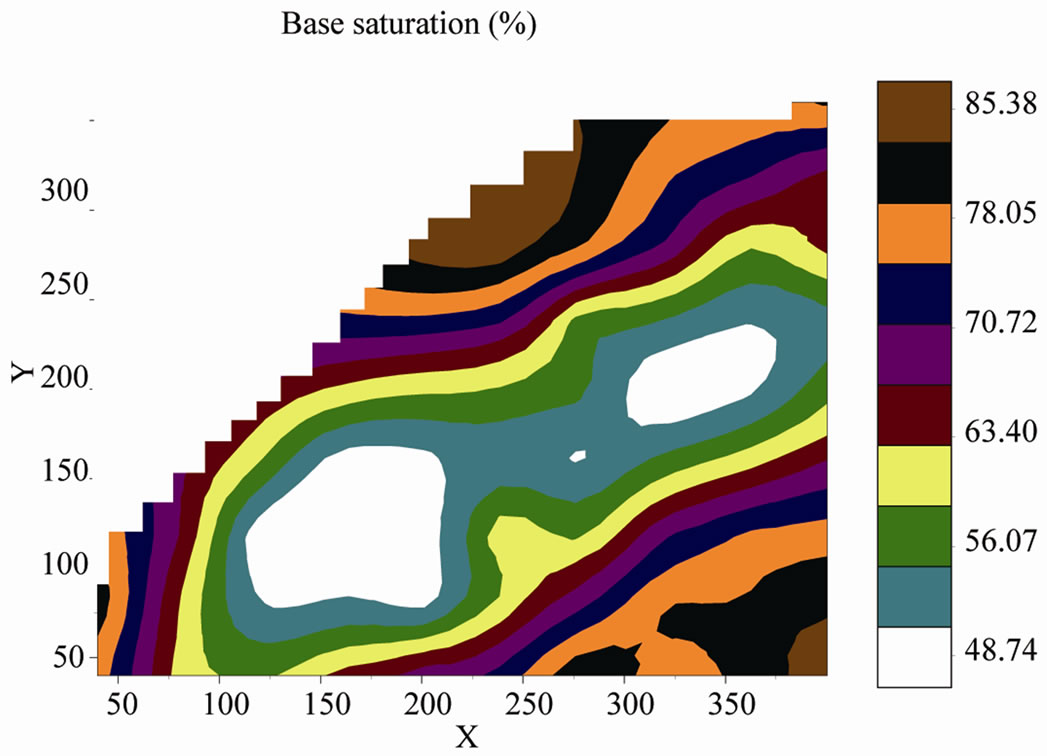
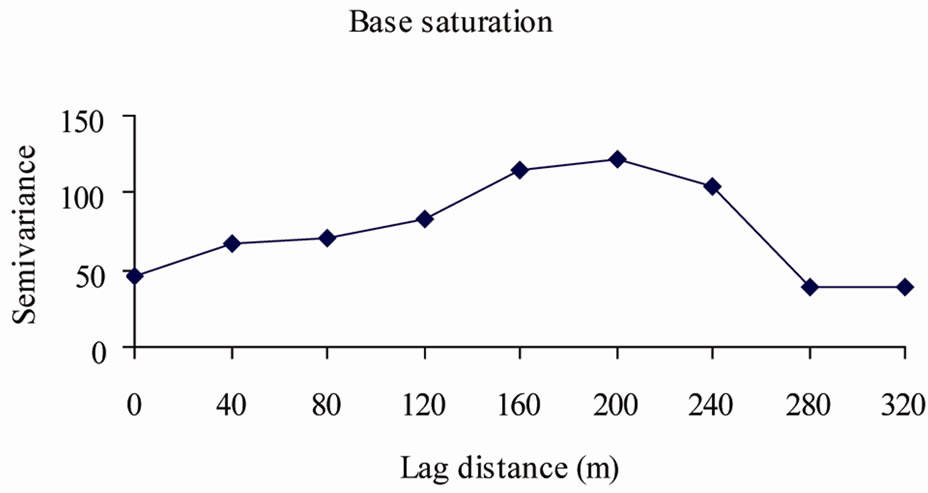
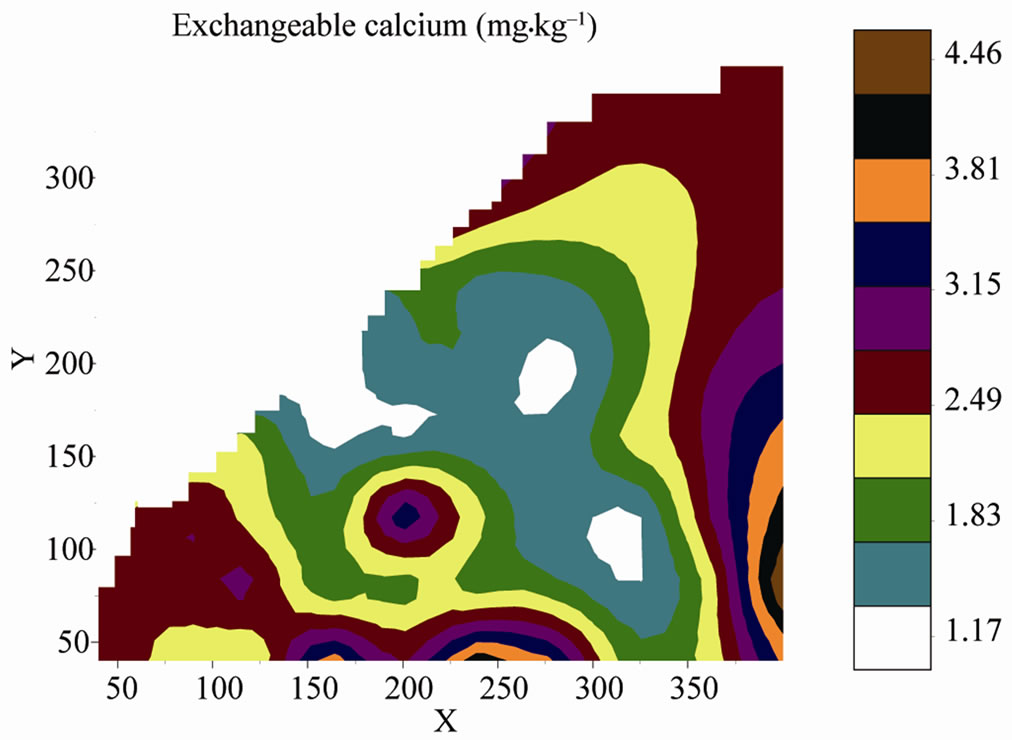
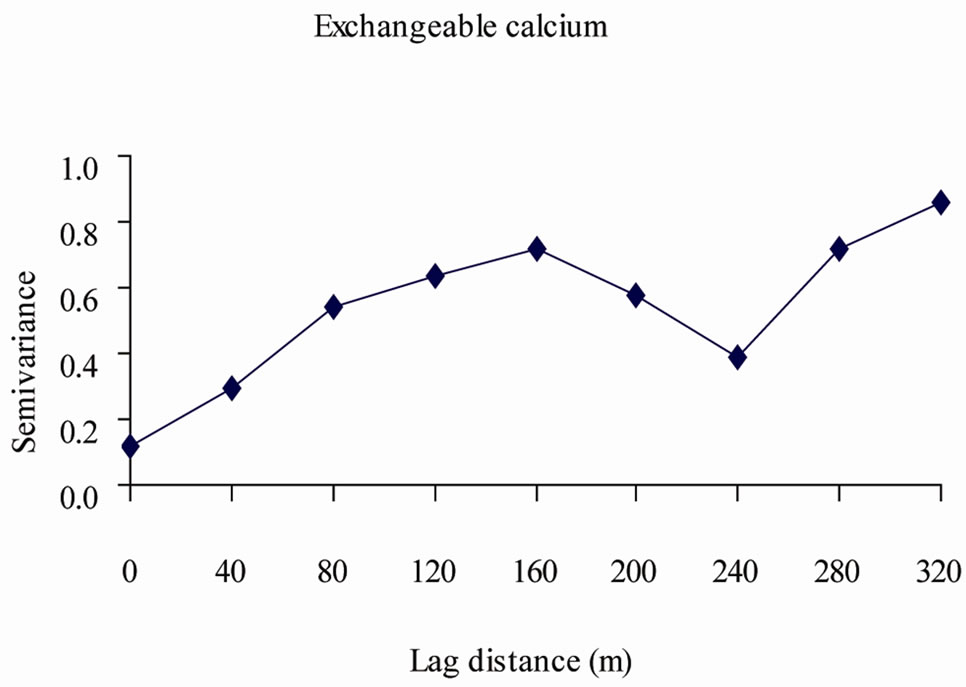
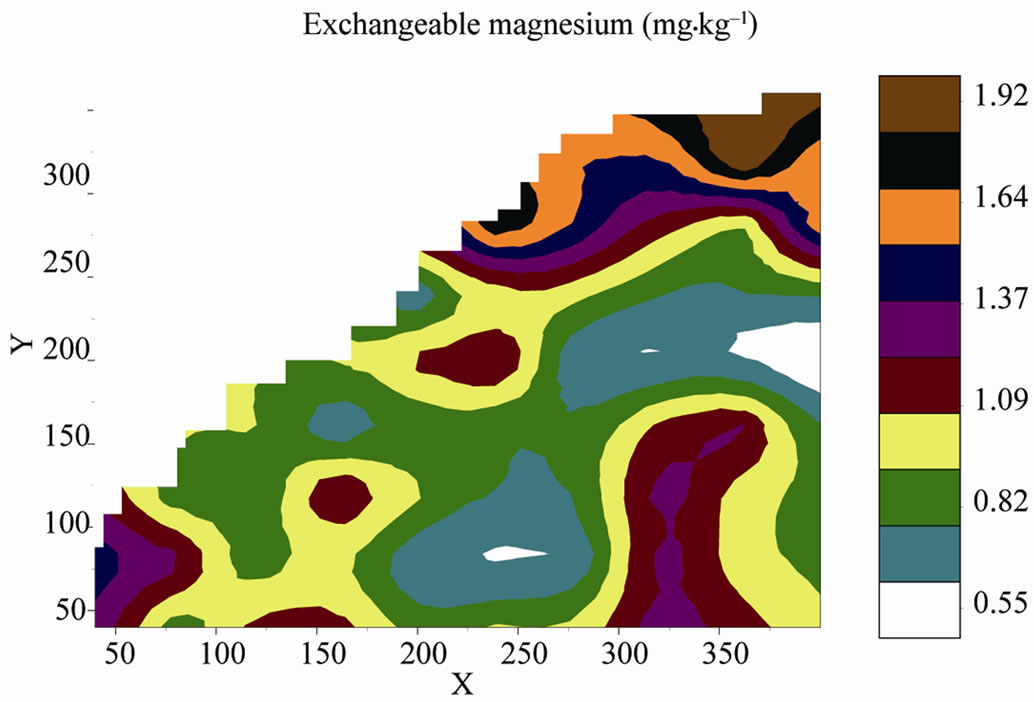
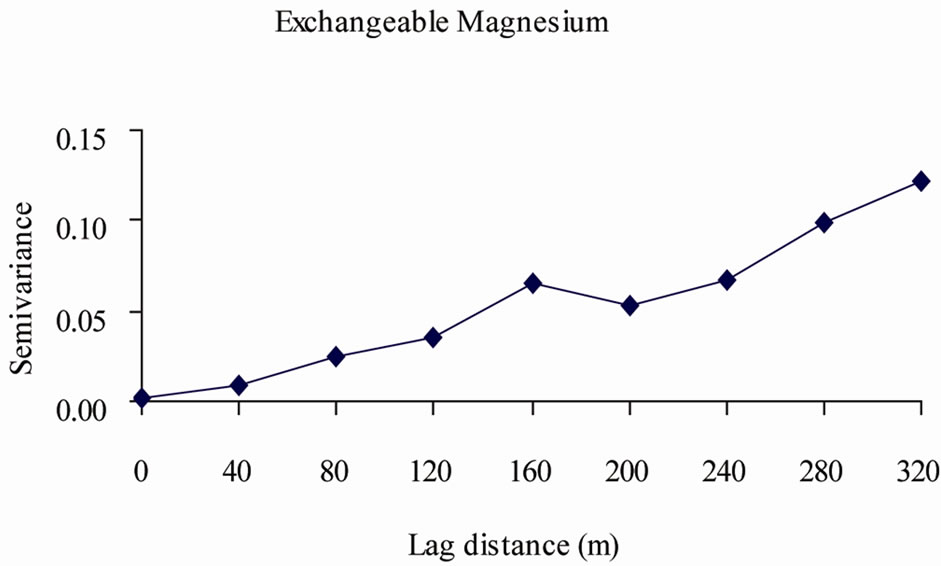
Figure 4. Semivariograms and contour maps of base saturation, exchangeable calcium and magnesium of the coastal plain sands soils.
ble 4 for the properties of coastal plain sands soils. Spatial ratio similar to those presented by Cambardella et al., [23] to define distinctive classes of spatial dependence was adopted in the study. The classes were obtained by the ratio of the nugget to sill. If the ratio was <25%, between 25% and 75% or >75%, the variable was considered strongly, moderately or weakly spatially dependent respectively. The resulting semivariograms indicated the
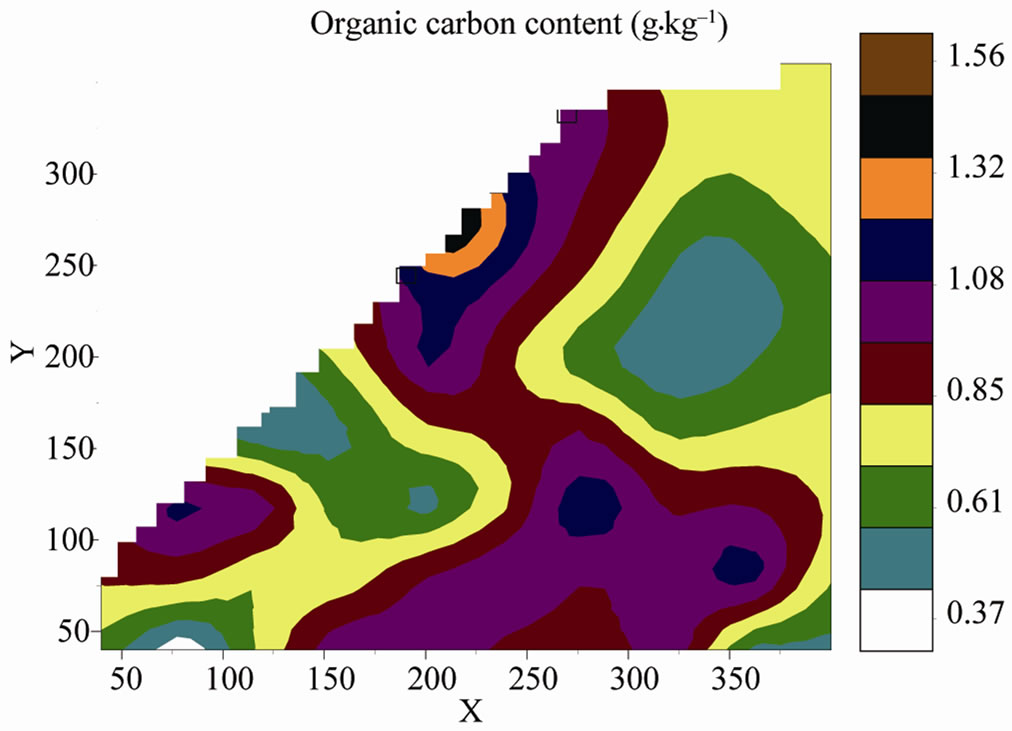
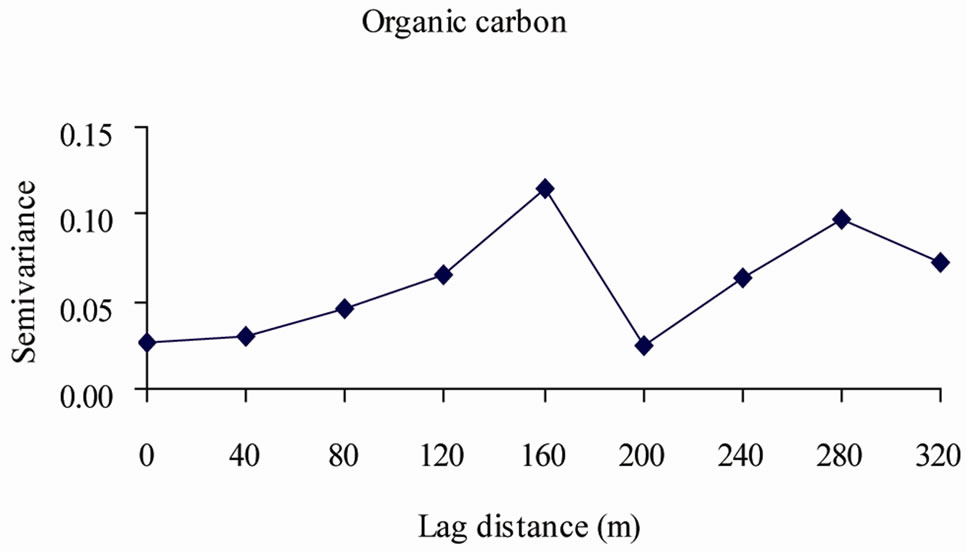
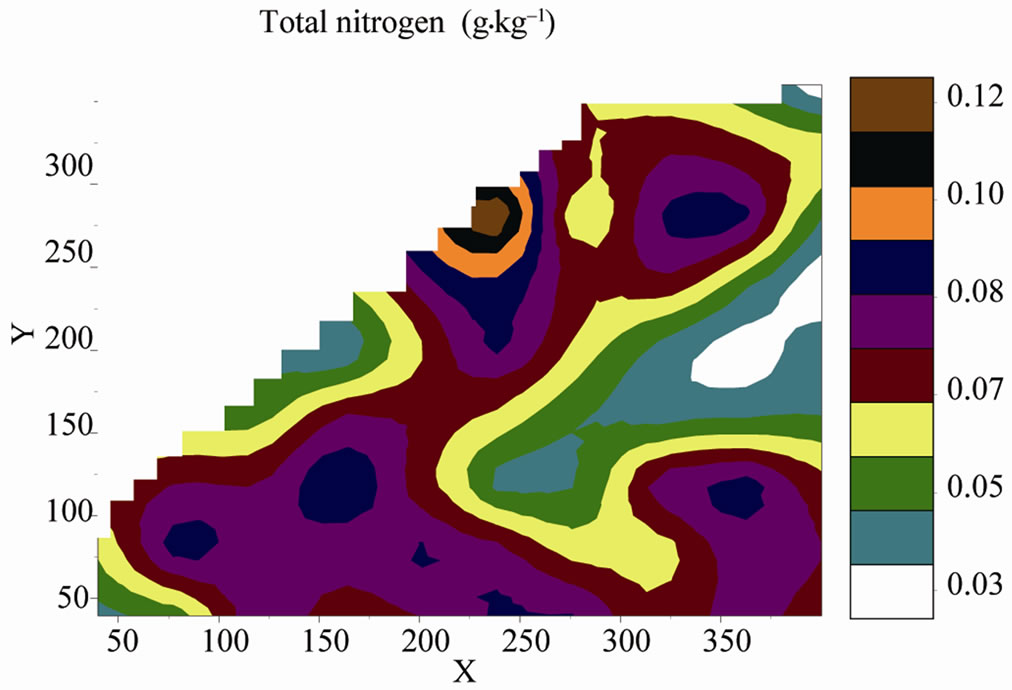
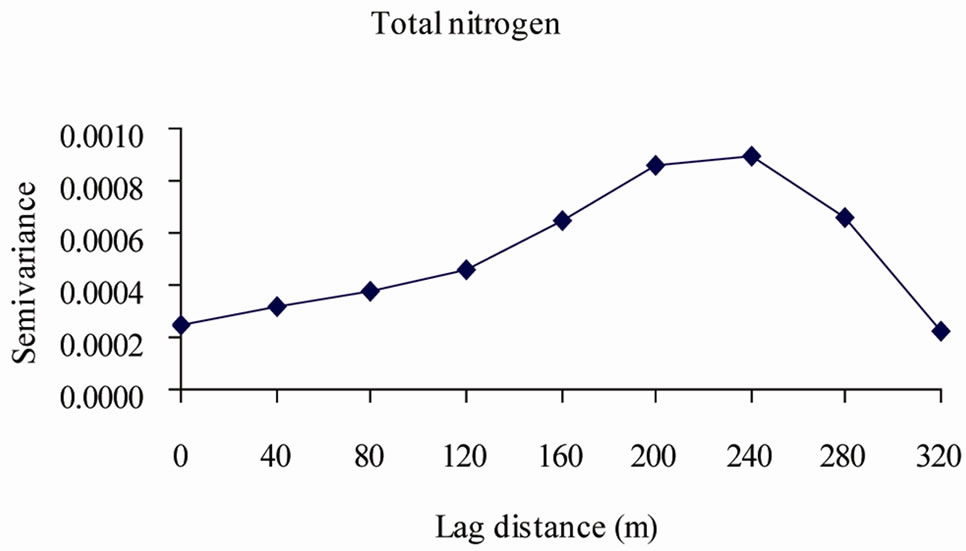
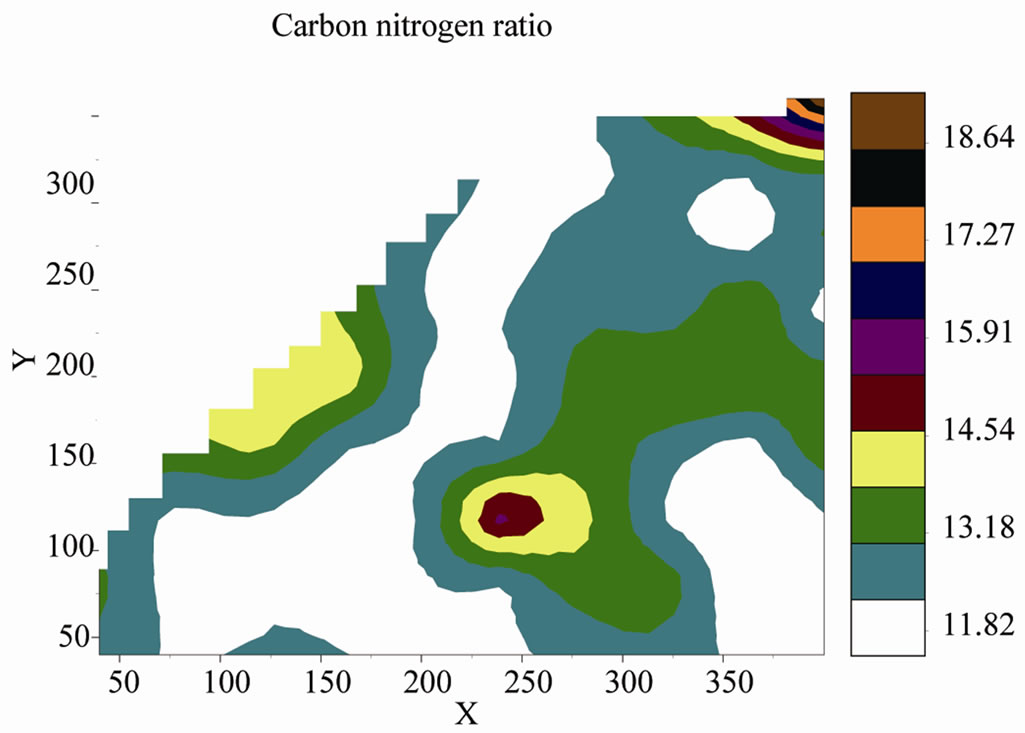
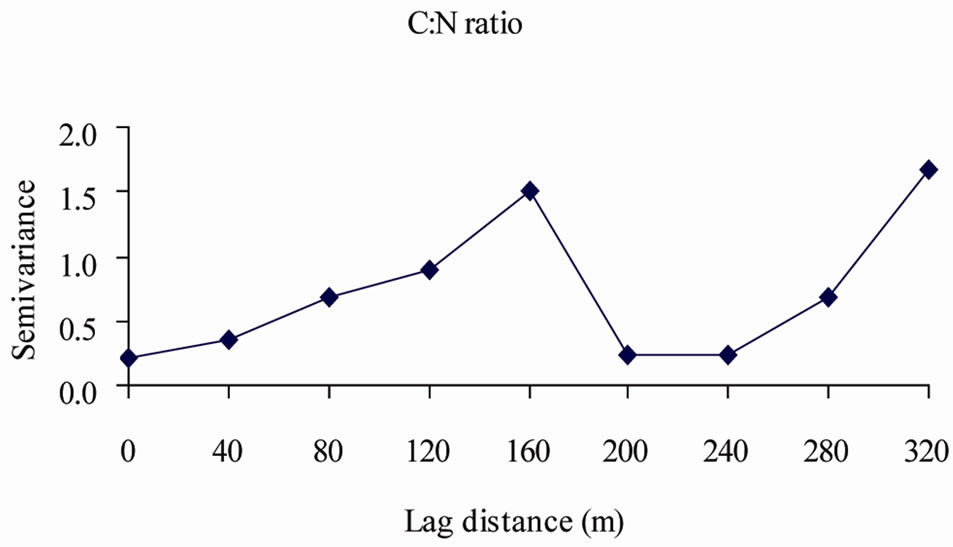
Figure 5. Semivariograms and contour maps of organic carbon, total nitrogen contents and carbon nitrogen ratio of the coastal plain sands soils.
existence of moderate to strong spatial dependence for the soil properties (Table 4). With the exception of sand and clay contents, ECEC, BS and total N that were moderately (range of spatial dependence between 25.7% and 47.3%), others were strongly spatially dependent. The strongly spatially dependent variables include silt content, pH, organic carbon, CNR, avail. phosphorus exchangeable Ca, Mg, Na and acidity (ranging between 0.18% and 22.8%). Strong to moderate spatial dependence had been attributed to intrinsic variation controlled by factors of
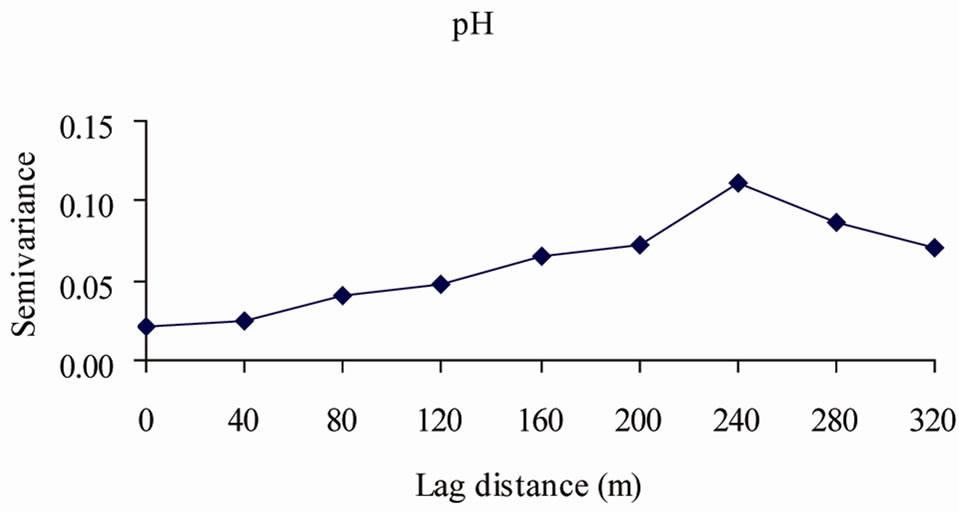
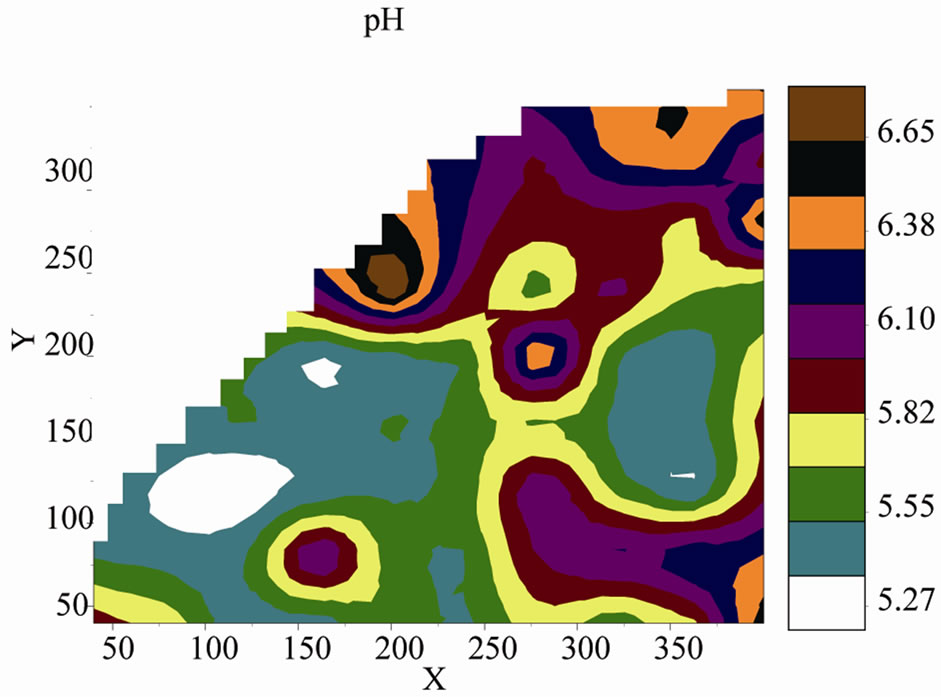
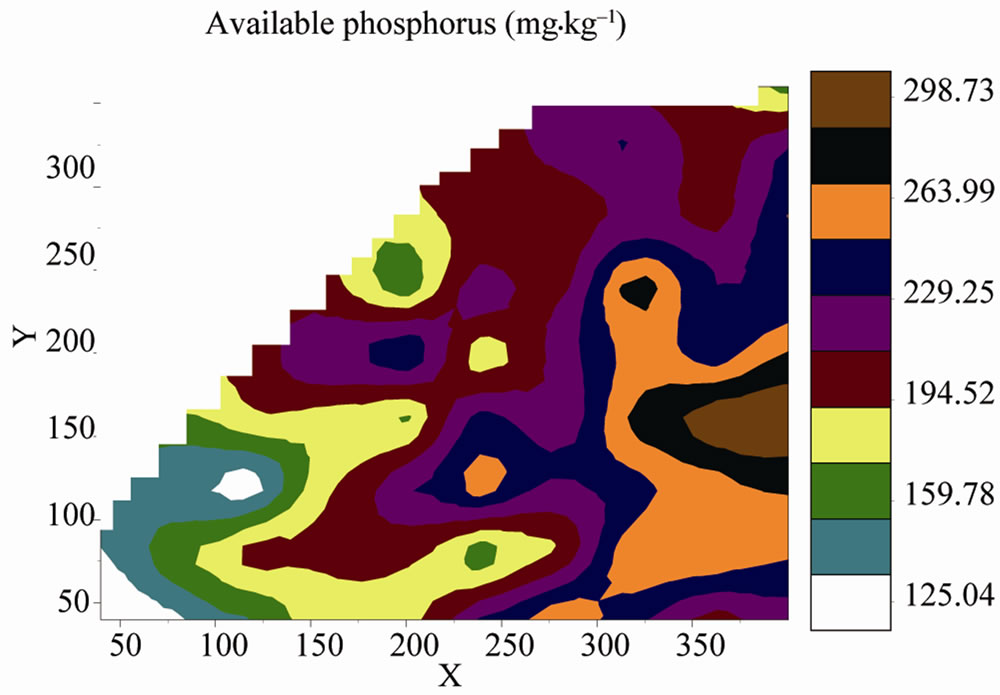
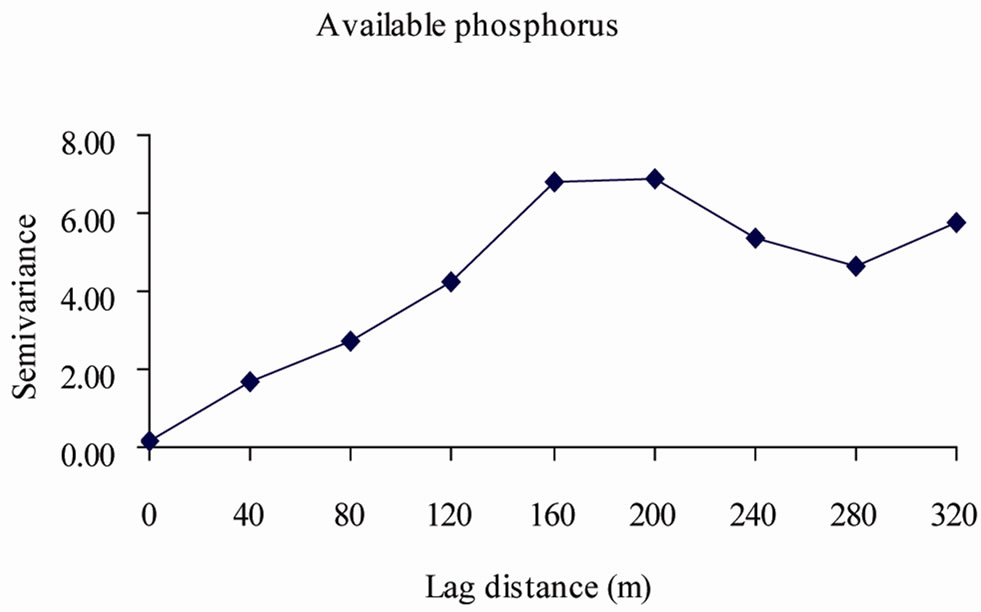
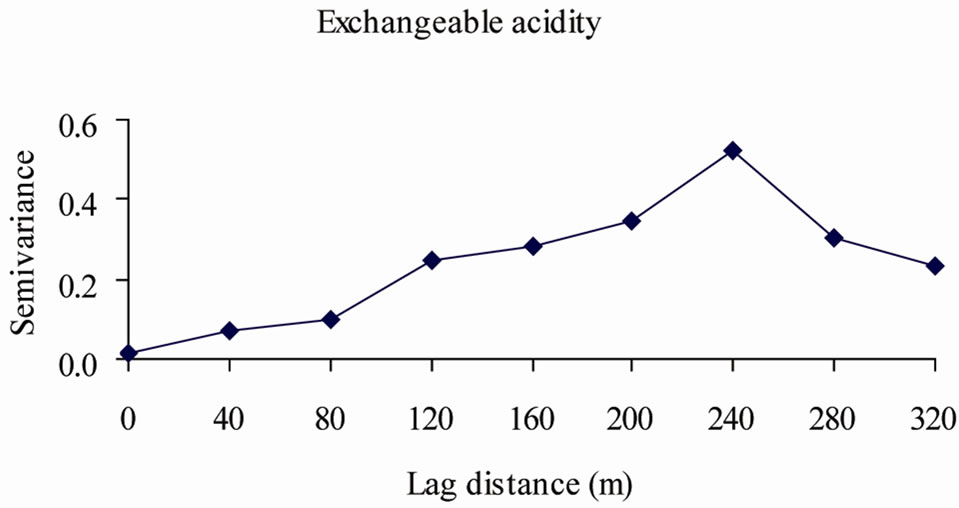
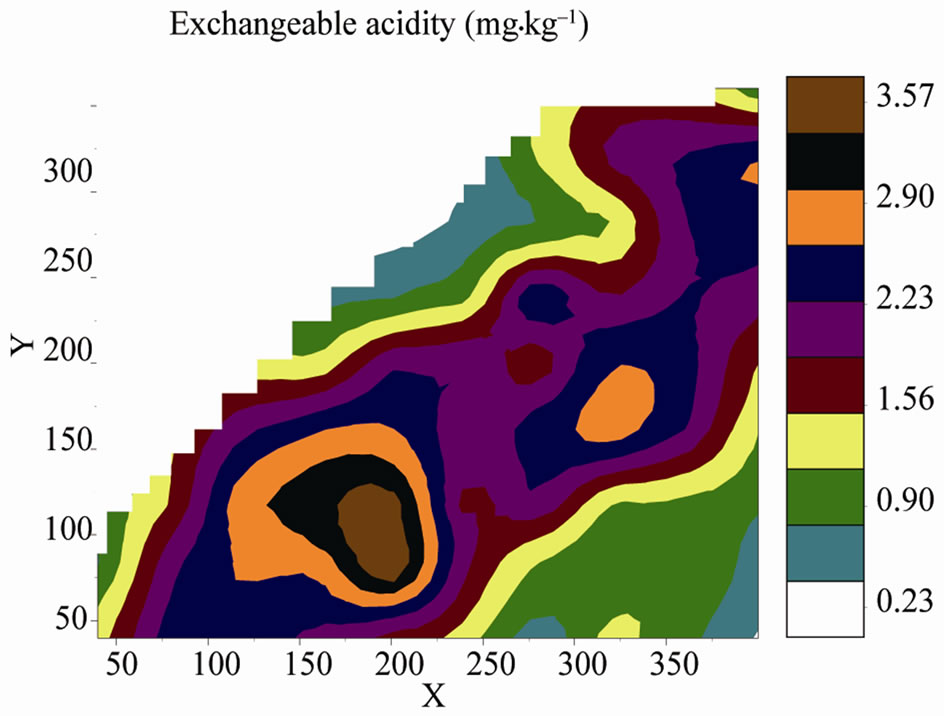
Figure 6. Semivariograms and contour maps of pH, available phosphorus and exchangeable acidity of the coastal plain sands soils.
soil formation and particularly associated with texture and mineralogy. Moderate to weak spatial dependence were reported to be as a result of management related activities such as fertilizer application, tillage and land use [5,6,23,27,35,44,45]. Further confirmation of strong to moderate spatial dependence of soil properties was with the use of minimum R value of 0.70. (Table 3) as was utilized in Duffera et al. [8].
It was observed that strong to moderate spatial dependence observed in the study area could be largely attributed to intrinsic variation resulting from pedogensis rather than management or land use related events (ex-
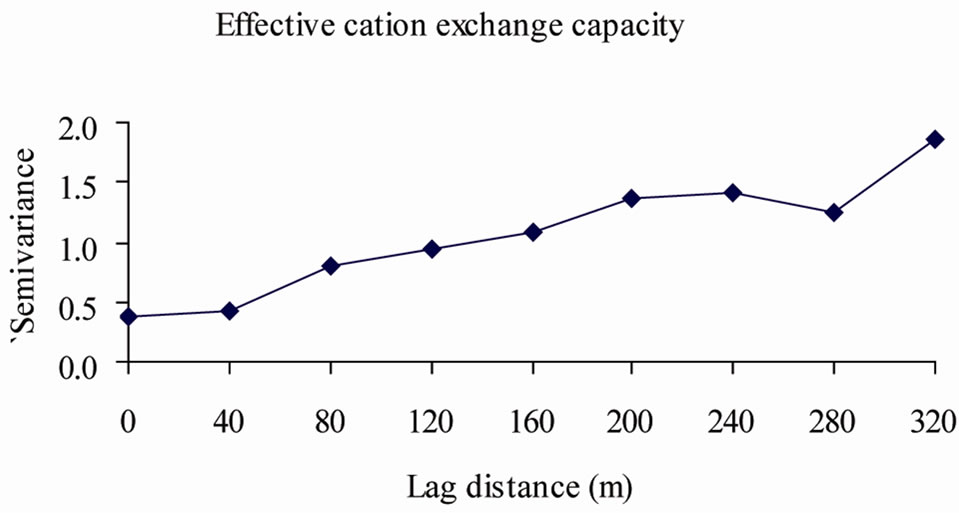
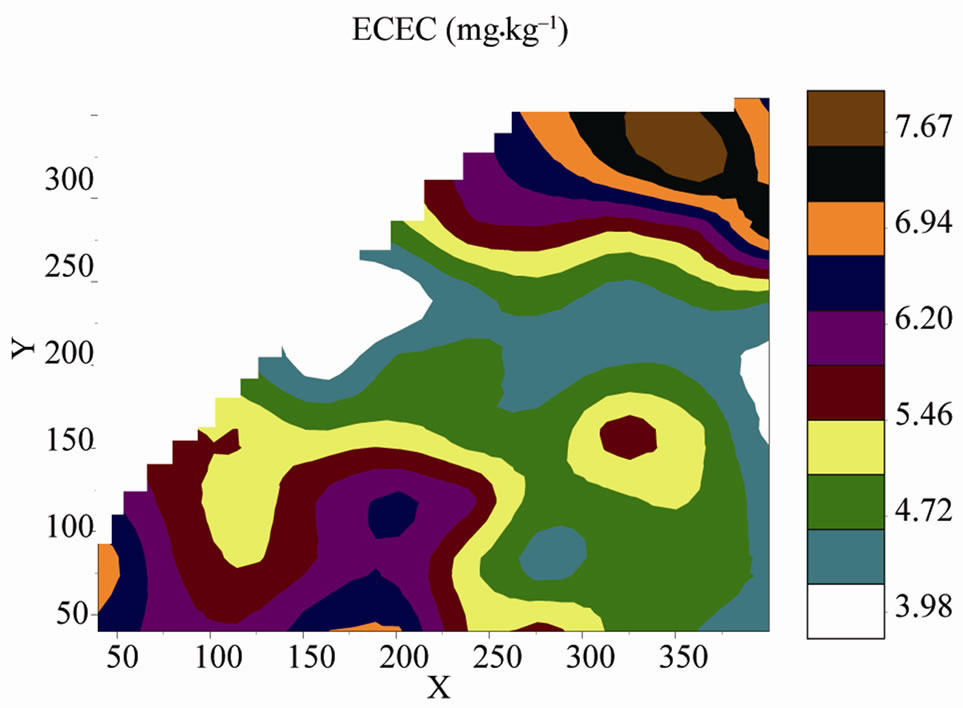
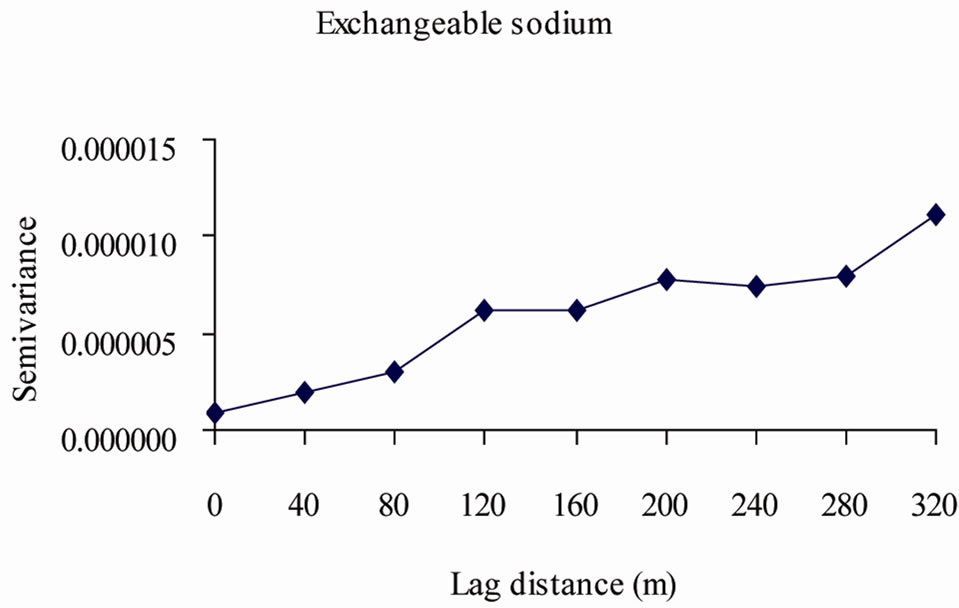
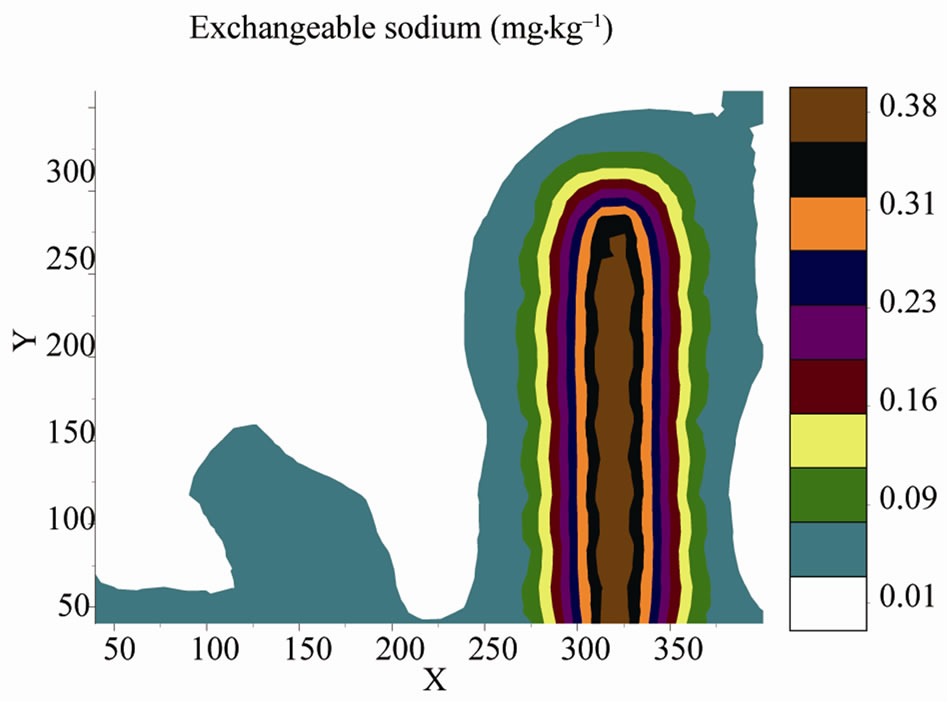
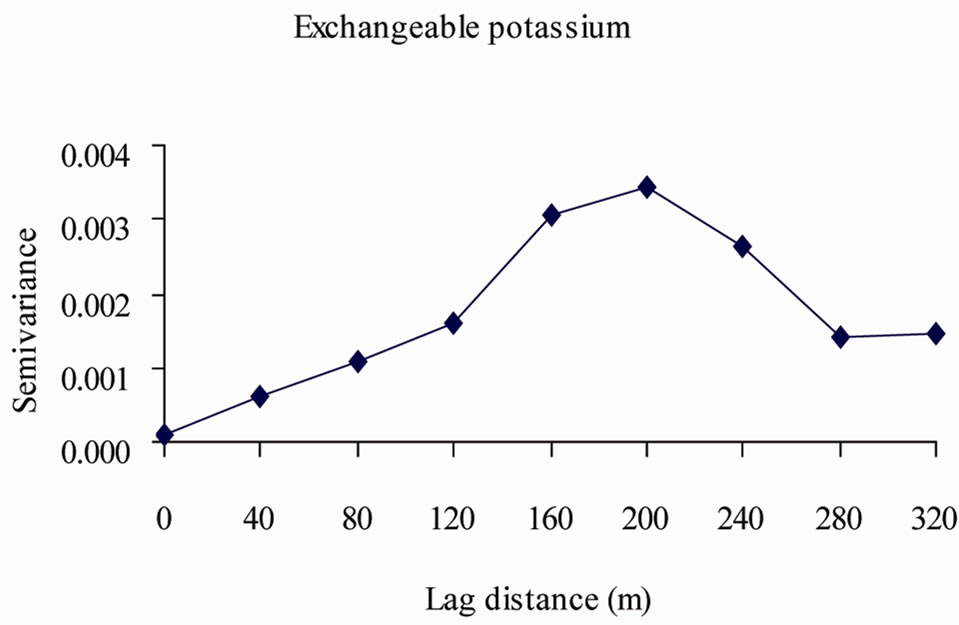
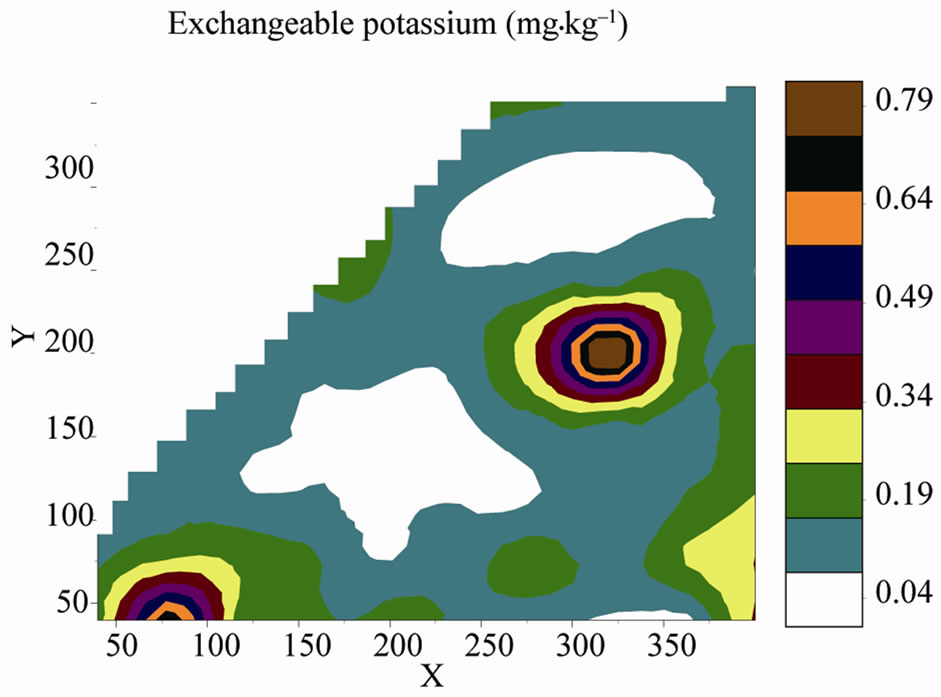
Figure 7. Semivariograms and contour maps of effective cation exchange capacity (ECEC), exchangeable calcium and potassium contents of the coastal plain sands soils.
trinsic). It could be inferred that the three land use systems (i.e. fallow, grazing and vegetable production) did not have pronounce influence on the soil properties. These were more so that the vegetable production was with the aid of simple hand implement used for pulverizations of the soil and raised bed preparation, with light application of organic (poultry droppings) amendment. This intrinsic variation observed was supported by principal component analysis that indicated that pedogenetic processes are the most important factors responsible for the variation of soil properties in the study area. Additionally, it had been previously reported that the influ-
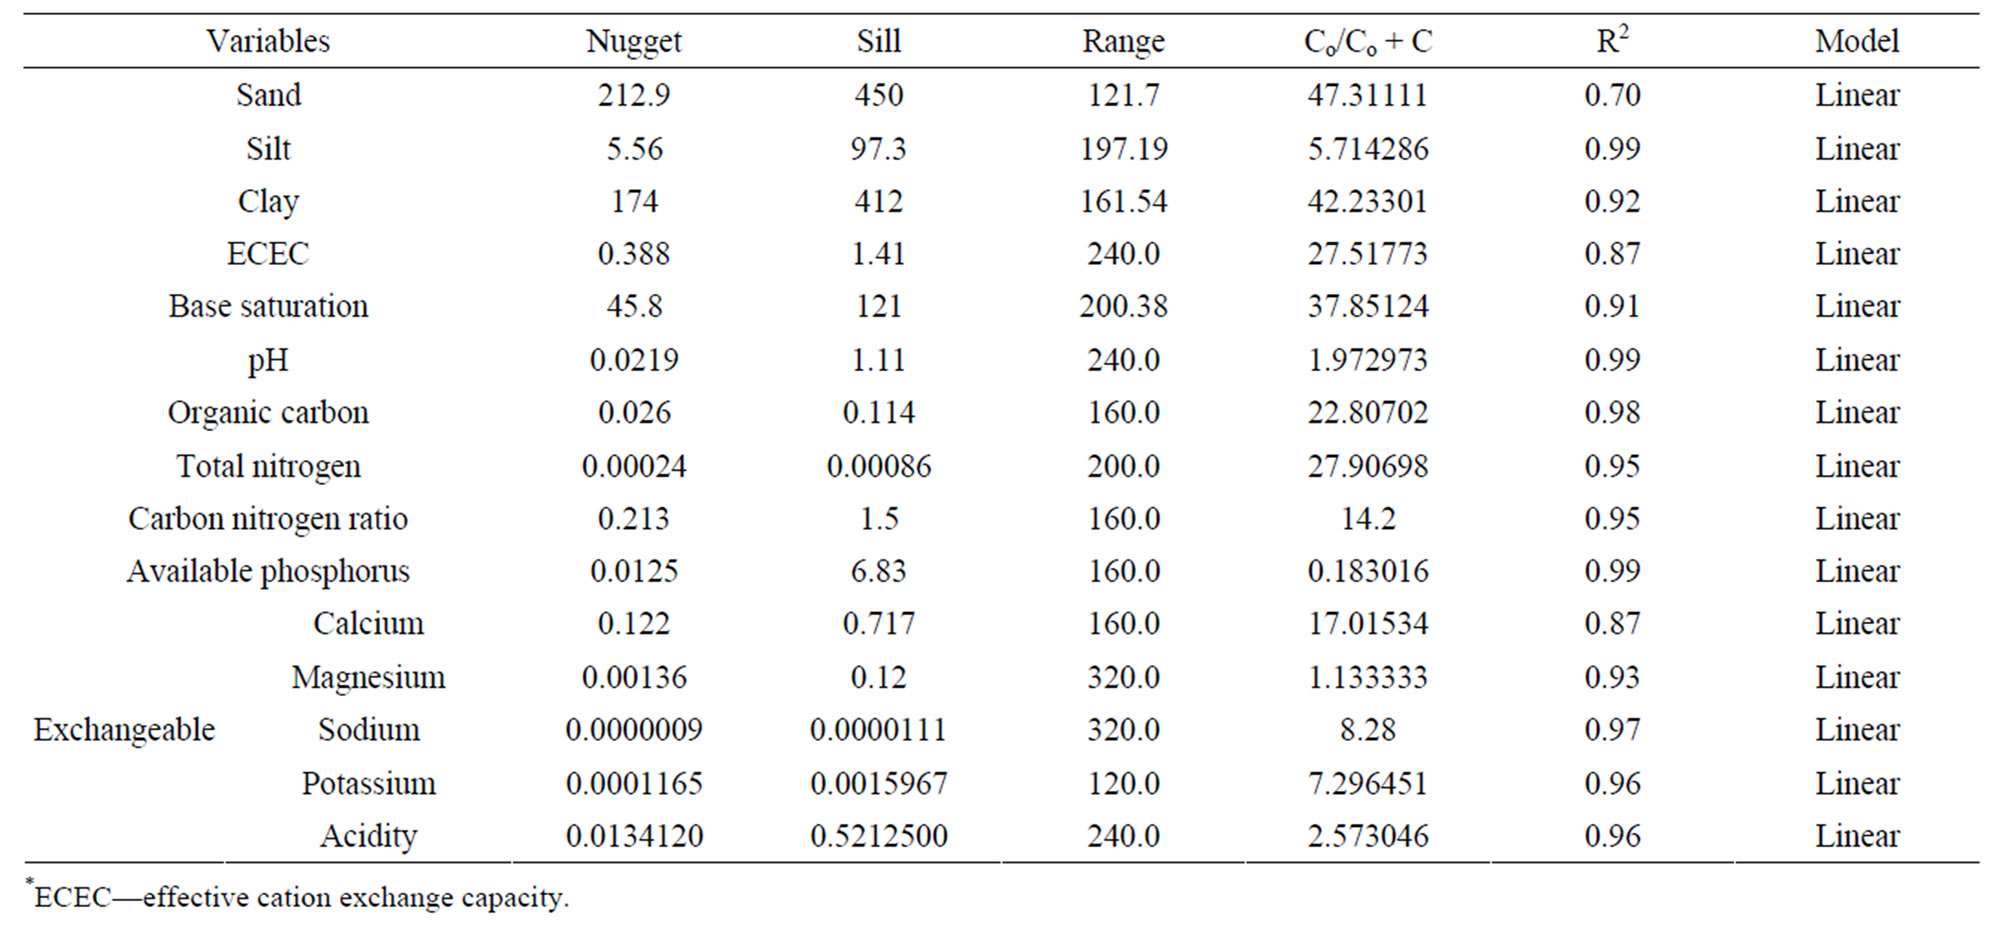
Table 4. Semivariogram statistics of properties of coastal plain sands soils of southeastern Nigeria.
ence of soil physical properties demanded more research attention in the study and management of properties of coastal plain sands (referred to as mineral) soils, because they are low in organic matter, clay, silt and moderately (pH range of > 5.0 ≤ 7.0) acidic [9-11]. These properties are soil components known to contribute to CEC [43] of which those of coastal plain sands soils are pH dependent because they are dominantly mineral soils [19]. The range of spatial dependence of the soil properties varied between 121.7 and 320 m (Table 4). Sodium and magnesium had 320 m each, which approximates the maximum sampling distance for data used in spatial analysis, while sand content had 121.7 m as the distance beyond which there was no spatial dependence.
3.4. Spatial Prediction of Soil Properties
The contours of particle size distribution were different from each other with sand more similar to clay than silt. This observation may be connected with the fact that there was highly significant (r = 0.85, p < 0.01) correlation between sand and clay contents of the soil. The major part of the contour map (Figure 3) was dominated by values ≥ 850 ≤ 900 g·kg–1, but the values between 850 and 860 g·kg–1 occupied a minimal area (sand), ≥ 42.0 ≤ 54.0 g·kg–1 (silt) and ≥ 51.0 ≤ 93.0 g·kg–1 (clay). The organic carbon, total nitrogen and carbon nitrogen ratio (Figure 5) were within the ranges of ≥ 0.7 ≤ 1.1 mg·kg–1, 0.1 mg·kg–1 and ≥ 12.5 ≤ 14.0 respectively. Base saturation, exchangeable calcium and magnesium (Figure 4) were dominantly ≥ 52.0% ≤ 74.0%, ≥ 1.5 ≤ 2.8 mg·kg–1 and ≥ 0.7 ≤ 1.2 mg·kg–1 respectively. High concentration of Ca and Mg were observed within the same vicinities of the study site corresponding to vegetable production and fallow, probably because of amendments and regeneration respectively. The ECEC, Na and K (Figure 7) were dominantly > 3.0 < 6.9 mg·kg–1, ≥ 0.01 ≤ 0.3 mg·kg–1 and > 0.04 < 0.3 mg·kg–1 respectively. The distribution of the values of ECEC bears comparable relationship with Ca and Mg while Na and K were different, but Na actually concentrated in the fallow area. The concentrations of Na and K were low in the soil and this is an expectation from soils formed from coastal plain sands parent material (Ogban and Ekerette, 2001). The available phosphorus, pH and exchangeable acidity (Figure 6) were dominantly ≥ 194.0 ≤ 264.0 mg·kg–1, ≥ 5.4 ≤ 5.8 and ≥ 1.6 ≤ 2.2 mg·kg–1 respectively and none of these distributions could be explained by the land use or soil management activities. It could be assumed that the factor groups including mineralogical or weathering, soil organic matter, cation exchange activity, soil texture, and dispersion and soil phosphorus factors could be applied to the contour maps in such a manner that any member of the groups could be representative for site-specific management technologies.
3.5. Implications for Agricultural Production
The variability of soil properties observed on the coastal pain sands parent material of southeastern Nigeria is largely not due to other sources but soil formation. Within a single field dimension, major causes of variability is restricted to factors associated with depositional/erosional processes and faunal (termites and earthworm) activities. One of the requirements for increased crop production is the knowledge of extent of spatial variability and spatial structure of soil properties. This knowledge will be useful in the execution of sitespecific management which has been found to be indispensible for large scale intensive crop production. The soils of coastal plain sands dominated by particles greater than 0.02 mm, kaolinitic and low in organic matter are not resilient and therefore demands integrated crop management scheme for sustainable production. This is indicative that components two and four comprising organic matter factor and texture factor should be properly understood and managed. Emphasis will be fractions greater than 0.02 mm for water and organic matter for nutrients management. Then, the understanding of their spatial structure and prediction of unsampled location may facilitate management and enhance production.
4. Conclusions
The classical and geostatistical methods revealed the variability and spatial structure of the soil properties. Outliers did not influence the measure of central tendency, sand, base saturation (BS), organic carbon, total nitrogen, available phosphorus and exchangeable acidity were normally distributed. Coefficient of variation indicated that 26.6%, 40.1% and 33.3% of the soil properties were least, moderately and highly variable respectively. The observed significant correlation facilitated discrimination of soil properties into mineralogical or weathering, soil organic matter, cation exchange activity, soil texture, and dispersion and soil phosphorus factors. The strongly spatially dependent soil properties include silt content, pH, organic carbon, CNR, available phosphorus, exchangeable calcium, magnesium, sodium and acidity, whereas sand and clay contents, ECEC, BS and total N were moderately spatially dependent. The observed variation in soil properties could be attributed to intrinsic variation controlled by factors of soil formation and particularly associated with texture and mineralogy. Specifically, it was observed that water and nutrient management could be improved as their (i.e. organic matter and texture factors) variability and spatial structure could be predicted for utilization at the planning stage of crop production process.
REFERENCES
- P. C. Robert, R. H. Rust and W. E. Larson, “Precision Agriculture, Proceeding International Congress, 3rd Agronomy Society of America and Soil Science Society of America,” Madison Wisconsin, Madison, 1996.
- T. R. Green, T. Makoto and H. Kooi, “Potential Impact of Climate Change and Human Activities on Surface Water Resources,” Vadose Zone Journal, Vol. 6, No. 3, 2007, pp. 531-532. doi:10.2136/vzj2007.0098
- J. D. Phillips, “Development of Texture Contrast Soils by a Combination of Bioturbation and Translocation,” Catena, Vol. 70, No. 1, 2007, pp. 92-104. doi:10.1016/j.catena.2006.08.002
- D. R. Neilsen, Wendrothe and M. B. Parlandge, “Opportunities for Examining on-Farm Soil Variability: In Site Specific Management for Agricultural Systems, Agronomy Society of America and Soil Science Society of America,” Madison Wisconsin, Madison, 1995, p. 152.
- M. K. Shukla, B. K. Slater, R. Lal and P. Cepuder, “Spatial Variability of Soil Properties and Potential Management Classification of a Chernozemic Field in Lower Austria,” Soil Science, Vol. 169, 2004, pp. 852-860. doi:10.1097/00010694-200412000-00004
- J. C. Obi and A. O. Ogunkunle, “Influence of Termite Infestation on the Spatial Variability of Soil Properties in the Guinea Savanna Region of Nigeria,” Geoderma, Vol. 148, No. 3-4, 2009, pp. 357-368. doi:10.1016/j.geoderma.2008.11.003
- F. C. James and C. E. McCulloch, “Multivariate Analysis in Ecology and Systematic Panacea or Padora’S Box?” Annual Reviews Ecological System, Vol. 21, 1990, pp. 129-166. doi:10.1146/annurev.ecolsys.21.1.129
- M. Duffera, J. G. White and R. Weisz, “Spatial Variability of Southeastern US Coastal Plain Soil Physical Properties: Implication for Site Specific Management,” Geoderma, Vol. 137, No. 3-4, 2007, pp. 327-339. doi:10.1016/j.geoderma.2006.08.018
- A. G. Ojanuga, G. Lekwa and F. O. R. Akamigbo, “Survey, Classification and Genesis of Acid Sands, Acid sands of Southeastern Nigeria,” Soil Science Society, No. 1, 1981, pp. 1-7.
- G. E. K. Ofomata, “Actual and Potential Erosion in Nigeria and Measures for Control, Acid Sands of Southeastern Nigeria,” Soil Science Society, No. 1, 1981, pp. 151-165.
- P. I. Ogban and I. O. Ekerette, “Physical and Chemical roperties of the Coastal Plain Sands Soils of Southeastern Nigeria,” Nigerian Journal of Soil Research, Vol. 2, 2001, pp. 6-14.
- SLUS-AK, “Soils and Land Use Survey of Akwa Ibom,” Government Printers, Uyo, 1989, p. 603.
- G. W. Gee and J. W. Bauder, “Particle Size Analysis. p. 404-407,” Part 1., 2nd Edition, A. Klute (ed.) AgronMonogr Methods of Soil Analysis, Agronomy Society of America and Soil Science Society of America, Madison Wisconsin, Madison, No. 9, 1986.
- J. M. Bremner and C. S. Mulvaney, “Total nitrogen. Methods of Soil Analysis,” Part II, 2nd Edition. Page, A. I. Ed. Agronomy Monograph, Agronomy Society of America and Soil Science Society of America, Madison Wisconsin, No. 9, 1982, pp. 595-624.
- D. W. Nelson and I. E. Sommer, “Total Carbon, Organic Carbon and Organic Matter, Methods of Soil Analysis,” Part II, 2nd Edition. Page, A. I. Ed. Agronomy Monograph, Agronomy Society of America and Soil Science Society of America, Madison Wisconsin, Madison, No. 9, 1982, pp. 961-1010.
- E. O. McLean, “Soil pH and Lime Requirement,” Part II. A. L. Page (ed.), Methods of Soil Analysis ASA Monogr, Madison Wisconsin, Madison, No. 9, 1982, pp. 199-223.
- A. Mehlick, “Mehlick 3 Soil Test Extractant: A Modification of Mehlick 2,” Communications in Soil Science and Plant Analysis, Vol. 15, No. 12, 1984, pp. 1409-1416. doi:10.1080/00103628409367568
- J. M. Anderson and J. S. I. Ingram, “Tropical Soil Biology and Fertility,” A Handbook of Methods, 2nd Edition, CAB International, 1993. p. 221.
- Soil Survey Staff, “Keys to Soil Taxonomy,” 10th Edition, United States Department of Agriculture, Natural Resources Conservation Services, 2006, p. 331.
- S. S. Shapiro and M. B. Wilk, “An Analysis of Variance test for Normality,” Biometrika, Vol. 52, 1965, pp. 691- 710.
- SAS Institute, “SAS Systems for Information Delivery for Windows,” Release 6.12. SAS Institute, Cary, 1996.
- T. B. Parkin and J. A. Robinson, “Anslysis of Lognormal Data,” Advances in Soil Sciences, Vol. 20, 1992, pp. 193-325. doi:10.1007/978-1-4612-2930-8_4
- C. A. Cambardlla, T. B. Moorman, J. M. Novak, T. B. Parkin, D. L. Karlan, R. F. Turco and A. E. Konopka, “Field Scale Variability of Soil Properties in Central Iowa Soils,” Soil Science Society of American, Vol. 58, No. 5, 1994, pp. 1501-1511. doi:10.2136/sssaj1994.03615995005800050033x
- C. T. Haan, “Statistical Methods in Hydrology,” Iowa State University Press, Ames, 1997.
- R. A. Johnson and D. W. Wichern, “Applied Multivariate Statistical Analysis, Prentice Hall,” Eaglewood Cliffs, New Jersey, 1992.
- S. Sharma, “Applied Multivariate Techniques,” John Wiley and Sons, New York, 1996.
- B. B. Trangmar, R. S. Yost and G. Uehara, “Application of Geostatistics to Spatial Studies of Soil Properties,” Advances in Agronomy, Vol. 38, 1985, pp. 45-94. doi:10.1016/S0065-2113(08)60673-2
- T. C. Bailey and A. C. Gatrell, “Interactive Spatial Data Analysis,” Addison Wesley Longman, New York, 1998.
- A. B. McBratney and M. J. Pringle, “Estimating Average and Proportional Variograms of Soil Properties and Their Potential Use in Precision Agriculture,” Precision Agricul Ture, Vol. 1, No. 2, 1999, pp. 219-236. doi:10.1023/A:1009995404447
- S-Plus, “S-Plus SpatialStats User’s Manual for Windows and Unix,” Seattle, Washington, 1997.
- A. G. Journel and C. J. Huijbregts, “Mining Geostatistics,” Academic Press, London, 1978.
- P. Goovaerts, “Geostatistics for Natural Resources Evaluation,” Oxford University Press, New York, 1997.
- M. David, “Geostatistics Area Reserve Estimation,” Elsevier Science Publisher, Amsterdam, 1977.
- I. Clark, “Practical Geostatistic,” Applied Science Publisher, London, 1979.
- J. Iqbal, J. A. Thomasson, J. N. Jenkins, P. R. Owens and F. D. Whisler, “Spatial Variability Analysis of Soil Physical Properties of Alluvial Soils,” Soil Science Society of American, Vol. 69, No. 4, 2005, pp. 1338-1350. doi:10.2136/sssaj2004.0154
- M. K. Shukla, R. Lal and M. Ebinger, “Principal Component Analysis for Predicting Biomas and Corn Yield under Different Land Uses,” Soil Science, Vol. 169, 2004b, pp. 215-224. doi:10.1097/01.ss.0000122521.03492.eb
- L. P. Wilding, “Spatial Variability: Its Documentation, Accommodation, and Implication to Soil Surveys,” In D. R. Nielsen and J. Bouma (eds). Soil spatial Variability. Purdon, The Netherlands, Wageningen, 1985, pp. 166-194.
- T. O. Ibia, G. S. Effiong, P. I. Ogban and J. C. Obi, “Relationship between Phosphorus Forms and Parent Materials in Soils of Southeastern Nigeria,” Acta Agronomica Nigeriana, Vol. 8, No. 2, 2008, pp. 104-112.
- J. D. Shaw, E. C. S. Packee and C. L. Ping, “Growth of Balsam Poplar and Black Cottonwood in Alaska in Relation to Landform and Soil,” Canada Journal of Soil Resources, Vol. 31, 2001, pp. 1793-1804.
- R. L.Voortman, J. Brouwer and P. J. Albersen, “Characterization of Spatial Soil Variability and Its Effect on Millet Yield on Sudano-Sahelian Coversands in SW Niger,” Staff Working Paper,WP-02-02, Centre for World Food Studies, The Netherlands, 2002.
- O. O. M. Olatunji, A. O. Ogunkunle and A. O. Tabi, “Influence of Parent Material and Topography on Some Soil Properties in Southwestern Nigeria,” Nigerian Journal of Soil and Environmental Research, Vol. 7, 2007, pp. 1-6.
- E. G. Gregorich, M. R. Carter and B. H. Ellert, “Towards a Minimum Data Set to Assess Soil Organic Matter Quality in Agricultural Soils,” Cananda Journal of Soil Science, Vol. 74, No. 4, 1994, pp. 367-385. doi:10.4141/cjss94-051
- C. A. Seybold, R. B. Grossman and T. G. Reinsch, “Predicting Cation Exchange Capacity for Soil Survey Using Linear Model,” Soil Science Society of American Journal, Vol. 69, No. 3, 2005, pp. 856-853. doi:10.2136/sssaj2004.0026
- Z. M. Souza, J. M. Júnior and G. T. Pereira, “Spatial Variability of the Physical and Mineralogical Properties of the Soil from the Areas with Variation in Landscape Shapes,” Brazilian Archives Biology Technology, Vol. 52, No. 2, 2009, pp. 305-316. doi:10.1590/S1516-89132009000200007
- F. E. Botros, T. Harter, Y. S. Onsoy, A. Tuli and J. W. Hopmans, “Spatial Variability of Hydraulic Properties and Sediments Characteristics in a Deep Alluvial Unsaturated Zone,” Vadose Zone Journal, Vol. 8, 2009, pp. 276-289. doi:10.2136/vzj2008.0087