Open Journal of Modern Hydrology
Vol.4 No.2(2014), Article ID:44578,13 pages DOI:10.4236/ojmh.2014.42004
Channel Evolution of Sandy Reservoir Sediments Following Low-Head Dam Removal, Ottawa River, Northwestern Ohio, U.S.A.
Nathan Harris1,2, James E. Evans1*
1Department of Geology, Bowling Green State University, Bowling Green, USA
2Pennsylvania General Energy Company, Warren, USA
Email: *evansje@bgsu.edu
Copyright © 2014 by authors and Scientific Research Publishing Inc.
This work is licensed under the Creative Commons Attribution International License (CC BY).
http://creativecommons.org/licenses/by/4.0/


Received 1 March 2014; revised 24 March 2014; accepted 31 March 2014
ABSTRACT
Dozens of low-head dams are removed annually for reasons of obsolescence, financial liability, public safety, or as part of aquatic ecosystem restoration. Prior to removing a dam, hydrologic and sedimentologic studies are used to predict channel changes that would occur after the proposed dam removal. One commonly used predictive approach is a channel evolution model (CEM). However, most CEMs assume that the reservoir has trapped cohesive silts and muds. This study looks at the effects of low-head dam removal on a reservoir in filled with sand-rich sediment. The Secor Dam (2.5 m tall, 17 m wide) was constructed on the Ottawa River in northwestern Ohio (USA) during 1928 and was removed in 2007. High resolution channel cross-sections were measured at 17 locations prior to dam removal and re-measured every approximately 30 days for 6 months following the removal. Sediment sampling, sediment traps, substrate sampling, differential GPS tracking of channel bed forms and sediment coring were also used to characterize the channel sediment response to dam removal. Breaching of the dam produced a diffuse nickzone which was the width of the channel and about 10 m in length. One initial response was downstream migration of a sediment wave at rates up to 0.5 m/hr. The overall effect was erosion of the former reservoir to a distance of 150 m upstream of the former dam. Portions of the former reservoir were incised >1 m. Within the first 6 months after removal, approximately 800 m3 of sand had been mobilized from the former reservoir, transported downstream past the former dam, and had primarily in-filled pre-existing pools within a reach approximately 150 m downstream of the former dam. This behavior significantly differs from the predicted results of current CEMs which anticipate a first flush of suspended sediment and minor deposition of bed load materials in the channel downstream of the former dam.
Keywords
Dams; Reservoir Sediment; Dam Removals; Channel Evolution Model (CEM)

1. Introduction
1.1. Purpose
There are approximately 79,000 large dams in the United States [1] . The public image of dams as mostly large, relatively new, federally owned, hydro-electric projects in the western United States is incorrect. The reality is that most of dams in the United States are small, old, privately owned structures, many are economically obsolete (i.e., originally designed as mill dams), many are hazardous, and most are found in the eastern United States.
For example, in the state of Ohio there are 1597 dams listed in the National Inventory of Dams. Of these, 1086 (68%) are privately owned, 862 (54%) are less than 6-m tall, 375 (23%) are considered high hazard while 543 (34%) are considered significant hazard, and 655 (41%) were constructed prior to 1940 [1] . The public has become aware of the hazards of some of these dams following the spectacular failure of the IVEX dam in 1994 [2] [3] and also become aware of the estimate $300 million necessary to repair the most hazardous dams. In northern Ohio, dams have subsequently been removed to eliminate owner liability [4] [5] , to improve water quality [6] [7] , for habitat improvement [8] [9] , or for improved recreational opportunities [10] .
Prior to removing any dam, key questions or issues to be resolved are: 1) what are the properties and volume of sediment in the reservoir [11] ; 2) are there contaminated sediments in the reservoir [12] ; and 3) are there concerns about the hydrologic and sedimentologic responses to the removal, based upon predictive models. Each of these issues determines the cost and the potential collateral damage that a dam removal could cause. This paper will focus on this last issue.
In general, three different types of predictive models are used. The first type involves modeling the released sediment as the translation of a sediment wave [8] [13] [14] . The second type involves mechanical dispersion models of the decay of the in situ sediment pile [11] [15] -[17] . The third type involves the use of geomorphic models, called channel evolution models or CEMs [3] [18] -[20] . Each of the approaches listed above offer advantages and disadvantages, being chiefly determined by the difficulty of predicting which processes will dominate during the highly transient, disequilibrium conditions that follow any particular dam removal. This paper will focus on channel evolution models.
An additional concern about channel evolution models is that most are based on the assumption that the downstream end of the reservoir consists of cohesive sediments, such as silts and clays. In a dam removal scenario, the cohesive strength of these materials affects the initial drawdown response, characteristics of the network of incised channels that form, the creation of a nickpoint, and the subsequent nickpoint migration. After formation, the nickpoint retreats upstream across the former reservoir sediment surface, until it reaches non-cohesive sediments at the upstream end. These coarse-grained sediments represent the former delta that formed during the life history of the reservoir. At this location, the nickpoint either stalls out or becomes a broader “nickzone” [3] .
The purpose of this paper is to examine the channel evolution of a sand-rich reservoir. Such situations are poorly described in the literature, but are probably fairly typical in run-of-river dams or weirs on rivers with significant bedload.
1.2. Background
The Ottawa River is a low-gradient, 446 km2 watershed in northwestern Ohio and southeastern Michigan (Figure 1). The upper drainage basin is predominantly agricultural, and the lower 40 km is urban and suburban, flowing through the city of Toledo, Ohio and into Lake Erie (one of the Laurentian Great Lakes of North America).
Hydrologic data about the Ottawa River is available from a U.S. Geological Survey gage station at river kilometer 17.3 (RK 17.3). There are continuous stage-discharge records from 1945-1948 and from 1977-present (Figure 2). The mean daily flow for this interval is 5.3 m3∙sec−1 and discharge for 10, 25, 50, and 100-year flows

Figure 1. Location map of the Secor Dam in NW Ohio and location of surveyed cross sections.
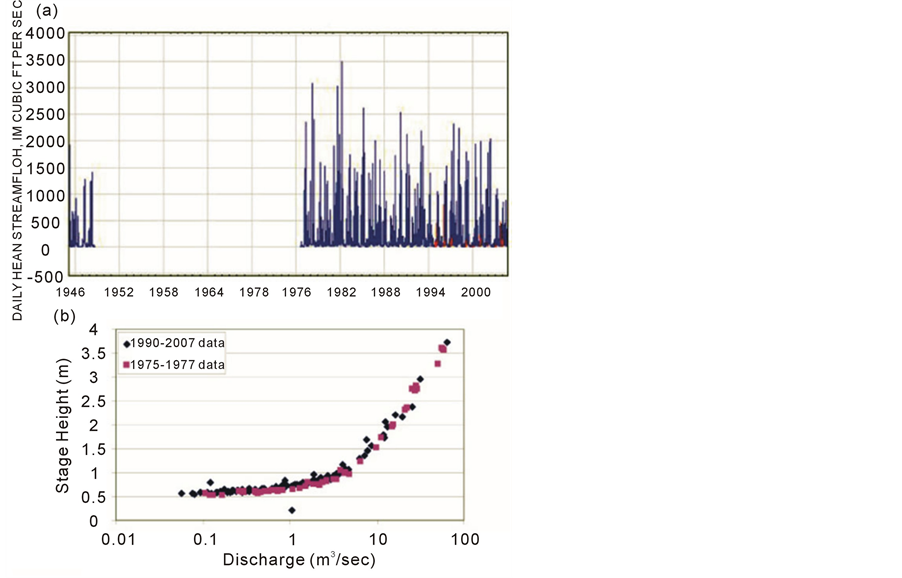
Figure 2. Hydrologic data for the Ottawa River. (a) annual hydrograph data from USGS Gage Station 04177000. (b) stage-discharge relationship for the Ottawa River from two data sets.
have been calculated as 91, 127, 170, and 219 m3∙s−1, respectively [21] . The Ottawa River is characterized by “flashy” discharges (low base flows, high peak flows, and a short lag-to-peak) which are often characteristic of agricultural and urbanized drainages in the region [21] -[23] .
The longitudinal profile of the Ottawa River is segmented (Figure 3) reflecting changes in geologic setting. Between Lake Erie and approximately RK 8 the Ottawa River is essentially an extension of Lake Erie, with slopes approximately zero, and dominated by mud deposition. Between RK 8 and RK 26, the gradient is about 0.7 m/km and the channel substrate is moderately sorted fineto medium-grained sand that is armored by fine gravel (mostly bivalve shells and anthropogenic materials) and abundant woody debris. In the head-waters above RK 26, where the Ottawa River flows through the Pleistocene Oak Openings sand body, the gradient varies from 1 - 6 m/km, and the channel substrates are dominantly sand.
Within the urbanized portion of the drainage basin, the stream banks are engineered up to RK 14. Between approximately RK 14 and RK 34, the modern Ottawa River channel is incised about 2-m beneath its floodplain surface, creating the appearance of fill terraces. Because these terraces are inundated at regular intervals, and because of geochronology data about the age of the terraces [5] , the terraces are interpreted as anthropogenic in origin. Along the margin of the fill terraces are numerous examples of undercut banks, rotational slumps, toeof-slope deposits, small colluvial fans, small-scale avalanche or soil-fall deposits, and loss of riparian zone trees through undercutting, tree-lean, and tree-fall into the channel [5] .
The Secor Dam was located at RK 18. It was a run-of-river dam or weir 2.5 m tall and 17 m wide (Figure 4). The dam was built in 1928 for recreational purposes and was removed in 2007 because of liability concerns and for ecosystem restoration.
2. Methods
Field work involved establishing the precise UTM coordinates the start and end pin locations for 17 channel cross sections, and then repeated re-surveying of channel cross sections at those 17 locations (Figure 1). Differential GPS was used to locate each cross-section pin location using a Trimble Pathfinder Pro® XRS base station unit. The channel cross-sections were surveyed using a Topcon® GPT-3003W total station and prism. Repeated resurveying over a 10 month interval indicated that the total station error in locating cross section pins was ± 1 cm both vertically and horizontally.
Each channel cross section was surveyed prior to dam removal and then at about one-month intervals for six months after the dam was removed. It was not possible to continue the survey because bank mitigation projects subsequently resulted in cross-section pins being removed. The precision of the surveying method was repeatedly cross-checked, for example one channel cross section was surveyed repeatedly over a short time interval to document almost identical results [21] . The largest source of error was the ability to relocate XY-coordinate positions in the channel cross-section during repeated surveys. This error (average 0.44 ± 0.11 m) appears to be due to the difficulty of the person holding the prism rod, standing in the channel, to remain on the line of crosssection.
This study also involved 8 vibracores and 32 push cores in channel and overbank facies which were evaluated for sediment properties, paleohydrology, and historical channel change [5] [21] . Bedload sampled were obtained with a Halley-Smith bedload sampler on 11 occasions prior to dam removal and 17 occasions after dam removal. Sediment analysis including washing, drying, and pre-treating samples, sand sieve analysis and fine-grained sediment analysis using a Spectrex® PC-2300 laser particle-size analyzer [5] [21] .
Other components of this study involved geochronology (14C, OSL, and age dating anthropogenic materials) for paleohydrology [5] ; HEC-RAS modeling to predict the hydrologic effects of dam removal [4] ; use of the DREAM-1 model [24] to predict reservoir sediment erosion [21] ; and geochemical analysis of the sediments to assess sediment contamination [4] .
3. Results
3.1. Dam Removal
The Secor Dam was removed over a three-day interval from November 19-22, 2007 (Figure 5(A)). The removal was coordinated with low-flow conditions in the river. A significant amount of reservoir drawdown had been accomplished prior to the removal of the dam.
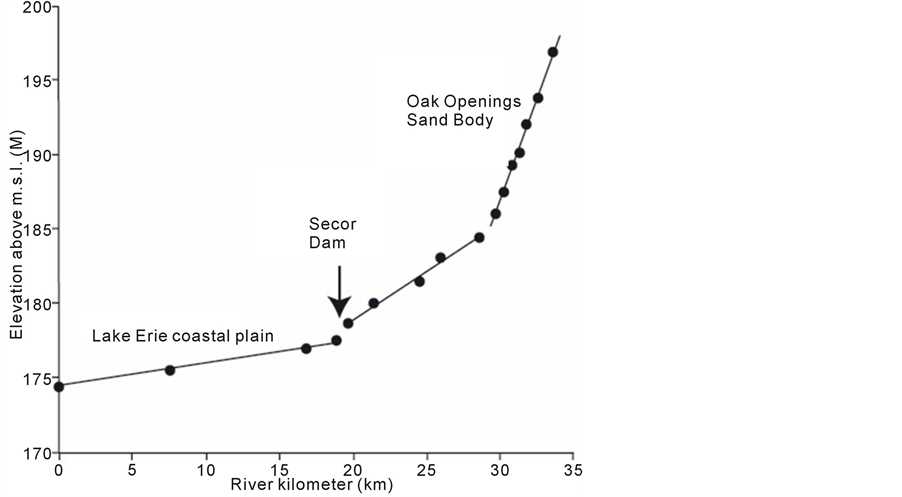
Figure 3. Longitudinal profile for the Ottawa River showing segmented components related to the geologic setting of portions of the drainage basin.
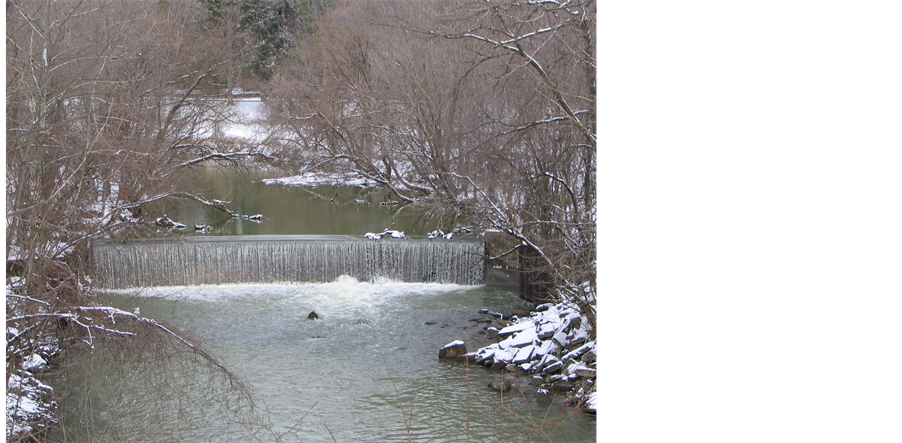
Figure 4. Field photograph of the Secor Dam prior to its removal in 2007.
3.2. Nickzone Migration Upstream
The immediate (within 24-hours) response was the upstream migration of a diffuse erosional step called a “nickzone” (Figure 5(B)). The nickzone was the width of the channel and approximately 10 m in length. After migrating approximately 85 m upstream within the first day after dam breaching, the nickzone stabilized at a location about 70 m upstream of the former dam. Subsequent coring and trenching revealed that the cause for stalling of the nickzone was because channel incision had intersected a peat horizon (Figure 5(C)). This peat horizon added cohesive strength to the channel substrate and significantly slowed channel incision and continued upstream migration of the nickzone. Subsequent studies indicates the peat horizon is the pre-settlement paleosol that was drained and buried within the past ca. 200 years due to human land clearance and settlement [5] .
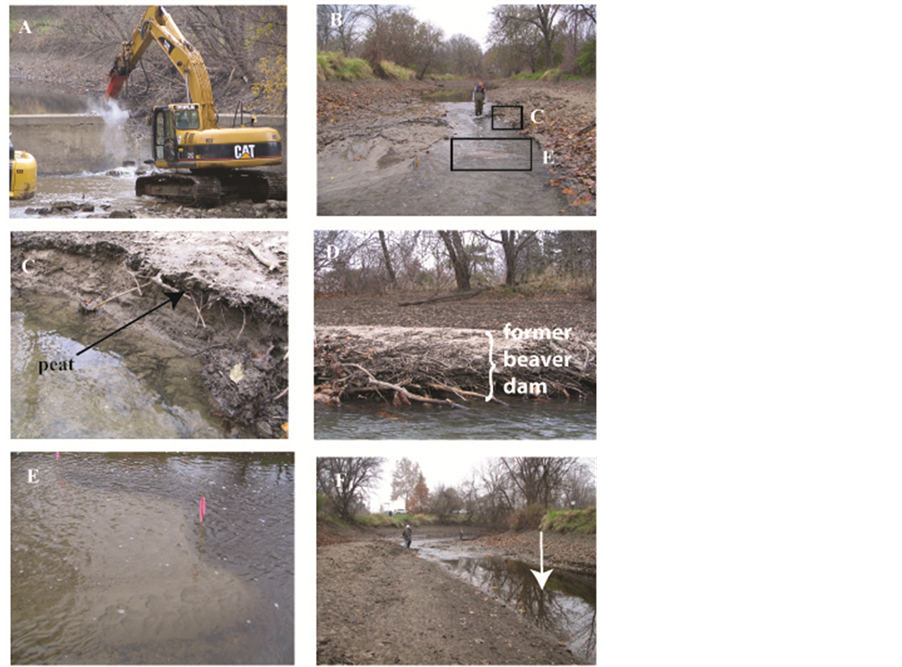
Figure 5. Field photographs of removal of the Secor Dam and immediate responses. (A) Photograph of breaching the dam. (B) Initial incision into flat floor of the former reservoir indicating the locations of other images. (C) Photograph of exposed peat layer (pre-settlement paleosol) that slowed subsequent channel incision. (D) Photograph of mat of log debris interpreted as exhumed beaver dam. (E) Photograph of sandwave migrating downstream (see text for details). (F) Photograph of newly incised channel after approximately 48 hours.
Prior to the arrival of European settlers, this area was an extensive region of wetlands called the “Great Black Swamp.”
In addition, the specific locality where the nickzone migration stalled out was subsequently revealed by bank erosion to be localized place with an accumulation of fine-grained sediment and log debris, including gnawed ends (Figure 5(D)). This is interpreted as the former site of a dam and pond constructed by beavers (Castor canadensis). Similar relict beaver dam and pond features have been described from riparian wetland environments elsewhere [25] .
3.3. Sandwave Migration Downstream
The second response, again starting within the first 24-hours and overlapping with nickzone migration, was the formation and downstream migration of a sandwave (Figure 5(E)) through the newly incised channel (Figure 5(F)). The sandwave translated toward the former dam as a bedload sheet. The sandwave initially consisted of three lobes as it entered the downstream meander bed. These lobes merged or reformed at different times over the 48-hour period (Figure 6). Eventually the sandwave dissipated in the pool of the re-formed meander.
The sandwave was continually tracked for the first two days using a GPS unit. The rate of downstream movement translation changed from 0.5 m/hr during the first 12-hours after dam breaching to 0.2 m/hr during the following 36-hours.
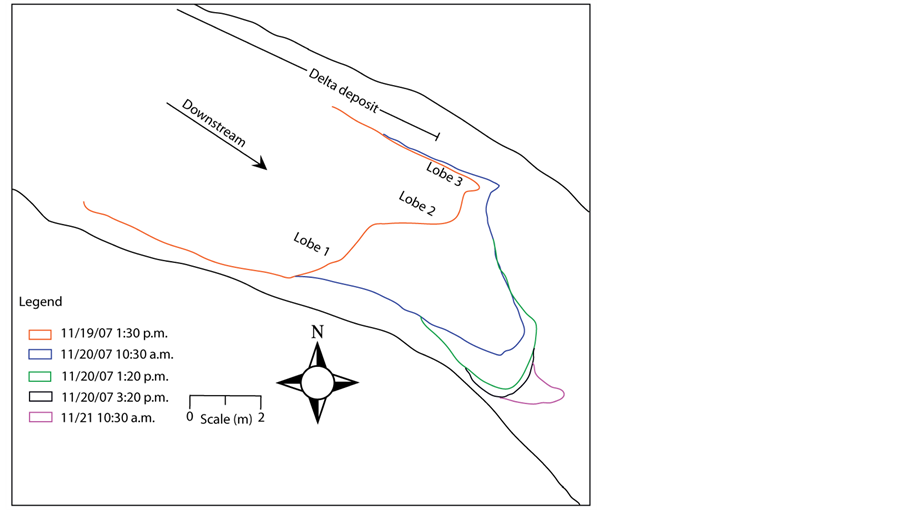
Figure 6. GPS survey of the position of sandwave at sequential times during the first 48-hours after breaching the dam. The sandwave stalled out in the pool of the re-formed meander upstream of the former dam.
3.4. Bedload Transport
Studies of previous dam removals have observed a “first flush” of suspended load sediment from the reservoir after dam breaching [2] [14] [19] . In this study only very minor suspended load transport was observed after dam breaching, probably because of the sandy nature of the former reservoir sediment [21] .
Bedload transport measurements were made at cross sections #4 (upstream of the former dam) and #14 (downstream of the former dam; see Figure 1). Instantaneous bedload transport measurements were highly episodic, but in general bedload sediment discharge (Qs) correlated with water discharge (Q) which is highly variable in this “flashy” river system.
On the several days that bedload transport data sets from upstream and downstream of the former dam were comparable, it was observed that bedload sediment discharge upstream of the former dam was about 5-10X greater than rates downstream of the former dam [21] . These measurements corresponded to field observations of two significant sediment traps. One of these was the foot-of-dam plunge pool (located immediately downstream of the former dam) which was originally stabilized with large boulders. These boulders were completely buried by sand transported from the reservoir within the study period. The second sediment trap was a confluence pool formed at the junction of the Ottawa River and Hill Ditch (Figure 1). This pool was also completely infilled within the study period.
3.5. Channel Incision and Aggradation
Significant channel incision upstream of the former dam was noted within the first two days, including >0.4 m erosion in certain locations. A series of high flow events during the second week after dam removal resulted in major channel re-organizations, including creation of a point bar in the first bend upstream of the former dam and continued incision throughout most of the former reservoir.
Channel cross-sections were re-surveyed 14 days after the dam removal (3 December 2007). The results are shown on Figure 7, Figure 8, Figure 9. All of the upstream cross sections showed significant incision (to a maximum of >0.7 m) but very little channel widening. Channel widening was localized and controlled by substrate heterogeneities such as the exhumed peat horizon. Downstream of the former dam as much as 0.5 m of aggradation was recorded, boulders in the foot-of-dam plunge pool were partly buried, and there was construction
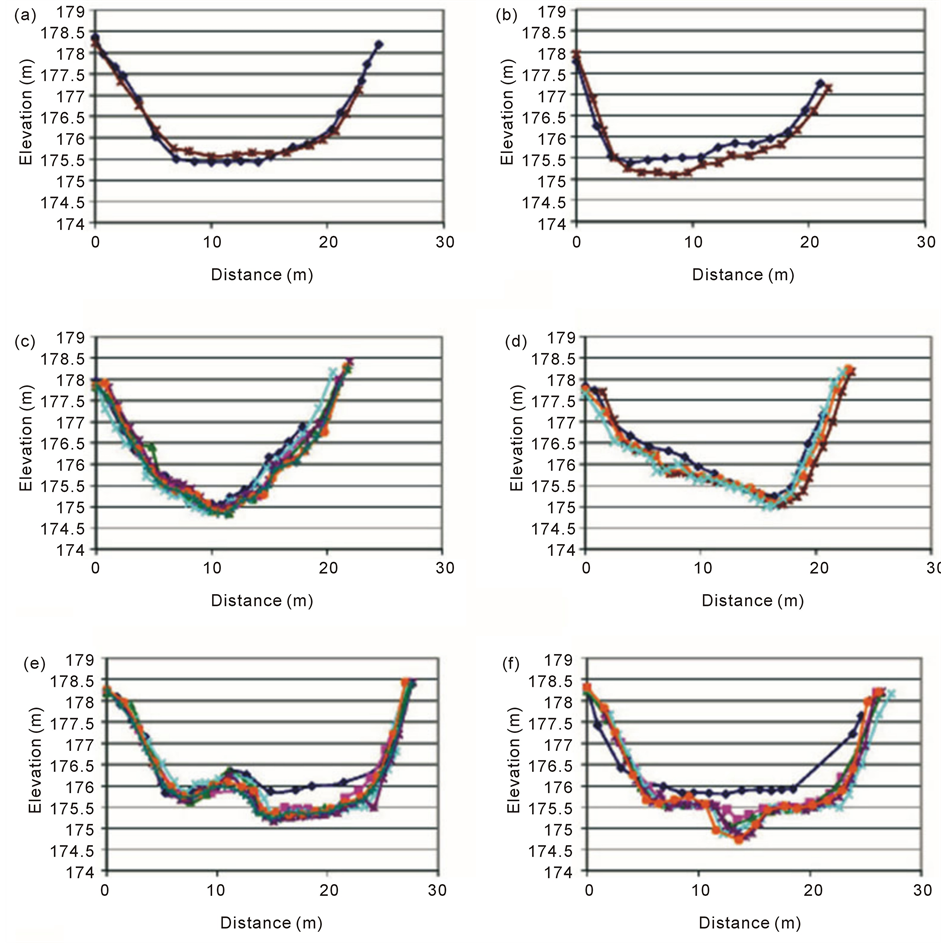
Figure 7. Sequential changes in channel cross sections (see key in Figure 9). (A) Cross section 1. (B) Cross section 2. (C) Cross section 3. (D) Cross section 4. (5) Cross section 5. (F) Cross section 6. See Figure 1 for cross section locations. Elevations are with respect to mean sea level (MSL). Note minimal pre-dam removal and post-dam removal profile changes in cross sections 1 and 2 (located about 330 m and 165 m upstream of the former dam). The maximum incision observed, in cross sections 5 and 6, was 1.3 meters.
of small mid-channel bars of pebbles and granules with fineto medium-grained sand. The source of the gravel was eroded fluvial pavements from the upstream reservoir [5] .
Channel cross-sections were again resurveyed 31 days after the dam removal (20 December 2007). Relatively minor changes had occurred (Figure 7, Figure 8, Figure 9), but generally localized scours had been removed and the channel shape was more uniform. In places there were channel bed outcroppings of the underlying glacial-lacustrine sediment, which are highly consolidated clays that limited further incision at these places.
On day 43 (1 January 2008), resurveyed channel cross sections found the first evidence of undercut banks and slumping on the outer bank of the first meander bend upstream of the former dam, apparently due to topographic steering around the newly formed point bar. The bar itself developed a chute channel across the inner part of the
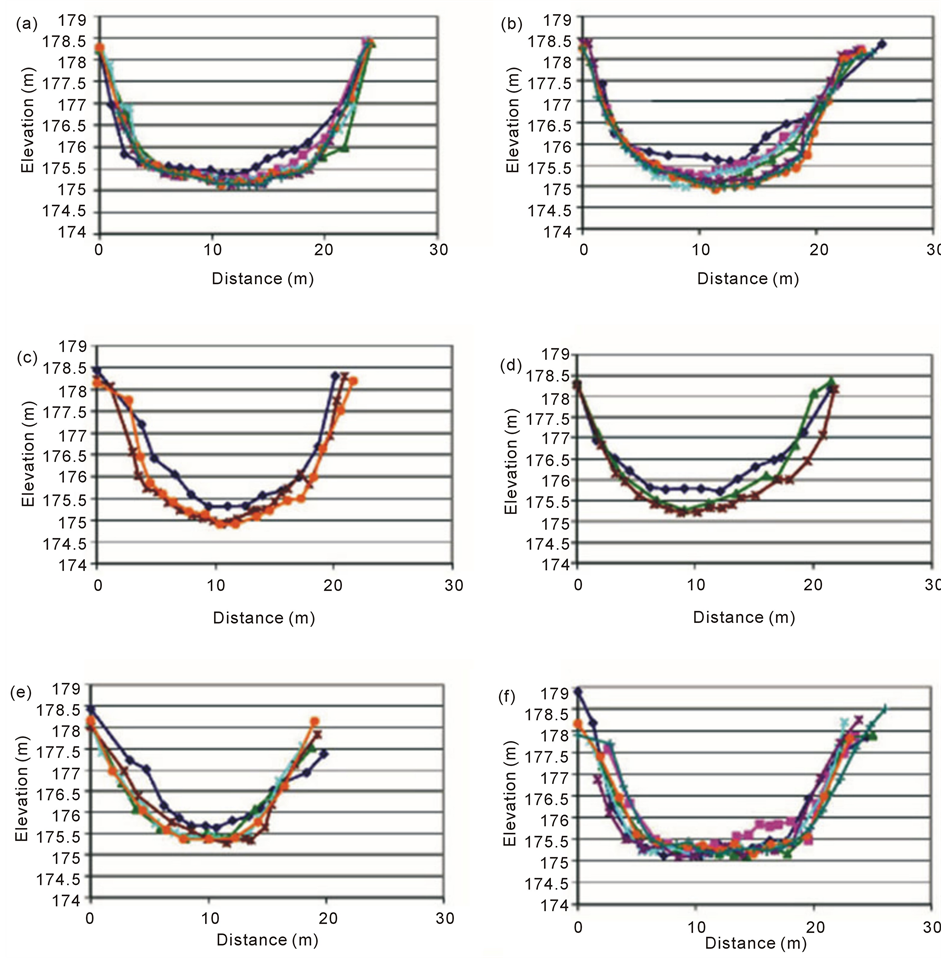
Figure 8. Sequential changes in channel cross sections (see key in Fig. 9). (A) Cross section 7. (B) Cross section 8. (C) Cross section 9. (D) Cross section 10. (E) Cross section 11. (F) Cross section 12. See Fig. 1 for cross section locations. Note shift from erosion above the former dam (cross sections 7-11) and deposition below the former dam (cross section 12).
bend.
On day 54 (11 January 2008) a flood exceeded bankfull conditions (Q = 50 m3/s). After recession, the channel revealed several large rotational slumps and bank failures in the study reach. It is interpreted that channel incision (due to dam removal) remobilized these slumps by removing the toe buttress. Appreciable channel widening occurred, as measured in channel cross section resurveys on day 96 (23 February 2008) in Figure 7, Figure 8, Figure 9. Downstream of the former dam, numerous sand stringers extended across the floodplain in the aftermath of the flood, and sand in the channel buried all evidence of previous gravel substrates.
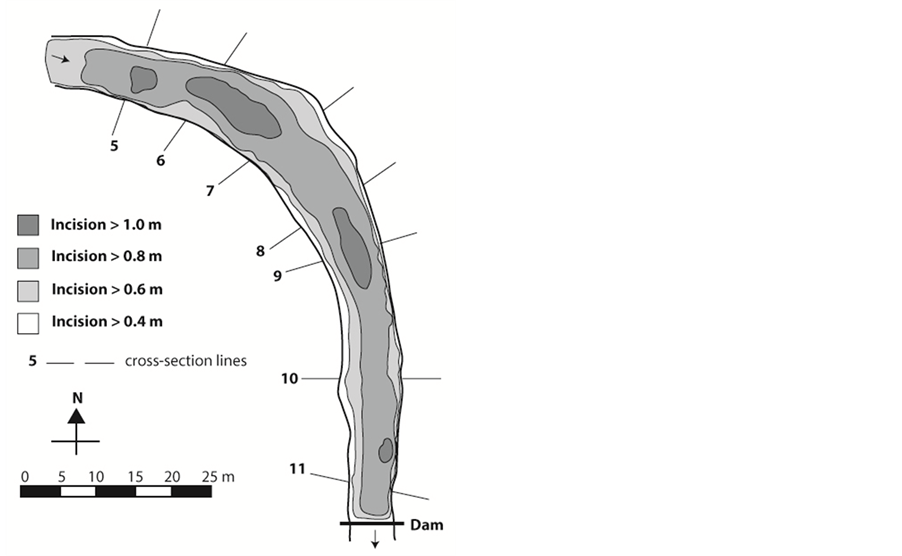
On day 96 (23 February 2008), approximately 3 months after the dam was removed, channel re-surveys were used to calculate total reservoir incision by creating DEMs and then a comparison DEM showing channel bed elevation changes (Figure 10(A)). The total volume of sediment removed from the reservoir was between 487 -
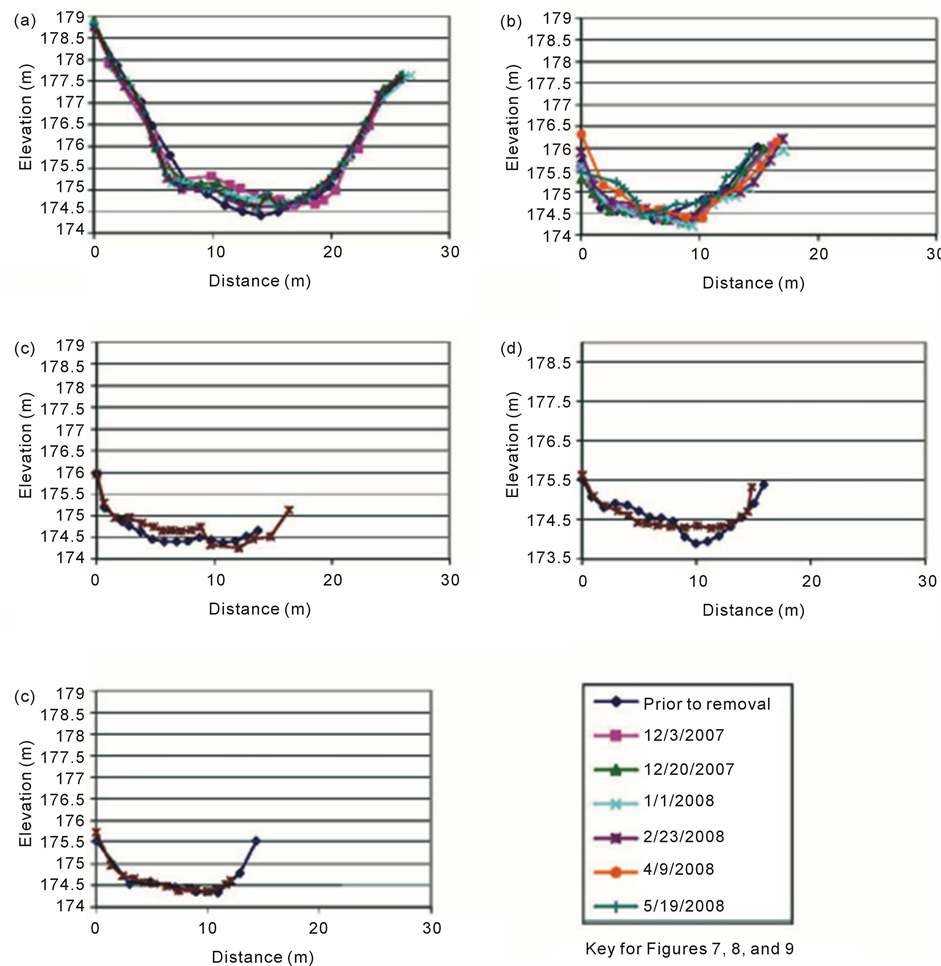
Figure 9. Sequential changes in channel cross sections. (A) Cross section 13. (B) Cross section 14. (C) Cross section 15. (D) Cross section 16. (E) Cross section 17. See Fig. 1 for cross section locations. Note the shift from deposition downstream of the dam after dam removal to essentially no change in cross section 17.
540 m3 of mostly sand. Figure 10(a) demonstrates that most of the reservoir incision was mid-channel. There was relatively minor change in channel cross-sections downstream.
On day 151 (19 April 2008) channel re-surveys documented continued undercut banks at the outer bends of the meanders upstream of the former dam, including leaning and falling trees. Large mud intraclasts were being introduced to the channel at these sites.
On day 181 (19 May 2008) approximately 6 months after the dam was removed, channel re-surveys again documented localized erosion at cutbanks and growth of pools at outer bends. There had also been significant erosion of the point bar that had formed upstream of the former dam. This is interpreted as instability in meander wavelength following removal of the dam and the initial phases in channel readjustments in meander geometry [5] . A second set of DEMs and a difference DEM was calculated (Figure 10(b)) showing that the region of
 (a)
(a)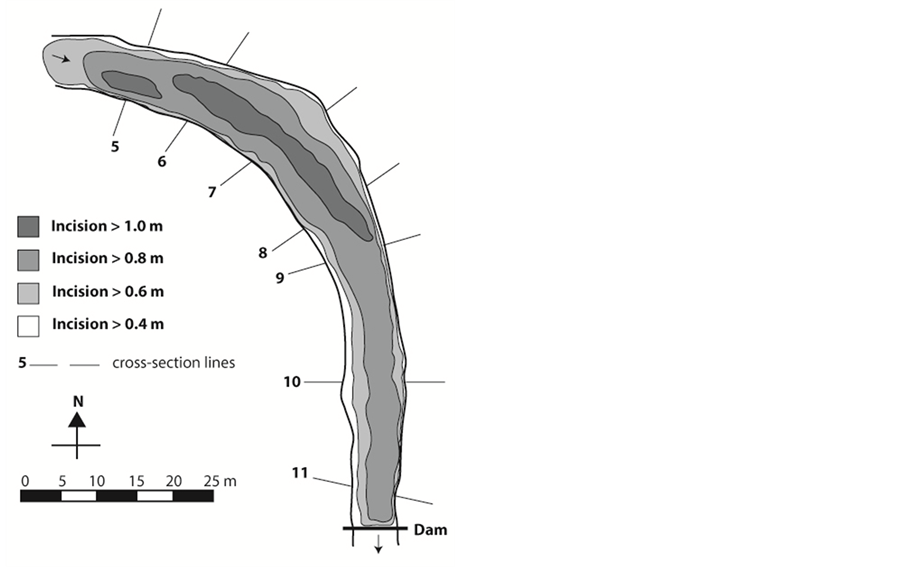 (b)
(b)
Figure 10. Channel bed elevation changes in the former reservoir during (top) the first 96 days (from 19/11/2007 to 23/02/2008) and during (bottom) the first 182 days (from 19/11/2007 to 19/05/2008). See text for discussion.
maximum reservoir incision has shifted to be more asymmetrical than previous. It was calculated that 285 - 315 m3 of mostly sandy sediment had been removed since the three month calculation, or in other words about 814 m3 (between 772 - 855 m3) of sandy sediment had been eroded from the reservoir in the 6 months following the dam removal.
4. Discussion
Most channel evolution models predict the following sequence of events to follow dam removal: 1) incision of former reservoir sediments, 2) channel widening facilitated by bank failures, 3) channel aggradation and incipient floodplain formation, and 4) quasi-equilibrium due to bank consolidation and re-vegetation [19] . Variations on this model have been reported for dam failures or instantaneous dam removals, such as the development of pre-dam failure channels in the reservoir sediments, the development of early breach drainage networks across the reservoir surface, and the occurrence of significant lateral channel migration producing terraces and point bars [3] . Many of these observed features (such as nickpoints, incisional relief, and cohesive bank failures) are dependent upon the presence of cohesive substrates (clays and silts) in the former reservoir.
The Secor Dam removal differed in some important details from these previous models. First, because of the pre-existing low stage channel through the length of the reservoir, initial incision was widespread and proceeded rapidly, even though the dam was removed under low-stage conditions. Within the first several days there was mobilization of a significant amount of reservoir sandy sediment and downstream transport as a series of bedforms. Channel incision reached >0.7 m within the first two weeks and reached a maximum depth >1.3 m within 22 weeks. Channel widening was mostly complete within the 14 weeks.
Second, the initial behavior of channel incision and widening in the former reservoir was strongly influenced by heterogeneities that were not anticipated in the planning process. One was the presence of a peat horizon, interpreted as a formed riparian wetland (paleosol) that was buried in historical times due to excess sediment loads from human land clearance [5] . Another was the local position of a former beaver dam (collected woody debris). These heterogeneities caused upstream propagation of the diffuse nickzone to stall for a period of several days. Another type of heterogeneity was created in places where incision cut to the level of Pleistocene glacial-lacustrine clays flooring the Holocene channel.
Third, the effects of dam removal were highly localized in this sand-dominated river system. Erosional effects were limited to about 150 m above the former dam, and the majority of the mobilized sediment was deposited in the reach within about 150 below the former dam. This may in part be explained by the presence of two downstream pools that acted as sediment traps: the former foot-of-dam plunge pool and a confluence bar-pool at the junction of the Ottawa River and Hill Ditch, a small tributary. Both pools were significantly infilled by the sandy sediment released from the former reservoir; in addition a gravel riffle between the two pools was significantly modified by sand infilling the gravel framework. Further downstream, there were minimal changes between preand post-removal channel cross sections, indicating that very little of the reservoir sand reached as far downstream as cross sections 15 - 17 (Figure 1). These survey results were verified by bedload and suspended load field measurements [21] . In summary, the data suggest about 500 m3 volume of sand was mobilized from the reservoir during the first three months with an additional about 300 m3 volume of sand that was mobilized in the following three months (in other words, about 800 m3 total over the six month interval); and that most of this sandy sediment was deposited in the two pools below the former dam, extensively modifying the pre-dam removal bed substrate.
5. Summary & Conclusion
Erosion and deposition caused by the removal of a dam with a reservoir infilled by sandy sediment will differ in significant ways from reservoirs infilled with silt and clay. There is a lack of a “first flush” of fine-grained sediment from the former reservoir. Erosion propagates upstream through the former reservoir as a broadly diffuse “nickzone,” and the rates of such effects can be modified by heterogeneities in the reservoir sediment. Upstream erosion and downstream sedimentation tend to be more localized in the case of sandy reservoirs, with extensive localized modification of channel substrates. Downstream pools behave as sediment traps and can be completely infilled in such dam removals.
Acknowledgements
We wish to thank the Village of Ottawa Hills, especial Marc Thompson, for access to the site. We wish to acknowledge our co-workers, Hans Gottgens, Todd Crail, and Patrick Lawrence (University of Toledo); Matt Horvat (TMACOG); Sheila Roberts and Enrique Gomezdelcampo (Bowling Green State University) for sharing information and ideas. We thank the Ohio Geological Survey, particularly Mike Angle, for equipment support. We wish to thank many graduate and undergraduate students at BGSU, particularly Laura Webb, who assisted with this study. Finally, this study benefitted from funding support from the Ohio Department of Natural Resources (Gottgens and Evans), Ohio Environmental Protection Agency (TMACOG), Geological Society of America (Harris), and Bowling Green State University (Evans).
References
- U.S. Army Corps of Engineers (2013) National Inventory of Dams.
- Evans, J.E., Mackey, S.D., Gottgens, J.F. and Gill, W.M. (2000) Lessons from a Dam Failure. Ohio Journal of Science, 100, 121-131.
- Evans, J.E. (2007) Sediment Impacts of the 1994 Failure of IVEX Dam (Chagrin River, NE Ohio): A Test of Channel Evolution Models. Journal of Great Lakes Research, 33, 90-102.
- Roberts, S.J., Gottgens, J.F., Spongberg, A.L., Evans, J.E. and Levine, N.S. (2007) Assessing Potential Removal of Low-Head Dams in Urban Settings: An Example from the Ottawa River, NW Ohio. Environmental Management, 39, 113-124. http://dx.doi.org/10.1007/s00267-005-0091-8
- Evans, J.E., Harris, N. and Webb, L.D. (2013) The Shortcomings of “Passive” Urban River Restoration after low-Head Dam Removal, Ottawa River (northwestern Ohio, U.S.A.): What the Sedimentary Record Can Teach Us. In: DeGraff, J.V. and Evans, J.E., Eds., The Challenges of Dam Removal and River Restoration, Geological Society of America, Reviews in Engineering Geology, 21, 161-182. http://dx.doi.org/10.1130/2013.4121(13)
- Rumschlag, J.H. and Peck, J.A. (2007) Short-Term Sediment and Morphologic Response of the Middle Cuyahoga River to the Removal of the Monroe Falls Dam, Summit County, Ohio. Journal of Great Lakes Research, 33, 142-153.
- Peck, J.A. and Kasper, N.R. (2013) Multiyear Assessment of the Sedimentological Impacts of the Removal of the Munroe Falls Dam on the Middle Cuyahoga River, Ohio. In: DeGraff, J.V. and Evans, J.E., Eds., The Challenges of Dam Removal and River Restoration, Geological Society of America, Reviews in Engineering Geology, 21, 81-92. http://dx.doi.org/10.1130/2013.4121(07)
- Evans, J.E., Huxley, J.M. and Vincent, R.K. (2007) Upstream Channel Changes Following Dam Construction and Removal Using a GIS/Remote Sensing Approach. Journal of the American Water Resources Association, 43, 683-697. http://dx.doi.org/10.1111/j.1752-1688.2007.00055.x
- Krieger, K.A. and Zawiski, B. (2013) Changes in Biotic and Habitat Indices in Response to Dam Removals in Ohio. In: DeGraff, J.V. and Evans, J.E., Eds., The Challenges of Dam Removal and River Restoration, Geological Society of America, Reviews in Engineering Geology, 21, 105-116. http://dx.doi.org/10.1130/2013.4121(09)
- Ritter, J., Shaw, K., Evelsizor, A., Minter, K., Rigsby, C. and Shearer, K. (2013) Assessing Stream Restoration Potential of Recreational Enhancements on an Urban Stream, Springfield, Ohio. In: DeGraff, J.V. and Evans, J.E., Eds., The Challenges of Dam Removal and River Restoration, Geological Society of America, Reviews in Engineering Geology, 21, 133-148. http://dx.doi.org/10.1130/2013.4121(11)
- Evans, J.E., Levine, N.S., Roberts, S.J., Gottgens, J.F. and Newman, D.M. (2002) Assessment Using GIS and Sediment Routing of the Proposed Removal of Ballville Dam, Sandusky River, Ohio. Journal of the American Water Resources Association, 38, 1549-1565. http://dx.doi.org/10.1111/j.1752-1688.2002.tb04364.x
- Evans, J.E. and Gottgens, J.F. (2007) Contaminant Stratigraphy of the Ballville Reservoir, Sandusky River, NW Ohio: Implications for Dam Removal. Journal of Great Lakes Research, 33, 182-193.
- Simons, R.K. and Simons, D.B. (1991) Sediment Problems Associated with Dam Removal—Muskegon River, Michigan. In: Shane, R.M., Ed., Proceedings of the National Conference of the American Society of Civil Engineers, New York, 680-685.
- Wohl, E.E. and Cenderelli, D.A. (2000) Sediment Deposition and Transport Patterns Following a Reservoir Sediment Release. Water Resources Research, 36, 319-333. http://dx.doi.org/10.1029/1999WR900272
- Lisle, T.E., Cui, Y., Parker, G., Pizzuto, J.E. and Dodd, A.M. (2001) The Dominance of Dispersion in the Evolution of Bed-Material Waves in Gravel-Bedded Rivers. Earth Surface Processes and Landforms, 26, 1409-1420. http://dx.doi.org/10.1002/esp.300
- Pizzuto, J.E. (2002) Effects of Dam Removal on River Form and Process. BioScience, 52, 683-691. http://dx.doi.org/10.1641/0006-3568(2002)052[0683:EODROR]2.0.CO;2
- Cui, Y. and Parker, G. (2005) Numerical Model of Sediment Pulses and Sediment-Supply Disturbance in Mountain Rivers. Journal of Hydraulic Engineering, 131, 646. http://dx.doi.org/10.1061/(ASCE)0733-9429(2005)131:8(646)
- Doyle, M.W., Stanley, E.H. and Harbor, J.M. (2002) Geomorphic Analogies for Assessing Probable Response to Dam Removal. Journal of the American Water Resources Association, 38, 1567-1579. http://dx.doi.org/10.1111/j.1752-1688.2002.tb04365.x
- Doyle, M.W., Stanley, E.H. and Harbor, J.M. (2003) Channel Adjustments Following Two Dam Removals in Wisconsin. Water Resources Research, 39, 1-15. http://dx.doi.org/10.1029/2002WR001714
- Simon, A. and Hupp, C.R. (1986) Channel Evolution in Modified Tennessee Channels. Proceedings of the 4th Federal Interagency Sedimentation Conference, 2, 5.71-5.82.
- Harris, N. (2008) Sedimentological Response of the 2007 Removal of a Low-Head Dam, Ottawa River, Toledo, Ohio. M.S. Thesis, Bowling Green State University, Bowling Green, 228.
- Baker, D.B., Richards, R.P., Lofus, T.T. and Kramer, J.W. (2004) A New Flashiness Index: Characteristics and Applications to Midwestern Rivers and Streams. Journal of the American Water Resources Association, 40, 503-522. http://dx.doi.org/10.1111/j.1752-1688.2004.tb01046.x
- Webb, L.D. (2010) Historical Changes in the Geomorphology of the Ottawa River (NW Ohio, U.S.A.) Due to Urbanization and Land Clearance. M.S. Thesis, Bowling Green State University, Bowling Green, 169.
- Cui, Y., Parker, G., Braudrick, C., Dietrich, W.E. and Cluer, B. (2006) Dam Removal Express Models (DREAM): Part I. Model Development and Validation. Journal of Hydraulic Research, 44, 291-307.
NOTES

*Corresponding author.