Open Journal of Modern Hydrology
Vol.3 No.1(2013), Article ID:26895,7 pages DOI:10.4236/ojmh.2013.31002
Adjustment of Infiltration Models in Poorly Developed Soils
![]()
Instituto Argentino de Nivología, Glaciología y Ciencias Ambientales, Mendoza, Argentina.
Email: aijvich@mendoza-conicet.gob.ar
Received August 8th, 2012; revised September 15th, 2012; accepted October 5th, 2012
Keywords: Infiltration; Model of Infiltration; Arid Zone
ABSTRACT
Infiltration is a fundamental component of the rainfall-runoff process. It was characterized through the adjustment and comparison of the Smith-Parlange, Green-Amptd, Philip, Horton and Kostiakov equations, using simulated rain in poorly developed soils from three geological formations and from different ages (Mariño Fm., Mogotes Fm., quaternary cover). Trials with the rainfall simulator were run in piedmont areas west of the city of Mendoza. Adjustments were performed separately for each of the trials and globally for each surface cover. The adjustment was satisfactory when the observed and the simulated infiltration velocity curves were compared using lumped parameters. The Green-Amptd model exhibited the best behavior for the three covers, while the Smith-Parlange equation was the least accurate, although it had little dispersion in the prediction errors. The Kostiakov and Horton equations yielded satisfactory results in view of the fact that the development of the infiltration rate curve was simulated after the impoundment time was determined with the Green-Amptd formula. The Philip model is not consistent, with the exception of the results obtained for the Mariño cover. In the post-calibration procedure the parameters showed no noticeable differences with respect to those obtained during calibration. In every case the relative squared error of the infiltration curve was very satisfactory, below 5%.
1. Introduction
Precipitation in the piedmont area west of the city of Mendoza (Argentina), the most top rated urban center in the central western part of Argentina), is scarce and occurs in the summer months. Severe anthropic pressure, physical soil characteristics, and torrential water courses discharging in urban and agricultural areas have given rise to great flood hazards. In the region, exceptionally heavy showers (great intensity and short duration) downpouring on a basin with a marked relief and scarce vegetation cover give rise almost immediately to high surface-water flow rates. There is a lot of data on extensive damage to the social infrastructure and on the loss of human lives caused by catastrophic floods. Infiltration, the main component of the rainfall-runoff process, is the physical process by which rainwater penetrates the soil. This is the reason why it plays a crucial role in the application of any hydrological model. Flood control and water availability are two relevant aspects of a management plan, especially in the case of arid regions.
Infiltration depends on a large number of factors and it is sometimes difficult to assess the impact of some of them. This is the reason why infiltration was characterized on the basis of field observations and measurements performed with a proprietary rainfall simulator. Tests were conducted on soils collected from the three largest surface geological formations. The objective of the research was to characterize the infiltration process, adjust five infiltration models, compare their goodness of prediction, and to analyze the sensitivity of the parameters involved.
2. Material and Methods
2.1. Description of the Study Area
Infiltration trials were performed in the region’s three most representative geological formations given their outcrop area: Mogotes Fm. (Upper Tertiary), quaternary cover, and Mariño Fm. (Upper Tertiary). Trials were carried out in the Divisadero Largo watershed, 32˚53'S and 68˚W, and in the Cuenca Aluvional Piloto), 32˚52'- 50"S and 68˚52'00"W. From the geomorphologically point of view, the basins are located in the piedmont of the Precordillera of Mendoza. They are 1500 m.a.s. and 10 to 20 km in length. There are two levels of glacis. Of the most ancient ones, a few insignificant relicts can be found on top of relict hills; the most modern ones, on the other hand, are large in area and have a well-developed medium to coarse textured drainage system.
The climate is arid temperate, mean annual precipitation is 215.9 mm and mostly in the summer season (October to March), and mean annual temperature is 15.8˚C. Relative humidity is 54 % and average values in the warmest (January) and in the coldest (July) months are 30.2˚C and 3.4˚C, respectively; absolute maximum and minimum temperatures range from 42.7˚C (January) to −6.2˚C (June). The winds from the Atlantic carry little moisture after blowing for over 1000 km on the continent and the air masses from the Pacific Ocean discharge their moisture on the Los Andes mountain range, giving rise to the arrival of a dry and warm wind known as Zonda; the most frequent winds come from the southeast and from the east. The plant cover is 1.50 m high shrub, mainly Larrea sp., accompanied by a herbaceous stratum of Stipa sp. and Papophorum sp. The plant cover in both sectors is good for they have been closed for the last 5 and 25 years respectively. At present, except for the above mentioned basins which constitute small nature reserves, the piedmont area is subjected to strong anthropic pressure (settlements, aggregate extraction, overpastures, logging, fires, etc.) because the disorganized and accelerated growth of the city of Mendoza has increased flood frequency and magnitude.
2.2. Main Soil Characteristics
Soils are poorly evolved due to poorly weathered materials. In the western part of the region (mountain) there are materials derived from shales, greywackes, sandstones, tuffs, andesites and porphyries, which are the major constituents of outcrops. Soils in the rest of the area (piedmont) are derived from secondary parent materials. The parent regolith occurs as a shallow layer of irregular distribution in the western part that corresponds to the eastern slope of the Precordillera and as a deep layer in the rest of the area, with the exception of those sections that are heavily eroded. Soils have evolved into an ochric epipedon and subsurface strata with low carbonate and calcium sulfate concentrations due to reduced lixiviation. Scarce organic matter darkens the upper layer slightly, and decreases with depth. Soil depth is estimated at approximately 50 cm, taking into account the depth with higher concentration of roots of native species. The presence of roots is important as they lend the soil certain stability given the scarcity of colloids. The soils are slightly alkaline; large accumulations of soluble salts have been observed only in small areas. The soils exhibit abrupt textural changes mainly due to lithological discontinuities.
The Mogotes Fm is a dark-grey poorly consolidated polymictic conglomerate of significant thickness. The conglomerate contains clasts of different sizes, a sandy matrix and intercalations of siltstone; in some sectors the conglomerate is underlain by limestone. Soils are shallow, coarse to medium textured, skeletal, and moderately well drained. They can be classified as Typic Torriorthents associated with highly-eroded miscellaneous stony lands. The Mariños Fm comprises a succession of sandstones and grey conglomerates with intercalations of silty argillites. Sometimes, it shows extensive outcrops or covers the bottom of river beds or is covered by quarternary deposits. Soils are classified as lithic torriorthents because they are shallow, of medium to coarse texture, stony, associated with a miscellaneous area of rocky nature or covered by coarse detritus. The parent material of the quaternary cover is an agglomerate with no stratification that contains poorly rounded coarse fragments and a sandy matrix; soils tend to be shallow and weakly structured with good porosity, moderately to excessively drained and stony, a characteristic that becomes more marked with depth. These soils are classified as Typic Torriorthents associated with eroded miscellaneous area. Soils from the Mogotes Fm and the quaternary cover have a high content of coarse fragments (41.1% ± 12.0%); in the Mariño Fm the said content is 11.6% ± 2.0%. Matrix texture is sandy and sandy loam. Table 1 presents some physical characteristics.
2.3. Rainfall Simulator
Trials were carried out on a 50 m2 plot with a rainfall simulator designed by the authors. The device is a portable structure with three rows of sprinklers (9 sprinklers per row) placed 3 m above the ground. Rain intensity is controlled by a number of manometers and sluice valves to regulate pressure and flow in each row. Sprinklers have a pendular movement for increased application uniformity. Intensity ranges between 60 and 150 mm·h−1. Rainfall is also simulated around the plot in order to minimize the border effect. The applied rain is measured as the average of 7 pluviometers distributed across the plot. Runoff is collected in a tank at the end of the plot and conveyed along a canal to a standard HS type weir. The generated rain has 86 percent uniformity.
Table 1. Main physical characteristics of the deposits.
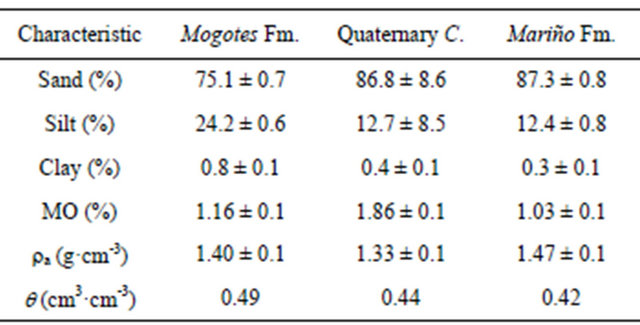
Trials lasted between 20 and 50 minutes.
2.4. Infiltration Models
This paper analyzes the degree of applicability of 5 models. They are: Horton’s and Kostiakov’s empirical equations, widely used because of their simplicity but whose parameters have no physical relevance; models synthesized from the numerical solution to Richards equation, like those by Philip and Smith-Parlange; and a model based on the humid front potential, like the Green-Amptd equation [1]. The parameters in the last three models have physical meaning and can be assessed on site or at the laboratory. The respective analytical expressions are:
Horton: (1)
(1)
Kostiakov: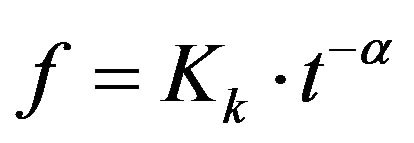 (2)
(2)
Philip: (3)
(3)
Smith-Parlange: (4)
(4)
Green-Amptd: (5)
(5)
where: f infiltration rate in mm·h−1; fc, constant or basic infiltration rate in mm·h−1; fo starting infiltration rate, mm·h−1; b, parameter controlling the decreasing relationship of the infiltration rate, adimensional; Kk, constant, adimensional; a, constant, adimensional; Ca, constant, equivalent to the saturated hydraulic conductivity, in mm·h−1; S, sortivity, in mm·h−0.5 and equal to (2·M·- Ks·3·Sf)0.5; Co, parameter almost equal to S2/2; Ks, saturated hydraulic conductivity, in mm·h−1; F, accumulated infiltration, in mm; Sf, suction in the humid front, in mm; M, porosity reduced by the initial humidity content, adimensional.
2.5. Model Calibration, Post-Calibration and Sensitivity Analyses
Parameters to be calibrated are: Ks and Sf in the SmithParlange, Philip and Green-Amptd models; in Horton, fo, fc, and b; in Kostiakov, Kk and a. The parameters were calculated by adjusting field-measured infiltration curves in order to minimize the impact of the intrinsic heterogeneity of soil properties. Parameters were estimated using a methodology based on Diskin and Simon’s (1977) [2]. Firstly, the 5 models were calibrated by optimizing 4 Ui objective functions [3] for each trial. The analytic expressions are:
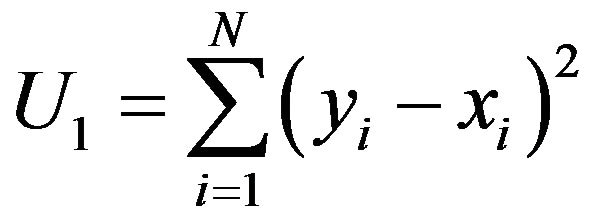 (6)
(6)
 (7)
(7)
 (8)
(8)
 (9)
(9)
where: yi is the observed magnitude; xi is the simulated magnitude. For each trial and model, parameter values are made to vary within a wide range that is identical for all trials on the same cover. There are as many infiltration rate curves as parameter combinations. The 4 Uk are calculated in each curve whereby four vectors are obtained, the length of which matches the number of generated curves. In each vector the minimum value and the parameters yielding such value are identified; 4 groups of optimum Pi parameters are obtained from each trial, i.e., one per function.
Next, a Pi set is searched for that will minimize the Uk simultaneously. All Uk are calculated again with all the Pi sets, and a Wk,i magnitude is obtained. They are arranged as a matrix; with sub-index k representing the value of objective function k which is valued with set Pi. Then a new Rk,i matrix is built based on the order or category assigned to each Wk,i element in each row. The order of the elements is a function of their relative magnitude, starting at 1 for the lowest Wk,i value and increasing by one unit for successive higher values. The i columns are added, and the lowest value identifies the Pi with the best adjustment simultaneously in all objective functions. This procedure is applied to all trials and models.
In order to characterize infiltration, it is necessary to arrive at a single set of parameters per cover. Characteristic values are selected from the set of optimums derived from the trials performed on each cover, using a procedure similar to the one described. A square matrix is then built, the size of which is equal to the number of trials run on one cover. Each Ek,j element is the relative squared error (ECR) between the curve observed in trial k and the curve simulated with the Pi parameters. Next an order matrix, similar to Rk,i, is built. The i columns are vertically added; the lowest element is the Pi set of parameters that yields the lowest ECR simultaneously in all trials. This procedure is applied to all infiltration models and covers under analysis.
Post-calibration of parameters is performed by analyzing the ECR response surface for all trials carried out on a specific cover [4,5]. For each pair of parameters within the above-mentioned variation range the infiltrated volume ECR was calculated corresponding to the curve span between the measured impoundment time (tp) and 20 minutes (t20), and the infiltration rates at 10, 15 and 20 min. An ECR isoline map is then drawn based on two parameters, and the area with the smallest error is identified.
Model sensitivity is analyzed on the basis of variations in mean infiltration volume and mean infiltration rate during the above-mentioned times generated by ±25% changes in the parameters undergoing post-calibration process-known as base parameters. Parameters are made to vary individually for each model and surface, calculating volume and infiltration rate, determining mean values per surface and model, and comparing them with the mean values derived from base values. Analysis does not include field-measured parameters (porosity, initial humidity, etc.). Changes in mean values were categorized as: slight (ECR < 5%), slightly moderate (5% < ECR < 15% variation), moderate (15% < ECR < 25%), and severe (ECR > 25% variation). On the other hand, if parameter variations generate an ECR > 5%, the model is significantly sensitive to parameter changes; otherwise, the model’s sensitivity is low “data” is plural, not singular.
3. Results and Discussion
Trials were performed in autumn and winter. Soils were slightly wet in Mogotes and quaternary, and dry to wet in Mariño. In Mogotes impoundment time was very short and similar in all trials, around 0.5 minutes. In the quaternary cover tp ranged between 3.5 and 9.5 minutes, depending on the initial moisture content. In Mariño tp ranged from 1.5 to 2.5 minutes when the soil was wet, and up to 5.5 minutes when practically dry. In the Mogotes Fm the infiltration rate decreases rapidly during the first 10 minutes and it then proceeds slowly. For the other two covers the infiltration rate decreases evenly; through time it does not tend to be asymptotic over a constant value, which is a more manifest characteristic of the Mariño Fm. It should be pointed out that the trials were not performed long enough to verify that tendency.
Six trials were selected for the Mogotes Fm., eleven for the quaternary cover, and five for the Mariño Fm. Parameters were made to vary over a very wide range and four sets of parameters were obtained for each trial, model, and surface. Then the set of optimum parameters was determined. The degree of dispersion of the optimum parameters was measured using the variation coefficient (CV). In general, CV had a range between 15 and 30 %, with the exception of the b exponent of Horton’s equation, which exhibited great variability: the CV being in the order of 146.8%, 26.7% and 57.6% in the Mariño, Mogotes, and quaternary covers respectively. The optimum parameters for the different covers are shown in Table 2.
The mean infiltration volume and infiltration rate (at 10, 15, and 29 min) were calculated with the optimum parameters and then compared with the respective observed values. The infiltration curve was simulated for field-measured time periods from the observed tp. Chu’s expression (1987) [6] was used to calculate tp in Horton’s and Kostiakov’s empirical models. According to the errors shown in Tables 3-5 (ECRV, relative squared error-volume; ECRC, squared error-curve; ECRM, maximum relative squared error-curve calculated in a specific trial), infiltration has been properly characterized, especially since the equations are models simplified on the basis of time and some soil parameters. Interrelations among soil characteristics, micro-relief, vegetation cover and rainfall are quite complex and are not fully represented in the models used. For the three covers, GreenAmptd’s showed the best behavior, followed by Kostiakov, Philip or Kostiakov and Philip for the Mogotes Fm., quaternary and Mariño covers, respectively. The SmithParlange model is the least precise given errors each trial yielded.
Table 2. Optimum parameters of the different models.

Table 3. Mean infiltrated volume and infiltration rate observed and simulated with calibrated (C) and post-calibrated (PC) parameters and errors. Cover: Mogotes Fm.
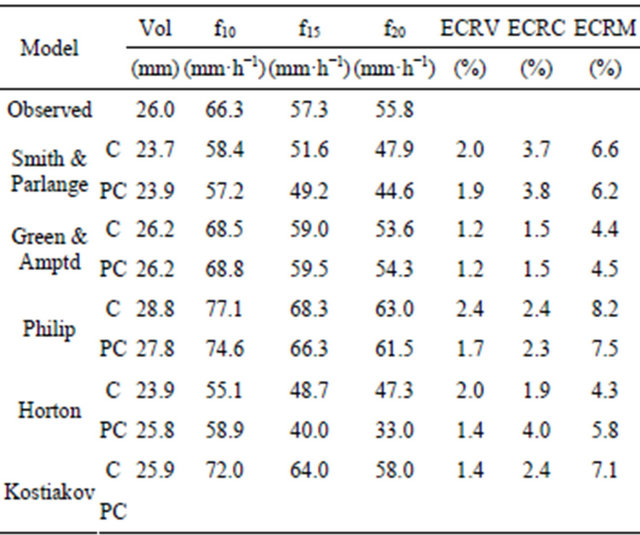
Table 4. Mean infiltrated volume and infiltration rate observed and simulated with calibrated (C) and post-calibrated (PC) parameters and errors. Cover: Quaternary Cover.
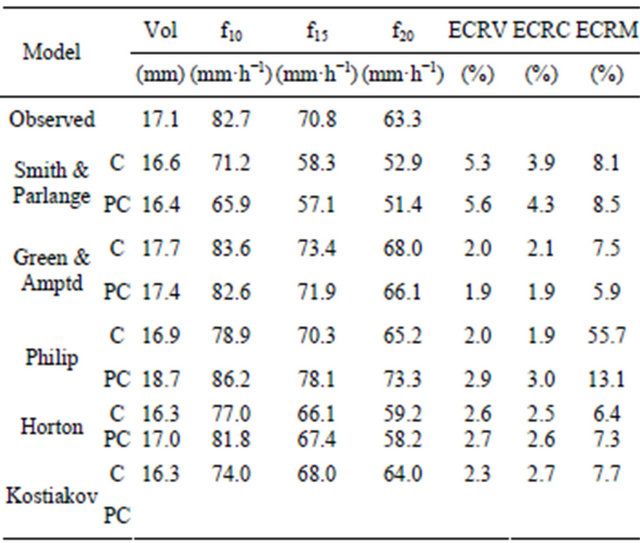
Table 5. Mean infiltrated volume and infiltration rate observed and simulated with calibrated (C) and post-calibrated parameters (PC) and errors. Cover: Mariño Fm.
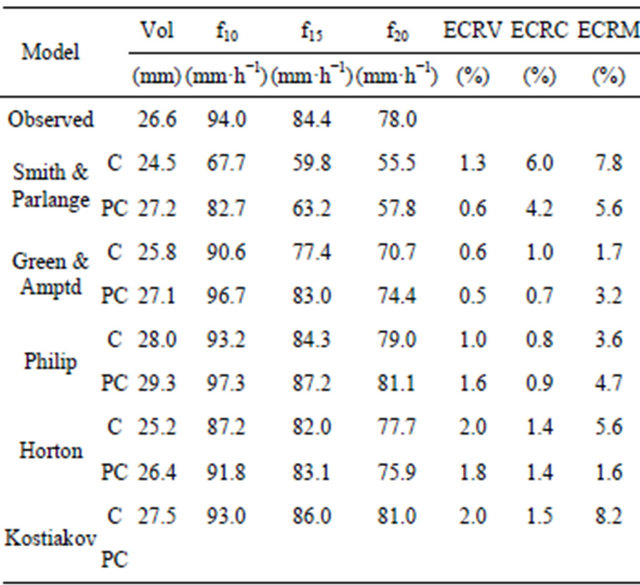
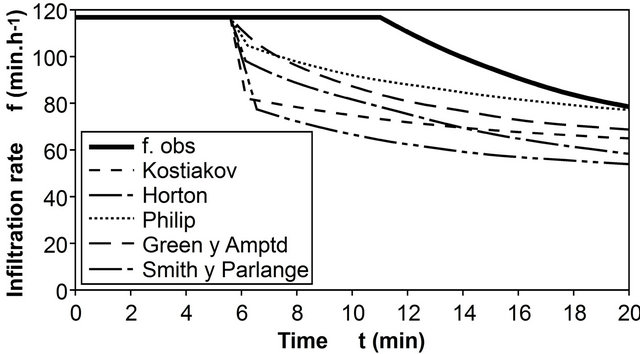
The Green-Amptd, Smith-Parlange and Philip models have Ks and Sf in common. It was thus decided to search for common values from the analysis of the ECR response surfaces for volume, f10, f15, and f20, one for each model and cover. Parameters were made to vary across a wide range and within small intervals. Figures 1(a) and (b) show observed infiltration capacity curves and those derived from different models for two tests conducted on the quaternary cover (the worst and best fit) using the parameters obtained during the post-calibration process.
For the different models, the surfaces in the Mogotes cover show a variable width strip where the ECR is minimum (<2.0%) and with almost the same ECR value along the valley of the said strip. Minimum ECR isolines show compensation between parameters when interacting in the expected direction. The volume error calculated with the optimums does not fall within the minimum error strip, except in the Green-Amptd model.
Though it was not possible to identify a single pair of parameters, an identical subspace was established for the three models that complies with the minimum condition. For an ECR < 2.0% the common region is for 27.0 < Ks < 29.0 mm·h−1 and 87.0 < Sf < 92.0 mm. Predictions improved slightly with the post-calibration parameters adopted, except in Smith-Parlange. The post-calibration process did not improve model adjustment substantially, but it made it possible to identify a single value for parameters in common. On the other hand, ±25.0% variations in Ks yielded significant changes. Variations in Sf gave rise to changes in mean values lower than 10.0 %, and even less with the passing of time. Negative variations in Ks and Sf led to more important changes than the positive ones. Variations in Sf resulted in non-significant errors in volume and in significant errors in infiltration rate; as for Ks, errors are greater and significant.
In the quaternary cover the Smith-Parlange and GreenAmptd models show an ellipsoidal minimum error region
 (a)
(a)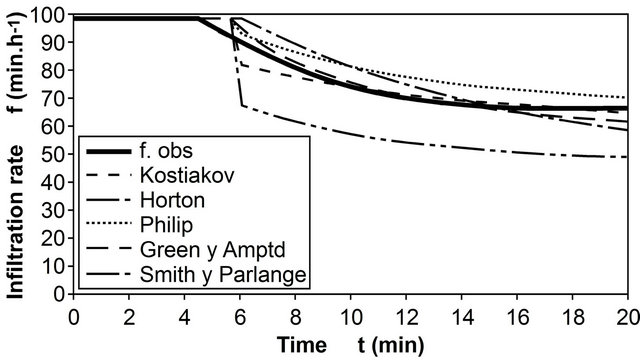 (b)
(b)
Figure 1. Infiltration capacity observed and calculated with the Smith-Parlange, Green-Amptd, Philip, Horton and Kostiakov models for the quaternary cover using parameters obtained during post-calibration: (a) Worst fit test; (b) Best fit test.
with a < 5.0% and 2.0% ECR, respectively; for Philip’s the minimum error subspace, <2.0% ECR, is presented as a thin strip of variable width. The above-mentioned compensation between Ks and Sf was also observed. The intercept of the three minimum error subspaces led to a common region of 40.0 < Ks < 43.0 mm·h−1 and 57.0 < Sf < 73.0 mm. For any given pair of parameters within these ranges, the error is simultaneously minimum in all three models. The new values did not yield smaller errors in volume or total curve, with the exception of the GreenAmptd model. The sensitivity analyses indicate that changes of ±25.0 % in Ks result in moderate variations in mean volume and infiltration rate. Greater changes are observed in Smith-Parlange. Changes in Sf produce slightly significant modifications. For those variations, Ks generates changes in mean values in respect of base values that are 2 to 3 times more significant than for the same variations in Sf, and important variations in the ECR. The Green-Amptd model performs best. Figure 2 shows the response area and the smallest ECR subspace according to parameters Ks and Sf for the infiltrated volume variable in the quaternary cover.
In the Mariño cover the model surfaces show a wide and uniform minimum error strip (ECR < 1.0%). GreenAmptd presents an ellipsoidal sector where the ECR is even smaller. Interaction between Ks and Sf is as expected. In this case, the optimums are identical for all three models. The common region with the least error is
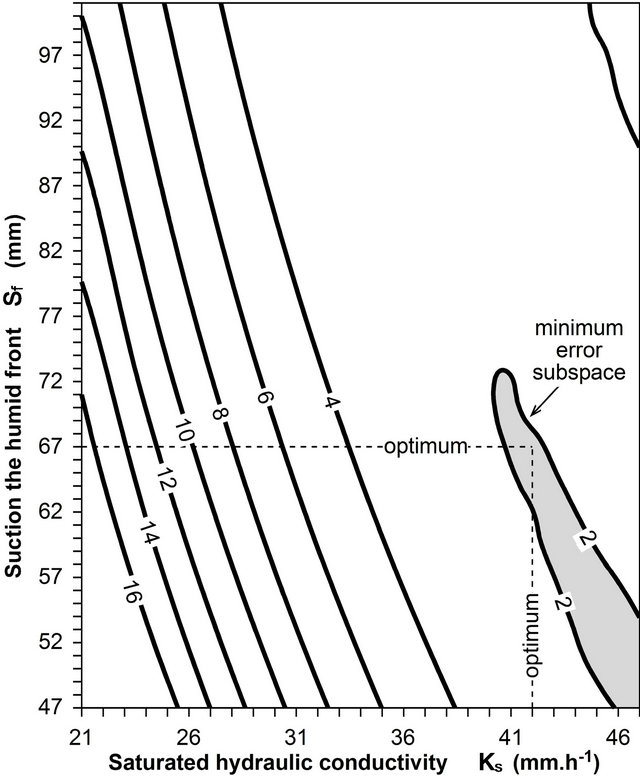
Figure 2. Response area of the relative squared error for the infiltrated volume variable in the quaternary cover according to the saturated hydraulic conductivity (Ks) and stress parameters in the wetting front (Sf).
much more circumscribed due to the small error generated by Green-Amptd (41.0 < Ks < 43.0 mm·h−1 and 102 < Sf < 110.0 mm). The new adopted values diminish the volume and curve estimation errors, but the estimation errors are do not improve in the Philip model. With changes of ±25.0% in Ks, infiltration volume and rate values undergo moderate to severe changes, especially in the Smith-Parlange model. Changes in parameters increase the ECR but it remains below 5.0%; in Philip positive changes increase the error noticeably. Mean volume and infiltration rate undergo slightly moderate changes for the same variation in Sf.
In Kostiakov the minimum error subspace for the three covers is shown on a strip that describes an arch for most of the range analyzed, the direction of which goes from the lowest to the highest parameter values. The calculated optimums fall within the minimum error sub-area for volume. The ECR’s of the total curve and volume show a good adjustment; therefore, the parameters adopted are the previously calculated optimums. Sensitivity analysis shows that variations in ±25.0% in Kk generate significant changes in mean volume and infiltration rate, and that the ECR increases 2.5 to 3 times with respect to the base values. The same changes in a lead to minor modifications and have little impact on the ECR.
The Horton equation parameters lack a consistent physical interpretation, with the exception of fc that was deemed to be equivalent to Ks; therefore the previously calculated values were adopted. For each cover ECR isoline maps were drawn for fo and b. For Mogotes and Mariño the minimum error sub-region is a concave curve of variable width and a large variation in ECR throughout the fc range and very low values of b. In the quarternary cover the ECR increases noticeably as b decreases, almost independently from fo. The optimum parameters fall within the least error strip. For Mogotes the new values show a smaller ECR in volume and infiltration rate at 10 min and larger error at the end of the curve. Estimation of the mean volume and infiltration rate in the first half of the curve improved substantially while discrepancies increase substantially in the rest. Variations in ±25.0% in fc generate slightly moderate to moderate changes, which increase rapidly as the infiltration curve develops. The same changes in fo yield slightly moderate to slight changes through time. For b positive variations generate lower mean values and changes are slightly moderate. Variations in fo have a greater impact on the volume error than on the rest and significantly affect infiltration rate as the curve develops. Negative variations in fc and positive variations in b affect the error considerably at the end of the curve. For the quaternary cover the new values do not reveal a substantial variation in the estimation of mean values or error. Variations in ±25.0% in fc lead to slightly moderate changes in mean volume and infiltration rate. The same changes in fo affect the mean volume value while changes in mean infiltration rate decrease rapidly through time. Positive variations in b result in lower mean values and changes are slightly moderate. Given changes of the same order in all three parameters, each taken separately, ECR sensitivity yields volume and infiltration rate errors of <8.0%, the usual being 3.0 to 5.0%, which is not significant. In Mariño the new values produce a slight error reduction and improvement in mean values. Given ±25.0% variations, mean volume and infiltration rate values exhibit slight to slightly moderate changes, with the exception of fo where changes are moderate and their influence diminishes as the curve develops. The same changes in the parameters lead to errors of little significance, and greater changes are due to fo. In general, the post-calibration process did not produce a substantial improvement in infiltration estimation. Initial infiltration fo exerts the greatest influence when determining the infiltrated volume, although its sensitiveity is not significant. At the end of the curve the influence of basic infiltration parameter fc and exponent b is noticeable. Horton’s equation performed best in Mariño, followed by quaternary and Mogotes.
4. Conclusions
A set of optimum parameters of the infiltration process in soils originating from sedimentary deposits was developed using a rainfall simulator and 5 infiltration models. When comparing experimental and simulated infiltration with lumped parameters, all models showed a satisfactory adjustment. The Green-Amptd model behaves best, and the Smith-Parlange model yields the poorest estimates. Horton’s and Kostiakov’s empirical equations yield satisfactory results, especially since the infiltration rate curve was developed using the impoundment time determined with the Green-Amptd formula, which required the use of parameters estimated for that model. With the exception of the Mariño cover, the Philip model did not perform well.
The post-calibration procedure did not yield marked differences with respect to the parameters obtained during calibration. On the other hand, the ECR response surface did not show a circumscribed minimum error subspace, nor did it help to identify a single set of parameters that meet the minimum minimorum condition. In general, the subspace was a semi-open or open surface, and its orientation reflected a parameter compensation in the expected direction. The post-calibration procedure made it possible to select identical values for homologous parameters in the Philip, Green-Amptd, and SmithParlange models.
Variations in ±25.0% in Ks lead to moderate changes in volume and infiltration rates. Changes were greater in Smith-Parlange, while in Green-Amptd their importance increased as the curve developed. In Philip, changes were uniform. Modifications of the same order in Sf resulted in considerably smaller variations. In Kostiakov Kk generated more important changes than a. In Horton fo exerted a greater influence on the determination of infiltrated volume but its sensitivity is not significant in predicting the end of the infiltration curve. Parameters fc and b are more important in this sector. In general, even though a category or order can be assigned to each model depending on its accuracy, the relative squared error associated with the estimated parameters did not show relevant differences in the infiltration process description. Also, the predicted infiltrated volumes in the section of the curve analyzed are highly precise in all models. In short, the best estimate of the mean infiltrated volume and infiltration rate at 10, 15, and 20 min was obtained with the Green-Amptd model. This model also showed the least ECR for the total curve, and the maximum error in a specific trial for all three covers.
REFERENCES
- C. T. Haan, C. T. Johnson and D. L. Brankesiek, “Hydrologic Modeling of Small Watersheds,” American Society of Agricultural Engineers, Lexington, 1982, pp. 121- 162.
- M. H. Diskin and E. Simon, “A Procedure for the Selection of Objective Functions for Hydrologic Simulation Models,” Journal of Hydrology, Vol. 34, No. 1-2, 1977, pp. 129-149. doi:10.1016/0022-1694(77)90066-X
- E. Servat and A. Dezetter, “Selection of Calibration Objective Functions in the Rainfall-Runoff Modeling in a Sudanese Savannah Area,” Hydrological Sciences Journal, Vol. 26, No. 4, 1991, pp. 307-330. doi:10.1080/02626669109492517
- S. Sorooshian and F. Arfi, “Response Surface Parameter Sensitivity Analysis Methods for Postcalibration Studies,” Water Resources Research, Vol. 18, No. 5, 1982, pp. 1531-1538. doi:10.1029/WR018i005p01531
- S. Sorooshian and V. Gupta, “Automatic Calibration of Conceptual Rainfall-Runoff Models: The Question of Parameter Observability and Uniqueness,” Water Resources Research, Vol. 19, No. 1, 1983, pp. 260-268. doi:10.1029/WR019i001p00260
- S.-T. Chu, “Generalized Mein-Larson Infiltration Model,” Journal of Irrigation and Drainage Engineering, Vol. 113, No. 2, 1987, pp. 343-354. doi:10.1061/(ASCE)0733-9437(1987)113:2(155)

