Open Journal of Forestry
Vol.4 No.3(2014), Article ID:44655,10 pages DOI:10.4236/ojf.2014.43024
Assessing Biomass Expansion Factor of Birch Tree Betula utilis D. DON
Khurshid Alam, Syed Moazzam Nizami
Department of Forestry & Range Management, Arid Agriculture University, Rawalpindi, Pakistan
Email: moazzam.nizami@uaar.edu.pk
Copyright © 2014 by authors and Scientific Research Publishing Inc.
This work is licensed under the Creative Commons Attribution International License (CC BY).
http://creativecommons.org/licenses/by/4.0/


Received 18 January 2014; revised 21 February 2014; accepted 9 March 2014
ABSTRACT
Biomass is the component of living organism and mostly obtained from plants, animals, insects and the residue of all the mentioned organisms. Biomass is the key source of energy present in the form of organic matter. The study aimed to find out biomass and its variation in each component of Betula utilis D. Don (Birch Tree) with varying diameter at Kalam forest division Swat, Khyber Pakhtunkhwa (KPK) province, Pakistan. The biomass of different components was determined by non-destructive methods. Overall, 30 trees were selected from different diameter classes viz a viz up to 10, 11 - 20 and greater than 20 cm. Ten trees were selected from each class. The diameter of stem and large branches and their length were measured in the field. Later, the volumes of stem and branches were calculated and converted into biomass. The study revealed that stem contributes 42.65% biomass followed by large and sub branches as 39.22% and 13.54% respectively. Leaves contribute 4.59% only. The above tree biomass contribution by different components was arranged as stem was greater than large branches; these were greater than sub branches and the lowest was in leaves. The total above ground biomass of single tree was 20.59, 58.041 and 197.214 kg∙tree−1 respectively for diameter up to 10, 11 - 20 and greater than 20 cm. The averaged biomass in all diameter classes was 91.95 ± 93.064 kg∙tree−1. The total biomass of single tree of diameter class up to 10, 11 - 20 and greater than 20 cm was 24.71, 69.649 and 236 kg respectively. The below ground biomass of single tree of diameter class up to 10, 11 - 20 and greater than 20 cm was 4.11 ± 1.24 kg, 11.61 ± 3.56 kg and 39.44 ± 8.9 kg respectively. The biomass expansion factor was 1.34, 1.47, and 1.5 t∙m−3 respectively for diameter classes up to 10 cm, 11 - 20 cm and greater than 20 cm respectively. The mean biomass expansion factor for all diameter classes was 1.44 t∙m−3.
Keywords:Biomass Allocation, Biomass Expansion Factor, Birch Tree

1. Introduction
Biomass is defined as the components of living organism or the constituents of living organism present in the form of organic matter. The biomass is renewable energy source and obtained from biomes such as plants waste or plant residue, as different wastes like straws, corns including roots (Bonnie, 2009). Biomass is also defined as non-processed organic matter obtaining from living things like plants, insects animals and products of microorganisms, by-products of domestic waste like waste of fruit and vegetable, residues/wastes from agriculture, forest, industries and municipal wastes. The agriculture products include grains, straws, leaves, roots and crops remain. Forest biomass includes the woody stem, branches, bark, twigs, leaves, fruit, seeds, debris, litter, roots, grasses, lichen and herbs (UNFCCC, 2000).
Biomass expansion factor is defined as the ratio between the dry biomass to the stem volume of a tree denoted by BEF, as W = BEF × V, where W is the dry biomass in t∙ha−1, V is the stem volume in m3∙ha−1 and BEF, is measured t∙m−3 (Marklund, 1988). Due to the unavailability of allometric data for roots, root biomass is generally estimated from standard root to shoot ratios for broad leaved and coniferous species (Cairns et al., 1997). Change in the allometry of tree and allometric equations may also lead to variation in root biomass and root to shoot biomass ratios (Cairns et al., 1997; Kurz et al., 1996).
Birch tree biomass was reported earlier in British Columbia (Stanek & State, 1978). The only species of birch found in Pakistan is B. utilis as distributed in the Himalaya and Hindu Kush mountains on north facing slopes at higher altitude. B. utilis is mainly distributed in region of Waziristan, Kohistan, Swat, Baltistan, Azad Kashmir and Northern Areas of Pakistan (Hussain & Illahi, 1991). B. utilis is broad leaved species, grows at higher altitude with a good ability to face the harsh condition of cold climate. It grows in between the timber line (12,000 ft msl) and sub alpine zone adding a good biomass that is used by community as medicinal plant (bark), lopped for forage/fodder, for making agriculture tool, fuel wood and used in industries. The present study aimed at development of BEF for birch in order to convert the stem volume into biomass directly that can be used in further studies related to assessments of C in ecosystem. The specific objectives of the study were to determine, the contribution of different tree components (stem, branches, leaves twigs) biomass in total above ground biomass and preparation of allometric equations based on the diameter and volume for B. utilis at different diameters.
2. Methods and Material
2.1. Study Area
The study was carried out in Kalam forest division located in District Swat., Khyber Pakhtunkhwa (KPK) province of Pakistan, having an area of 5037 square kilometers located at the north of the country (GoP, 1999). The geographical location of the district is 34˚30'00''N to 35˚50'00''N and 72˚05'00''E to 72˚50'00''E latitude and longitudes (Rashid et al., 2011; Muhammad et al., 2011). In summer and winter the temperature ranges from 22˚C to −2˚C and the mean annual precipitation is 864 mm (Jabbar et al., 2009).
2.2. Research Design
The data were collected in the sub alpine zone of Kalam, district Swat, Khyber Pakhtunkhwa (KPK) Pakistan. Non-destructive method was applied because the tree height was in an accessible range for climbing. The maximum height of the tree was 12 m and mean height was 9 m. The entire stand of birch (B. utilis) was categorized into three diameter classes viz a viz less than or equal to 10, 11 - 20 and greater than or equal to 21 cm. Overall ten trees were selected from each diameter class. The tree was separated into individual components as stem, large branches, sub branches, leaves and roots. The ccanopy was categorize into large branches (diameter greater than 1 cm at thinner end), sub branches/twigs less than or equal to 1 cm diameter at thicker end and foliage. The selected trees were climbed to measure the length and diameter of each and every branch of the tree having diameter greater than 1 cm at the thinnest end by using tree caliper and measuring tape. The diameter at thicker end, mid-point and thinner end were determined and recorded for large branches. The diameter and length of stem was determined by using tree caliper and measuring tape with the regular interval of 1 meter length. The sub branches of less than or equal to 1 cm diameter at thick end were counted in the tree and four reference branches were detached from the tree by random selection with the help of cutting scissors. These sub branches contained leaves. The leaves were detached from each sub branch. The fresh weights were determined for sub branches and their leaves by using a balance (Vann et al., 1998).
The sample were packed in the plastic bags and brought into laboratory for drying in oven at 72˚C for 48 hours. Moisture content was determined from the difference of dry and fresh weight (Fehrmann et al., 2005). The volume was calculated by using formula,  , for all the branches and stem from the height of the stem and the length of the branches. The diameter and height calculated the volume. In this way all the trees of all the classes were determined.
2.3. Biomass Calculation
The total biomass was calculated as the aggregate weights (kg) of leaves, large branches, sub branches, roots and stem.
2.3.1. Biomass of Stem and Large Branches
The volume of stem was calculated for each section meter (length) interval by the multiplication of diameter and length. The volumes for branches were determined from the length and diameter of the branches. The formulas were applied as
 (
(where h = tree height, d = diameter and f = form factor. Where Biomass = Volume × wood density.
2.3.2. Biomass of Sub Branches (Twigs), Leaves and Roots
The dried weights of collected sub branches (twigs) and leaves were used for estimation of biomass. Methods of estimating the roots biomass was pooled from the available literature. The difference between the dried weights and fresh weights were determined for moisture content percent (MC%). The moisture content percent were used to extrapolate the total dried weight of the sub branches (twigs) and leaves. The dried weights were the biomass of sub branches (twigs) and leaves (Jusoh et al., 2011).

2.4. Biomass Expansion Factor
The biomass expansion factor expressed as the ratio of the dried weight of stem, branches, twigs and leaves to the volume of the stem, that is BEF is equal to total biomass divided by the stem volume. The typical equation used was as , Where W was the total biomass (gm) of all the components and v is the volume (m3) of stem (Lehtonen et al., 1996).
3. Results and Discussion
The results showed different relationships of biomass of each component and diameter of the tree.
3.1. Above Ground Biomass
The above ground biomass of tree in three different diameter classes viz a viz up to 10, 11 - 20 and greater than 20 cm varied significantly (Table 1). The biomass of diameter class up to 10, 11 - 20 and greater than 20 cm was 20.59 ± 6.24, 58.041 ± 17.848 and 197.214 ± 44.701 kg∙tree−1 respectively. The averaged biomass in all diameter classes was 91.95 ± 93.064 kg∙tree−1. The regression analysis showed that there was significant relation between the above ground biomass and diameter. It was noticed that diameter and biomass of the tree was having sigmodial relationship with R2 = 0.97 (Table 2). The study closely resembles the above ground biomass of two Betula species that were yellow birch and white birch 5.06 t∙ha−1 and 3.46 t∙ha−1 respectively. The biomass of both the species were different due to the structure and stem density (Peter, 2008). The biomass of paper birch (83.2 t∙ha−1) was higher than the biomass of subalpine fir 26.67 t∙ha−1, the contribution of different components varied significantly, the biomass of the tree is mainly contributed by the stem (Wang et al., 2000). The variation in the biomass of the tree and total above ground biomass with the diameter increment was quite visible and also

Table 1. Biomass (kg) as function of diameter (Dbh).
Table 2. Components % contribution in total biomass of Betula utlis tree as function of diameter (Dbh).
affected by the different site quality (Cumming et al., 2002).
3.2. Stem Biomass
The biomass of stem in diameter classes up to 10, 11 - 20 and greater than 20 cm were 9.31 ± 2.552, 23.909 ± 6.629 and 80.23 ± 24.257 kg respectively (Figure 1). The regression analysis revealed that there is a significant relation between stem biomass and diameter and represented by sigmoidal type of equation. The value of R2 was 0.97 (Table 1).
The biomass contribution of stem in diameter classes viz a viz up to 10, 11 - 20 and greater than 20 cm were 45.54 ± 2.135, 41.74 ± 3.48 and 40.65 ± 1.38% respectively (Figure 2, Table 2). The regression analysis revealed that there is significant relation between stem % contribution and diameter of the tree (R2 = 0.588, Table 2).
Wenyao et al., (2002) concluded that more than 60% of biomass is consisted of the stem for subtropical broad leaved ever green forests. Among the species, the above ground biomass of Nothofagus antarctica was mostly contributed by the stem of the tree or the stem stand. However the changes occurred due to the stem structure and site quality (Veronica et al., 2010). There was a significant variation in biomass contribution of different components for fast growing species. The major contribution of stem was about 70 %. The biomass of stem was changed with different spacing (Sunil et al., 1994). Wang et al., (2000) reported that the stem of paper birch contributed more than 70% of the total biomass. The stem biomass of Gmelina arborea contributed 80% of the total biomass (Jonathan, 2004). The biomass of stem for Olea ferrugina was 331 ± 35.51 kg, which contributed 46% of the total above ground biomass (Abbas et al., 2011).
3.3. Biomass of Large Branches
The biomass of the large branches also increased as the diameter increased. The biomass of the large branches in the diameter classes viz a viz up to 10, 11 - 20 and greater than 20 cm were 5.234 ± 2.14, 24.867 ± 9.353 and 97.783 ± 24.35 kg respectively. The average large branches biomass for all the trees was 42.628 ± 48.764 kg. The biomass of large branches varied significantly from the lower diameter to the upper diameter (Figure 1).
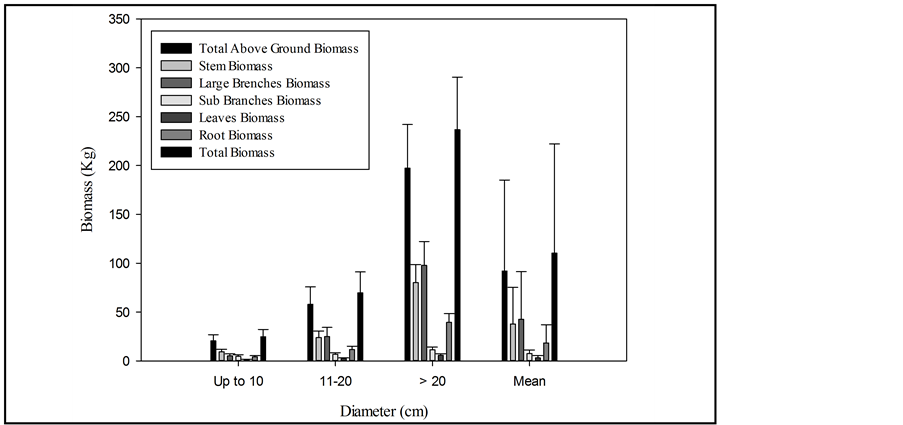
Figure 1. Relationship between biomass (Kg) and diameter (cm) in Betula utilis tree.
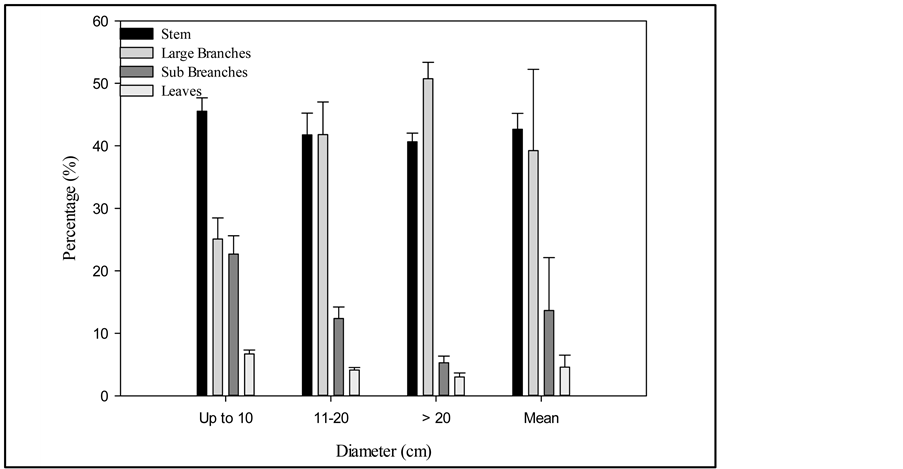
Figure 2. Relationship between biomass % contribution of tree components and diameter (cm) in Betula utilis trees.
The regression analysis revealed that there is significant relation in between the biomass of large branches and diameter of tree (Table 1).
The contribution of large branches in the total biomass in diameter classes up to 10, 11 - 20 and greater than 20 cm were 25.0934% ± 3.378%, 41.85% ± 5.21% and 50.37% ± 2.63% respectively (Figure 2). The regression analysis revealed that there is significant relation between the large branches % and diameter (Table 2).
The contribution of branches recorded by Peter (2008) in Nova Scotia for Yellow birch and white birch was 23% and 20% which was lower than the resulted branches percentage in the present study. About 10% of biomass was located in the thick branches of eucalyptus sp. (Cruzado & Roque, 2011). The variation of branches biomass of Gmelina arborea was recorded by (Swamy et al., 2003). About 20% to 30% biomass is contributed by the branches of fast growing species (Sunil et al., 1994). Above ground biomass of (Larix gmelinii and L. cajanderi) was mainly contributed by stem and then followed by branches (Takuya et al., 2006). The same results were concluded for eucalyptus (Razakamanarivo et al., 2011). The branches biomass of alpine fir is reported more than the branches of paper birch (Wang et al., 2000). The biomass of the branches of yellow birch showed the great response to the light availability and drought (Peter et al., 2012). The branches biomass of silver birch was next to the biomass of stem (Uri et al., 2012). Large branches were composed of 34% - 36% of the above ground biomass in Brazilian forest which greatly varied in biomass from the other country (Kauffman et al., 1995). The contribution of branches biomass was increased as the diameter was increased and the biomass contribution of leaves was decreased as the diameter increased (Kantola & Makela, 2006).
3.4. Biomass of Sub Branches
The sub branches biomass of diameter classes viz a viz up to 10, 11 - 20 and greater than 20 cm were 4.69 ± 1.67, 6.944 ± 1.52 and 11.47 ± 2.69 kg respectively. The average biomass of sub branches of entire diameter classes was 7.705 ± 3.45 kg (Figure 1). The regression analysis revealed that there is significant relation between sub branches biomass and diameter (Table 1).
The contribution of sub branches biomass in the total biomass of the tree was recorded as 22.6% ± 2.94%, 12.37% ± 1.83% and 5.92% ± 1.05% in diameter classes up to 10, 11 - 20 and greater than 20 cm respectively (Figure 2). The regression analysis revealed that there is significant relation between sub branches % contribution and diameter (Table 2).
Cruzado and Roque, (2011) reported the biomass of sub branches/twigs and foliage of eucalyptus spp. were 19% and 17.3% respectively. As the diameter increased the relative proportion small branches in the total biomass decreased. The biomass of small branches in the younger stage was high and declined with passage of time (Wenyao et al., 2002). The biomass of branches of Olea ferrugina 210 ± 20.95 kg∙tree−1, which contributed 31.17% biomass of the total biomass (Abbas et al., 2011).
3.5. Biomass of Leaves
The biomass of the leaves in diameter classes viz a viz up to 10, 11 - 20 and greater than 20 cm were 1.359 ± 0.339, 2.385 ± 0.714 and 5.84 ± 1.58 kg respectively (Figure 1). The regression analysis revealed that there is significant relation between leaves biomass and diameter (Table 1).
The biomass contribution by the leaves decreased in percentage as the diameter grew up. The leaves biomass contribution into the total biomass varied as 6.69% ± 0.644%, 4.128% ± 0.38% and 3% ± 0.64% in diameter classes up to 10, 11 - 20 and greater than 20 cm respectively (Figure 2). The regression analysis showed that there is a significant relation between leaves % and diameter (Table 2).
The biomass percentage of leaves in this research were quite comparing with the percentage contribution of leaves for yellow birch and white birch i.e. 3.5% and 5.7% respectively (Peter, 2008). The leaves biomass of Olea ferruginea was determined as 13.9 ± 3.42 kg∙tree−1 that accumulated 1.9% of total above ground biomass (Abbas et al., 2011). Biomass of leaves for Eucalyptus sp was 17% of the total above ground biomass (Cruzado & Roque, 2011). The biomass of different components of the fast growing and multi-purpose tree followed the pattern as stem% > roots% > branches% > leaves (Sunil et al., 1994). The total above ground biomass of two species Larix gmelinii and L. cajanderi followed the percentage contribution pattern as stem% > roots% > branches% > leaves , the biomass was 2% - 3.5% of the total biomass (Takuya et al., 2006).
3.6. Roots Biomass
The biomass of roots varied from the lower diameter class toward upper diameter class. The biomass of roots in diameter classes viz a viz up to10, 11 - 20 and greater than 20 cm were 4.11 ± 1.24, 11.61 ± 3.56 and 39.44 ± 8.9 kg respectively (Figure 1). The regression analysis showed that there is significant relation between diameter and roots biomass (Table 2). Roots biomass of this research was taken as 20% of the total above ground biomass. The roots biomass of Olea ferruginea was 112.55 ± 11.81 kg which was also taken as 20% of the above ground biomass (Abbas et al., 2011). The roots of birch were assumed to be 19% of the above ground biomass (Bhat, 1982). The below ground biomass of Eucalyptus was 4.5 to 134.4 kg∙tree−1 (Razakamanarivo et al., 2011). The roots to shoots ratio for birch were 0.21 (Wang et al., 2000).
3.7. Stem Volume
The mean stem volume were 0.018255 ± 0.005 m3, 0.15733 ± 0.012998 m3 and 0.15733 ± 0.036338 m3 in all the diameter classes respectively. The regression analysis showed that there is a strong relationship between the stem volumes as diameter function (Table 3).
This research indicates that there is a direct relation in between the diameter (Dbh) and volume. This result was supported by the formula of volume (Philips, 1994). It was found that as girth increase the volume is found to be increased in species of scrub forest in Pakistan (Nizami et al., 2009).
3.8. Total Biomass of Tree (Above Ground and below Ground Biomass)
The total biomass of the tree was the sum of below ground biomass and above ground biomass. Root biomass was taken as 20% of the above ground biomass. The total biomass of the tree in different diameter classes viz a viz up to 10 cm, 11 - 20 cm and greater than 20 cm was 24.71 ± 7.489 kg, 69.649 ± 21.41 and 236 ± 53.64 kg respectively (Figure 1). The regression analysis revealed that there is significant relation between total biomass of tree and diameter (Table 1). The mean biomass of tree components separately at different diameter (cm) of B. utlis is presented in Table 4.
3.9. Biomass Expansion Factor
The biomass expansion factor of different diameter classes viz a viz up to 10, 11 - 20 and greater than 20 cm was 1.34 ± 0.0622 t∙m−3, 1.47 ± 0.112 t∙m−3 and 1.5 ± 0.0514 t∙m−3 (Figure 3). The averaged biomass expansion factor for all diameter classes was 1.44 ± 0.81 t∙m−3. The regression analysis also indicated that increase and decrease in diameter has affected the biomass expansion factor. The regression analysis showed that there is significant relation between the biomass expansion factor and diameter (Figure 4).
The study revealed that the biomass expansion factor ranged from 1.34 to 1.5 t∙m−3 which in the range of IPCC prescribed values for birch trees. The biomass expansion factor was ranged from 1.15 to 4.2 t∙m−3 and used as mean value of 1.3 t∙m−3 (IPCC, 2006). The results were higher from that of paper birch. It was due to the fact that paper birch had multi stem tree and as the biomass expansion factor depends upon the stem volume. Betula utilis accumulated less stem volume due to single stem plant and the crown point as not more than 5 m. Biomass expansion factor of pine, spruce and birch calculated in Sweden as 0.49, 0.52 and 0.71 t∙m−3 respectively by using allometric equation , where W is the dry biomass in t∙ha−1, V is the stem volume in m3ha−1 and BEF measured in t∙m−3 (Marklund, 1988). The biomass expansion factor varied from the site to site and area to area. The biomass expansion factor of forest were studied in Great Britain, Europe and Ireland, the results were 1.438 t∙m−3, 1.47 and 1.30 t∙m−3 (Gallagher et al., 2004; Lowe et al., 2000; Levy et al., 2004). The biomass expansion factor determined in India for deciduous trees was 1.59 higher from this research (Haripriya, 2000).
4. Conclusion
The result of study clearly reports the accuracy and reliability of the biomass estimations in birch (Betula utilis) trees grown in northern parts of Pakistan. The study provides not only the information about the total above and below ground biomass of birch tree but also contribution of each tree component (Stem, branches, sub branches
Table 3. Stem volume (m3) of Betula utilis as function of diameter (cm).
Table 4. Mean Biomass (kg∙tree−1)of tree components in Betula utlis at different diameters (cm).
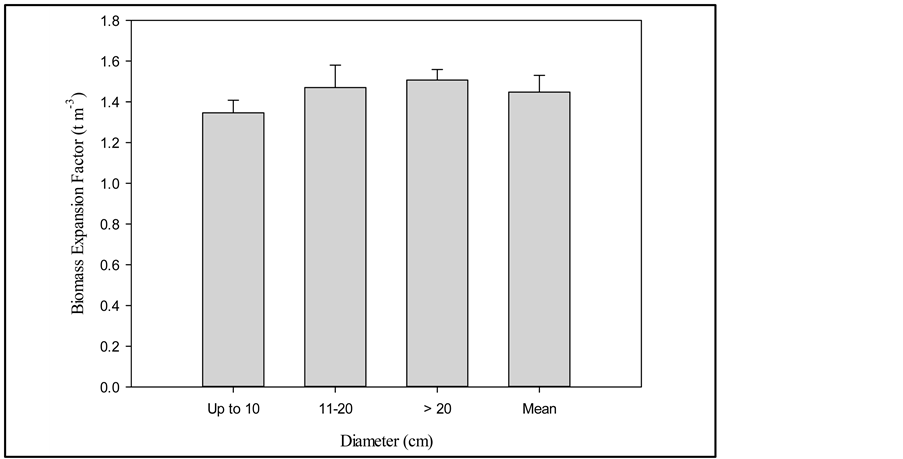
Figure 3. Relationship between BEF (t∙m−3) and diamter (cm) of the Betula utilis tree.

Figure 4. BEF as a function of diameter (cm).
leaves and roots) in total tree biomass. Moreover the regression analysis showed the relationship between diameter and biomass of each tree component. BEF calculated specifically that birch trees (Betula utlis) could form a useful tool for assessing tree compartments biomasses in future studies. This study showed that average contribution of stem portion of the tree was 42.65% of the total tree biomass; large branches showed 39.22%, sub branches or twigs 13.54% and leaves 4.59%. The below ground (roots) biomass was 16.65% of the total above ground biomass of the tree. So, it was found that the major part of the total tree biomass was present in the stem portion of B. utilis. Total volume of the tree was also found to be dependent on the diameter of the tree. The mean stem volumes were 0.018255 ± 0.005 m3, 0.15733 ± 0.012998 m3 and 0.15733 ± 0.036338 m3 at the diameter classes up to 10, 11 - 20 and greater than 20 cm respectively. The study revealed that the biomass expansion factor ranged from 1.34 to 1.5 t∙m−3 which is in acceptable limits. Prepared biomass expansion factor will be helpful in estimating productivity, carbon stocks and yield of the forest in future studies.
References
- Abbas, M., Nizami, S. M., Saleem, A., Gulzar, S., & Khan, I. A. (2011). Biomass Expansion Factors of Olea ferruginea (Royle) in Sub-Tropical Forests of Pakistan. African Journal of Biotechnology, 10, 1586-1592.
- Bhat, K. M. (1982). A Note on Cellular Proportions and Basic Density of Lateral Roots in Birch. IAWA Journal, 3, 89-94. http://dx.doi.org/10.1163/22941932-90000756
- Bonnie, R. H. (2009). Biomass Compositional Analysis for Application. Methods in Molecular Biology, 581, 145-167. http://dx.doi.org/10.1007/978-1-60761-214-8_11
- Cairns, M. A., Brown, S., Helmer, E. H. & Baumgardner, G. A. (1997). Roots Biomass Allocation in the World’s Upland Forests. Oecologia, 111, 1-11. http://dx.doi.org/10.1007/s004420050201
- Cruzado, P. C., & Roque, R. S. (2011). Improvement in Accuracy of Aboveground Biomass Estimation in Eucalyptus nitens Plantations. Effect of Bole Sampling Intensity and Explanatory Variables. Forest Ecology and Management, 261, 2016- 2028. http://dx.doi.org/10.1016/j.foreco.2011.02.028
- Fehrmann, R., Rey, G., Alvarado-Vazquez, M. A., Pinero, J. H., & Estrada, A. R. (2005). Use of Quantitative Methods to Determine Leaf Biomass on 15 Woody Shrub Species in Northeastern Mexico. Forest Ecology and Management, 216, 359-366. http://dx.doi.org/10.1016/j.foreco.2005.05.046
- GoP (Govt. of Pakistan) (1999). District Census Report of Swat. Population Census Organization, Statistics Division, Government of Pakistan, Islamabad.
- Haripriya, G. S. (2000). Estimates of Biomass in Indian Forests. Biomass and bioenergy, 19, 245-254. http://dx.doi.org/10.1016/S0961-9534(00)00040-4
- Hussain, F. & Ilahi, I. (1991). Ecology and Vegetation of Lesser Himalayas, Pakistan. Department of Botany University of Peshawar, Pakistan. Jadoon Printing Press, Peshawar.
- IPCC (2006). Guidelines for Greenhouse Gas Inventories. Chapter 4. Agriculture, Forest and Other Land Uses, 4, 4-51.
- Jabbar, T., Khan, K., Subhani, M. S., & Akhter, P. (2009). Determination of 90 Sr in Environment of District Swat, Pakistan. Journal of Radio Analytical and Nuclear Chemistry, 279, 377-384. http://dx.doi.org/10.1007/s10967-007-7277-5
- Jonathan, C. O. (2004). Above-Ground Biomass Production and Biomass Equations for Even-Aged Gmelina arborea (ROXB) Plantations in South-Western Nigeria. Biomass & Bioenergy, 2, 39-46.
- Jusoh, M. A., Abbas, Z., Lee, K. Y., You, K. Y., & Norimi, A. M. (2011). Determination of Moisture Content in Mortar at Near Relaxation Frequency 17 GHz. Measurement Science Review, 11, 203-206. http://dx.doi.org/10.2478/v10048-011-0031-0
- Kantola, A., & Makela, A. (2006). Development of Biomass Proportions in Norway Spruce (Picea abies [L.] Karst.). Trees, 20, 111-121. http://dx.doi.org/10.1007/s00468-005-0018-2
- Kurz, W. A., Beukem, S. J., & Apps, M. J. (1996). Estimation of Root Biomass and Dynamics for the Carbon Budget Model of the Canadian Forest Sector. Canadian Journal of Forest Research, 26, 1973-1979. http://dx.doi.org/10.1139/x26-223
- Levy, P., Hale, S., & Nicoll, B. (2004). Biomass Expansion Factors and Root:Shoot Ratios for Coniferous Tree Species in Great Britain. Forestry, 77, 421-430. http://dx.doi.org/10.1093/forestry/77.5.421
- Lowe, H., Seufert, G., & Raes, F. (2000). Comparison of Methods Used within Member States for Estimating CO2 Emissions and Sinks According to UNFCCC and EU Monitoring Mechanisms: Forest and Other Wooded Land. Biotechnology, Agronomy, Society and the Environment, 4, 315-319.
- Marklund, L. G. (1988). Biomass Functions for Pine, Spruce and Birch in Sweden. Swed. Uni. of Agric. Sciences, Dept. of For. Surv., Report, 45, 73.
- Muhammad, Q., Hubacek, R., Termansen, M., & Khan, A. (2011). Spatial and Temporal Dynamic s of land use pattern in District Swat, Hindu Kush Himalayan Region of Pakistan. Applied Geography, 31, 820-828. http://dx.doi.org/10.1016/j.apgeog.2010.08.008
- Nizami, S. M., Livesley, S., Mirza, S. N., Arndt, S., Fox, J. C., Khan, I. A., & Mahmood, T. (2009). Estimation of Carbon Stocks in Subtropical Forest of Pakistan. Pakistan Journal of Agricultural Sciences, 44, 166-172.
- Peter, S., Christina, L., Michael, L., & Christian, A. (2012). Biomass Allocation to Roots and Shoots Is More Sensitive to Shade and Drought in European Beech than in Norway Spruce Seedlings. Forest Ecology and Management, 266, 246-253. http://dx.doi.org/10.1016/j.foreco.2011.11.017
- Peter, T. R. (2008). Forest Biomass of Living Merchantable Tree in Nova Scotia. Nova Scotia Department of Natural Resources, 4.
- Philips, M. S. (1994). Measuring Trees and Forests (2nd ed.). Wallingford: CAB International.
- Rashid, A., Swati, F. M. Sher, H., & Al-Yemeni, M. N. (2011). Phytoecological Evaluation with Detail Floristic Appraisal of the Vegetation around Malam Jabba, Swat, Pakistan. Asian Pacific Journal of Tropical Biomedicine, 1, 461-467. http://dx.doi.org/10.1016/S2221-1691(11)60101-9
- Razakamanarivo, H. R., Razakavololona, A., Razafindrakoto, M. A., Vieilledent, G., & Albrecht, A. (2011). Below-Ground Biomass Production and Allometric Relationships of Eucalyptus Coppice Plantation in the Central Highlands of Madagascar. Biomass and Bioenergy, 45, 1-10. http://dx.doi.org/10.1016/j.biombioe.2011.01.020
- Stanek, W., & State, D. (1978). Equations Predicting Primary Productivity (Biomass) of Trees, Shrubs and Lesser Vegetation Based on Current Literature (Vol. 183). Pacific Forest Research Centre, BC-X, Canadian Forestry Service.
- Swamy, S. L., Kushwaha, S. K., & Puri, S. (2003). Tree Growth, Biomass, Allometry and Nutrient Distribution in Gmelina arborea Stands Grown in Red Lateriticsoils of Central India. Biomass and Bioenergy, 26, 305-317. http://dx.doi.org/10.1016/j.biombioe.2003.08.007
- Takuya, K., Matsuura, Y., Osawa, A., Abaimov, A. P., Zyryanova, O. A., Isaev, A. P. Yefremov, D. P., Mori, S., & Koike, T. (2006). Size-Mass Allometry and Biomass Allocation of Two Larch Species Growing on the Continuous Permafrost Region in Siberia. Forest Ecology and Management, 222, 314-325. http://dx.doi.org/10.1016/j.foreco.2005.10.031
- Uri, V., Varik, M., Aosaar, J., Kanal, A., Kukumägi, M., & Lõhmus, K. (2012). Biomass Production and Carbon Sequestration in a Fertile Silver Birch (Betula pendula Roth) Forest Chronosequence. Forest Ecology and Management, 267, 117- 126. http://dx.doi.org/10.1016/j.foreco.2011.11.033
- Vann, D. R., Palmiotto, P. A., & Strimbeck, G. R. (1998). Allometric Equations for Two South American Conifers, Test of a Non-Destructive Method. Forest Ecology and Management, 106, 55-71. http://dx.doi.org/10.1016/S0378-1127(97)00215-6
- Veronica, G., Luis, P. P., & Gerardo, R. (2010). Allometric Relations for Biomass Partitioning of Nothofagus antarctica Trees of Different Crown Classes over a Site Quality Gradient. Forest Ecology and Management, 259, 1118-1126. http://dx.doi.org/10.1016/j.foreco.2009.12.025
- Wang, J. R., Letchford, T., Comeau, P., & Kimmins, J. P. (2000). Above and Below Ground Biomass and Nutrient Distribution of a Paper Birch and Subalpine Fir Mixed-Species Stand in the Sub-Boreal Spruce Zone of British Columbia. Forest Ecology and Management, 130, 17-26. http://dx.doi.org/10.1016/S0378-1127(99)00193-0
- Wenyao, L., Fox, J. E. D., & Xa, Z. (2002). Biomass and Nutrient Accumulation in Montane Evergreen Broad-Leaved Forest (Lithocarpus xylocarpus Type) in Ailao Mountains, SW China. Forest Ecology and Management, 158, 223-235. http://dx.doi.org/10.1016/S0378-1127(00)00716-7