Open Journal of Acoustics
Vol. 3 No. 2A (2013) , Article ID: 33429 , 8 pages DOI:10.4236/oja.2013.32A002
Photoacoustic Imaging with a Line-Focus Laser Beam for Rapid Inspection and Tomographic Characterization of Simulated Surface and Undersurface Defects
Graduate School of Engineering, Tohoku Gakuin University, Tagajo, Japan
Email: *tpth@tjcc.tohoku-gakuin.ac.jp
Copyright © 2013 Tsutomu Hoshimiya, Mika Hatake-Yama. This is an open access article distributed under the Creative Commons Attribution License, which permits unrestricted use, distribution, and reproduction in any medium, provided the original work is properly cited.
Received April 17, 2013; revised May 17, 2013; accepted May 24, 2013
Keywords: Imaging; Photoacoustic; Tomography; Line-Focus Beam
ABSTRACT
A photoacoustic (PA) imaging apparatus using a laser line-focus beam (LFB) was designed to perform rapid inspection and photoacoustic tomographic (PAT) imaging of surface and undersurface defects. 2D-PAT imaging of surface and undersurface defects was demonstrated based on a formulation similar to the X-ray tomography. The obtained PAT images represented forward-projected PA signals collected along the LFB. The reconstructed images were in close agreement with those obtained from laser point-focus beam (PFB) PA imaging. We achieved rapid non-destructive inspection of a surface-simulated defect using a LFB. The reconstructed PA image of the undersurface defect was consistent with that obtained by a plane-thermal wave diffraction model.
1. Introduction
The photoacoustic microscope (PAM) is a useful tool for non-destructive imaging [1-3] and quantitative measurements [4] of surface defects in solid specimens. Previously, the use of a line-focus laser beam for inspecting welded metal plates by photoacoustic (PA) imaging was proposed [5]. The advantages of quick inspection by a line focus beam (LFB) were previously demonstrated in photothermal reflection [6].
The invention of X-ray computed tomography (CT) [7] introduced the inverse problem [8] to imaging. It has been applied in photoacoustic imaging as thermal-wave or photoacoustic tomography (PAT) through the 1990s and early 2000s using a point-focus laser beam by several groups [9-14]. The PAT technique was developed primarily for time-domain 3D imaging in liquids [15-17], such as in medicine [18]. A general theory for PAT [19] and a review paper on the PAT inverse problem [20] have been published. However, tomographic algorithms for surfaces perpendicular to the direction of laser beam propagation have not been investigated until now.
Recently, we found an equivalence between X-ray CT and 2D-PAT using a LFB [21,22]. Here we formulate the PAT theory for surface and undersurface defects simulated on a plane metal specimen from a fundamental viewpoint [23]. Measurements using a LFB can shorten the inspection time while keeping the resolution similar to that of a point-focus beam. In addition, pattern matching can be performed to compare with a known image of the defect. We studied PAT imaging of surface and under surface defects with LFB laser irradiation theoretically, performed it experimentally, and then created a reconstruction. Finally, we compared the reconstructed image of an undersurface defect with that obtained in a conventional PA imaging system using a point-focus laser beam.
2. Basic Principles
2.1. Surface Defect Imaging with LFB and Its Equivalence to X-Ray Computed Tomography (CT)
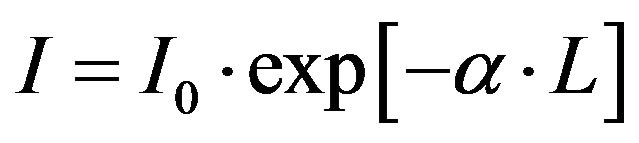
For both light and X-rays, Lambert-Beer’s law
 (1)
(1)
holds, where L, α,  and I are the specimen length and absorption coefficient, and radiation incident and transmitted intensities, respectively. If we divide the absorption distribution along the path into small cells, the total absorption along the line is the sum of the absorption coefficients. This is the basic principle of X-ray CT.
In X-ray CT [7], the distribution of the X-ray absorption coefficient  is related to a measured quantity, called the “forward projection” (also called the “Radon transform” [7,13]). This is defined as the sum of absorption coefficients along the propagation line. It is a function of the inclination angle θ and scanning step X along an axis inclined from the X-axis, as shown in Figure 1.
 (2)
(2)
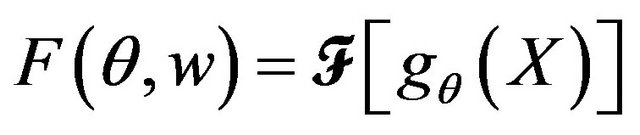
The 1D Fourier transform of the forward projection is defined as
 (3)
(3)
where the parameter w is the 1D Fourier transform of the forward scanned step X. The distribution of the X-ray absorption coefficient  is reconstructed from
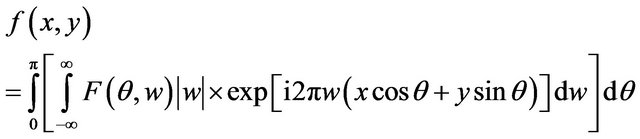 (4)
(4)
This process, which recovers the original distribution, is called the “inverse Radon transform” [7,24].
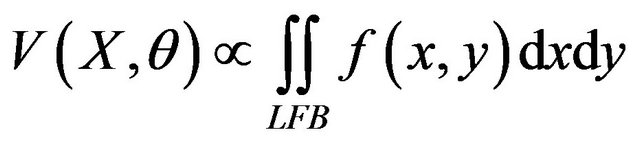
In photoacoustic spectroscopy, the PA signal in opaque solids (including metals) is generally proportional to the product of the absorption coefficient α of the specimen (assuming that the surface defect is an equivalent surface absorber) and laser intensity I0, and inversely proportional to the modulation frequency f. Then, the obtained signal for the PAT, in which the laser LFB is focused on the specimen surface and the PA signal is forward-projected over the specimen surface along a LFB, is
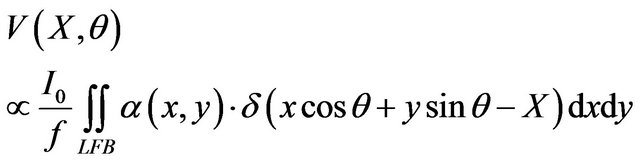 (5)
(5)
where summation is along the LFB.
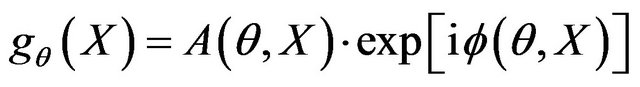
In photoacoustic imaging, it is known that the obtained PA amplitude and phase images  and
and  are coupled together as a form of (6) [1,25], therefore the PA amplitude and phase images
  and
and  obtained from the PAT measurement are related to the forward projection (2) as
 (6)
(6)
There is no need to take the logarithm of the output X-ray intensity as in X-ray CT. The obtained set of PA amplitude and phase signals itself is a forward projection. The equivalence between 2D-PAT and X-ray CT is shown schematically in Figure 2.
2.2. Undersurface PAT Imaging
In photoacoustic (PA) imaging of undersurface defects, periodic thermal diffusion in a solid should be considered. It is governed by the Green’s function Equation [1]
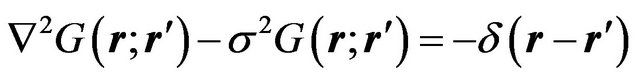 (7)
(7)
where the complex parameter σ is defined in terms of the thermal conductivity σ, density ρ, heat capacity c, and modulation frequency f as
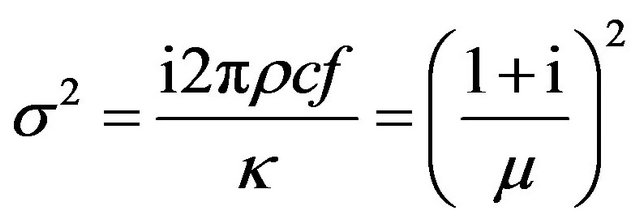 (8)
(8)
where μ is the thermal diffusion length. The Green’s function in free space is the spherical wave with complex wave number σ
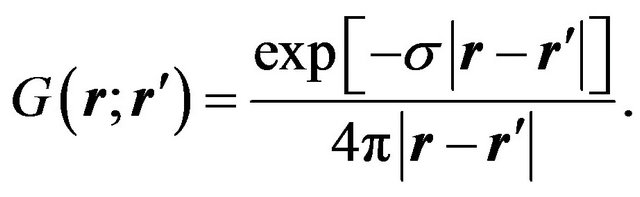 (9)
(9)
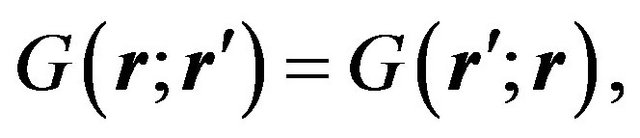
When a condenser microphone is used as the detector in undersurface imaging, it will collect all sounds generated over the whole specimen surface by the thermal wave diffracted at the undersurface defect. By the reciprocal property of the Green’s function
In photoacoustic (PA) imaging with a condenser microphone by a point-source laser beam is equivalent to single-point detection of the plane thermal wave generated from the whole surface that is diffracted from the undersurface defect [2].
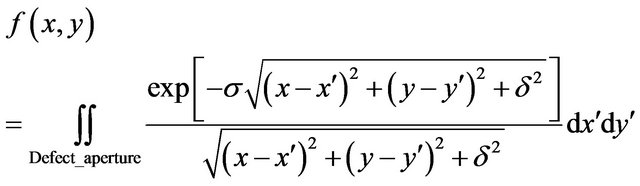
Hence PA imaging with LFB excitation and condenser microphone detection is equivalent to collecting the PA signal along a laser beam line, which is generated by a diffracted plane thermal wave at the undersurface defect located at a depth δ. As a result, the detected PA signal generated by LFB laser irradiation is described by (see Equation (10) below):
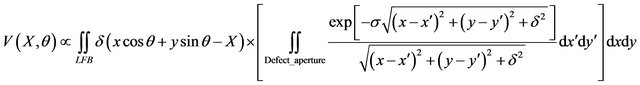 (10)
(10)
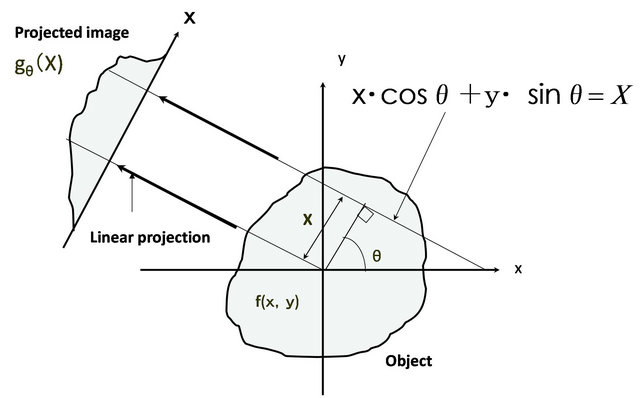
Figure 1. The forward projection process.
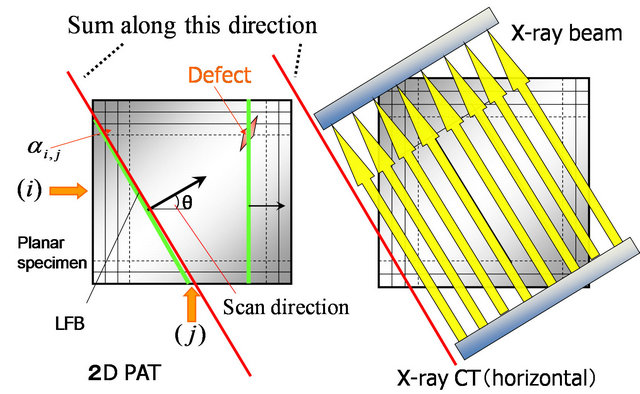
Figure 2. Equivalence between 2D PAT and X-ray CT.
where X and θ are the step position and inclination angle, respectively. In Equation (10), integration is performed along all  points on the LFB. A plane wave diffraction formula [26] along all
  points on the LFB. A plane wave diffraction formula [26] is assumed in the derivation of (10).
We rewrite (10) as
 (11)
(11)
The function  is defined as the second term integral in the bracket in (10)
 (12)
(12)
It represents the complex PA image, obtained using a point-focus laser beam. Its summation along a LFB is the PAT image.
Comparison of (11) with (5) for surface defects shows that the PAT image of the undersurface defect with a LFB is back-projected and reconstructed as a PA image corresponding to that obtained with a point focus beam using the same inverse-Radon transform algorithm [7].
3. Experimental Setup
The basic experimental set up is shown in Figure 3. The hardware and software for the photo acoustic microscope (PAM) is similar to that described elsewhere [27]. A second harmonic green laser beam (532 nm) of a LD-pumped YAG laser was expanded and focused on a specimen by concave-convex and cylindrical lenses, respectively. Mechanical rotating and stepping stages, controlled by a computer, were used to rotate and translate the laser beam on the specimen surface for rapid inspection and CT scanning.
The control software for the laser was written using LabVIEWTM (National Instruments). The laser angle was set to 90˚ for inspection in the vertical and horizontal (2 scans) or 45˚ for inspection in the vertical, horizontal and extra two diagonal directions (4 scans).
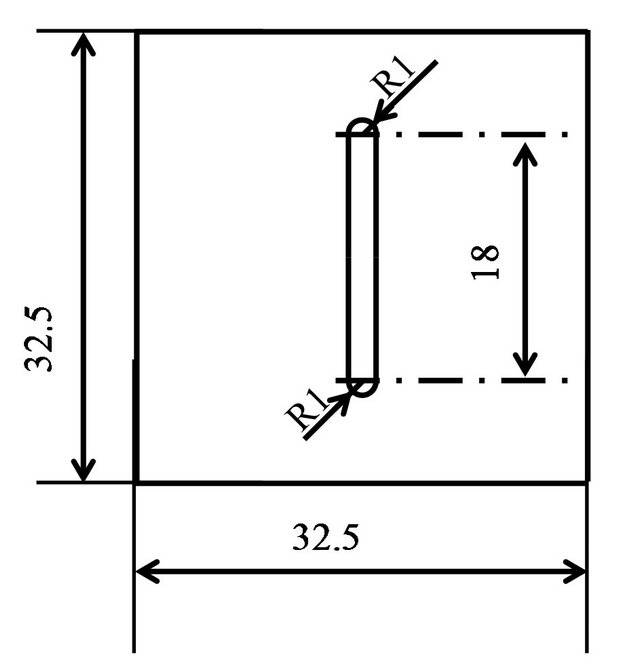
The specimen was prepared using an aluminum plate with a thickness of 2 mm. A commercial paint with a radiative coefficient of 0.94 was sprayed on the alumi num plate in the shape of a cross as the blackbody absorber. The lengths and widths of each arm of the cross were 4 mm, to modulate the absorption coefficient on the specimen surface. A 32.5 × 32.5 mm2 aluminum plate of thickness 2.0 mm was used as the metal specimen. At the center of its lower surface, a slit-shaped, 1.7 mm deep groove of area 18 × 2 mm2 was added, to make a small-depth shallow undersurface defect with a thickness of 0.3 mm depth. The surface and undersurface specimens are shown in Figures 4(a) and (b), respectively.
Because the blackbody paint absorbed the laser beam at the surface, the simulated surface defect became a near-ideal surface line heat source. As shown in la-sergenerated ultrasound studies [28,29], a fundamental frequency doubled YAG laser is reflected more than 90% at the aluminum metal surface, with the remaining 10% absorbed by the surface. We therefore also assumed that a line heat source was generated in the undersurface defect case. Thus, a surface line heat source existed for both surface and undersurface defects, and CT algorithms along the specimen surface were valid.
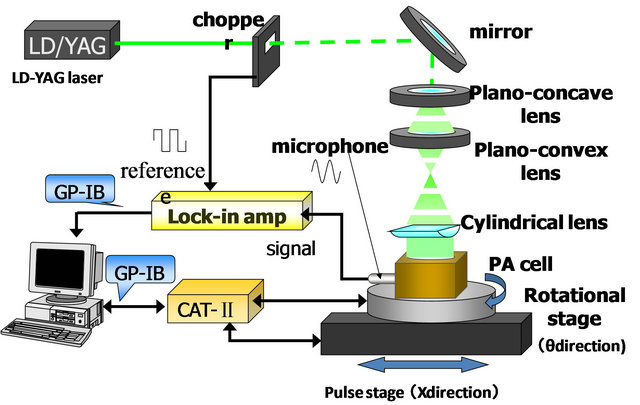
Figure 3. Basic experimental set up.
 (a)
(a)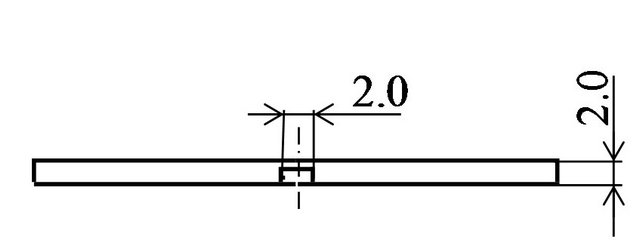 (b)
(b)
Figure 4. (a) Simulated surface defect; (b) Simulated under surface defect.
4. Experimental Results and Discussions
4.1. Rapid Inspection Using LFB
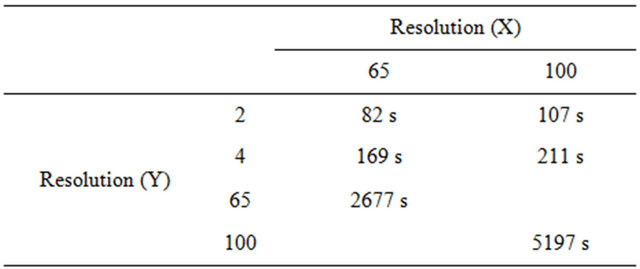
In the non-destructive evaluation (NDE) of undersurface defects or specimens such as welded plates, PA measure ment by a laser LFB can provide macroscopic information on the internal status of the specimen quicker than that by a PFB [10]. During rapid pattern-matching inspection by a LFB that scans in the horizontal and vertical only, the measurement time for 65 steps was 1 min, 22 s (82 s). In comparison, the time needed to acquire a PAT forward-projected image with 65 steps along 65 directions was 4 min, 37 s (277 s). Thus, about a three-fold more rapid inspection was achieved compared with the PAT inspection.
For comparison, the time required for the PAM measurement using a 65 × 65-step scan is 1 h, 16 min, 39 s (4599 s). The measurement time was thus about 56 times that needed for the PA LFB. Even with diagonal scans added, the time needed for 4 (vertical, horizontal and two diagonal) scans with 65 steps was 2 min, 49 s (169 s). The times needed for PAT and PAM measurements at different resolutions are summarized in Table 1.
4.2. PAT Operation
In the PAT measurements for the simulated surface and undersurface specimens, the power and size of the laser beam on the specimen was 30 mW and 25 mm at 650 µm, respectively. The modulation frequencies for surface and undersurface defect measurements were 390 and 30 Hz, respectively. The measured area was 27 × 27, while the reconstructed area was 18 × 18 mm2. The rotation and translation steps were 1.8˚ (π/100) and 270 µm (27 mm/100), respectively. The measurement time was 87 min. The laser beam was uniform to within 5%.
To compare the image resolution, a point-focus laser beam with a power and spot size of 80 mW and 30 µm, respectively, was used. The modulation frequencies for the surface and undersurface defect measurements were the same as for the PAT measurements. The resolution was 100 × 100 pixels, which was set equal to that of the PAT measurement.
The translation steps were 270 µm (27 mm/100) in both the x and y directions. The measurement time in this case was 135 min.
4.2.1. Surface Defect Imaging Using PAT
PAT measurements were performed and the obtained PA amplitude image obtained as a function of step X (ordinate) and inclination angle (abscissa), as shown in Figure 5. When the inclination angle was zero (at 90 and 180˚), signals were maximum at the center (X = 0), as expected. However, when θ = 45˚, the PA signal had two peaks. This occurred because the LFB overlap was maximal when it coincided on the diagonals of two adjacent cross arms.
 (a)
(a)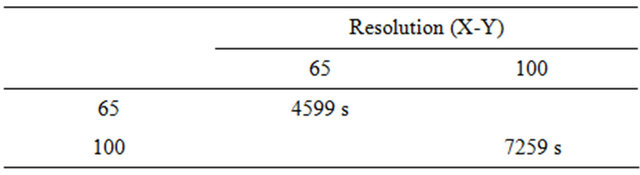 (b)
(b)
Table 1. Times needed for PAT measurements for resolution combination (translation steps versus angle steps) and those of PAM measurements for corresponding resolution. (a) PAT; (b) PAM.
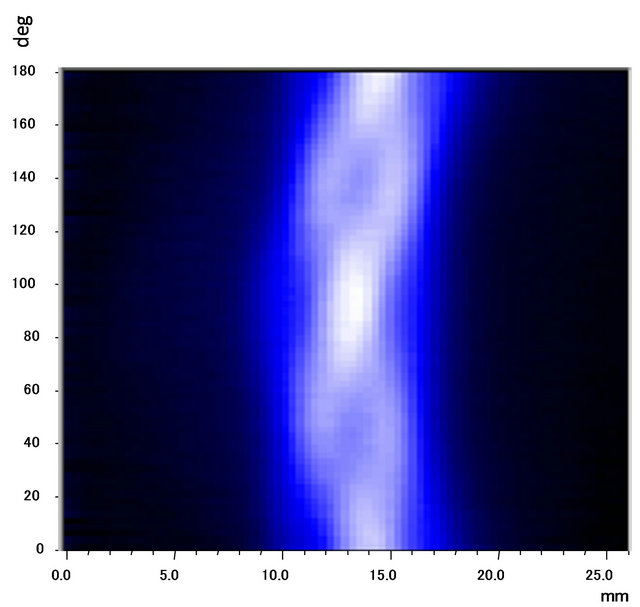

Figure 5. Obtained tomographic amplitude image for simulated surface defect, f = 390 Hz, P = 30 mW.
We reconstructed the absorption distribution by calculating the 1D Fourier transform of the forward projection and step X with respect to the variable X, using (7) and (8), and then calculating the inverse Fourier transform (9) using the MATLAB software. Previously, the backward projection procedure (table lookup, interpolation and summation over the angle θ) had been performed manually using the standard inverse-Radon transform.15) We used the inverse-Radon transform software included in the “Image Processing Toolbox” of MATLAB for image reconstruction, and the utility software “Origin” to plot the calculated data. The reconstructed image is shown in Figure 6. For comparison, we also performed PAM measurements with a point-focus laser beam. The result is shown in Figure 7.
The shape of the reconstructed image is similar to the original absorption distribution (cross). However, the resolution of the reconstructed image is lower than that of the PAM image. Making the laser beam distribution uniform and improving the reconstruction software are problems for future research.
4.2.2. Undersurface Defect Imaging with PAT
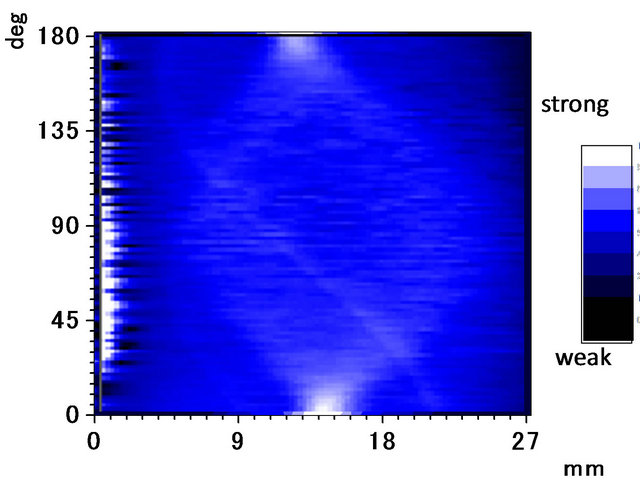
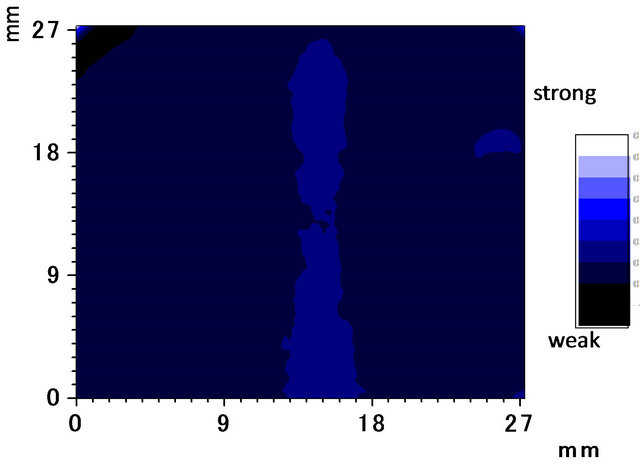
Amplitude and phase images obtained by PAT of simulated undersurface defects measured at 30 Hz are shown in Figures 8(a) and (b), respectively. The reconstructed or backward-projected amplitude and phase images are shown in Figures 9(a) and (b), respectively.
In the undersurface defect experiment, changing the thermal diffusion length (see Equation (8)) and modu-
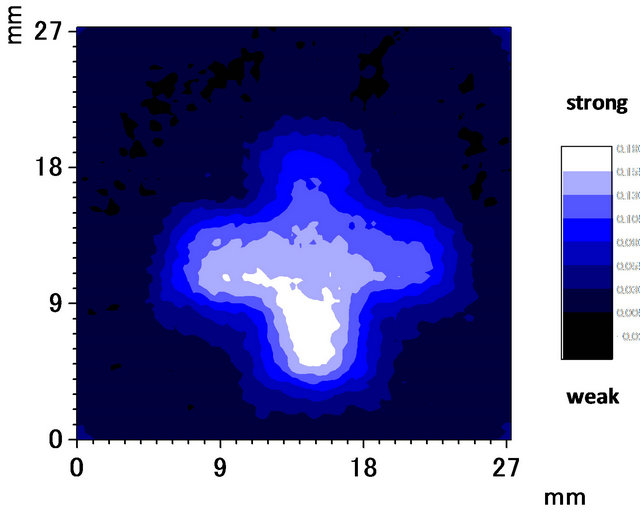
Figure 6. Reconstructed image. Measured area: 27 × 27 mm/calculated area: 18 × 18 mm.
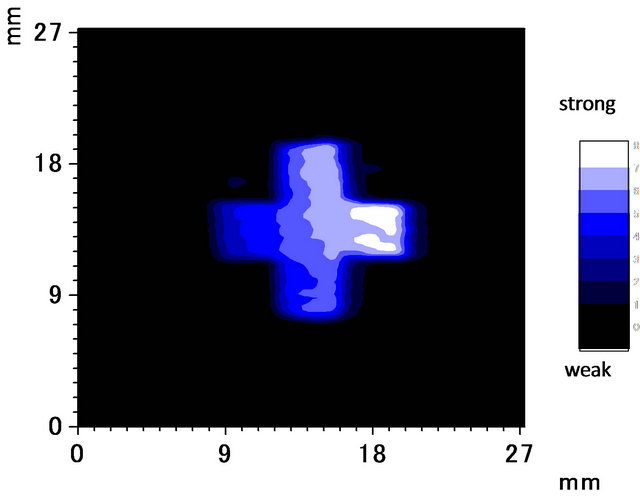
Figure 7. Photoacoustic amplitude image for simulated surface defects obtained using a PFB with the same apparatus, f = 390 Hz, P = 80 mW.
lation frequency for a fixed distance between the surface and top of undersurface defect corresponded to changing the optical wavelength, but not the slit size or distance from the diffraction slit to the observation point.
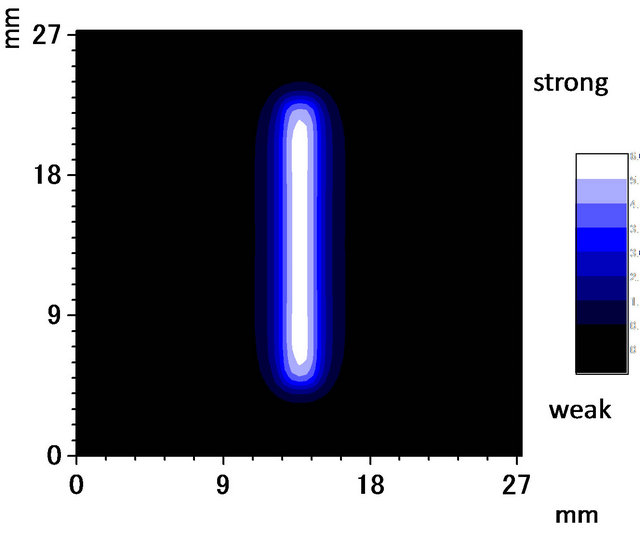
The simulation was performed by dividing the slitshaped undersurface defect into 73 × 9 points. It was assumed that spherical waves were emitted towards the detection surface from each point. Simulated amplitude and phase images are shown in Figures 10(a) and (b), respectively. The reconstructed images agreed with the simulated images calculated by the method described above.
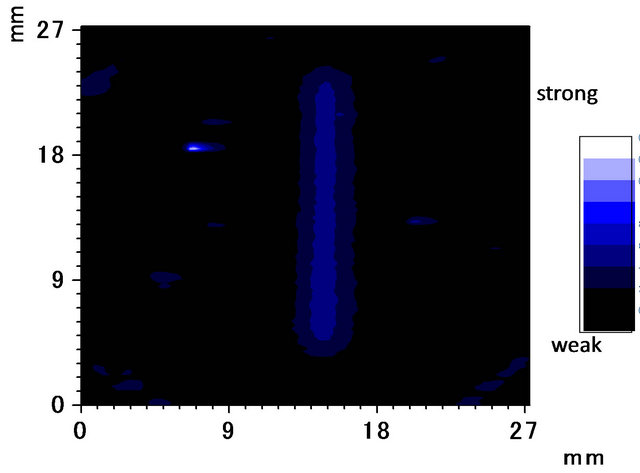
For comparison, we performed conventional PAM imaging of the undersurface defect using a point-focus laser beam at a modulation frequency of 30 Hz. The PAM amplitude and phase images of the specimen were taken. They are shown in Figures 11(a) and (b), respecttively.
5. Conclusion
In conclusion, we have designed and constructed an PA apparatus with a LFB which can work both PAT imaging apparatus and a rapid inspection tool with a limited number of scanning for the surface and undersurface defects. We present a unified theoretical formulation of
 (a)
(a)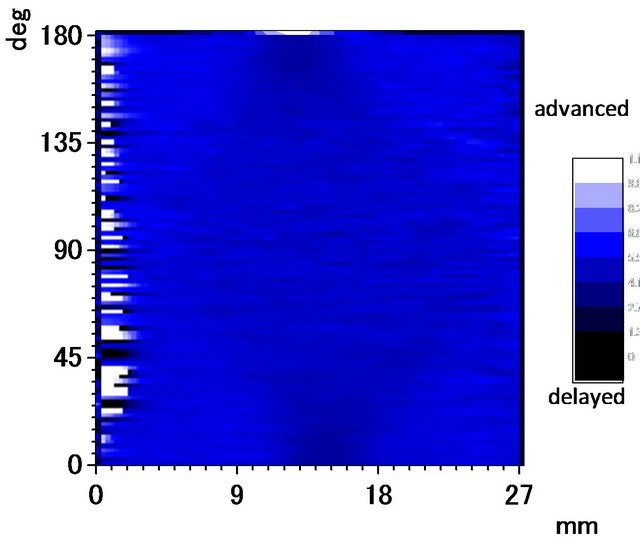 (b)
(b)
Figure 8. (a) Obtained tomographic amplitude (upper) and (b) Phase (lower) images for simulated undersurface defect, f = 30 Hz, P = 30 mW.
 (a)
(a)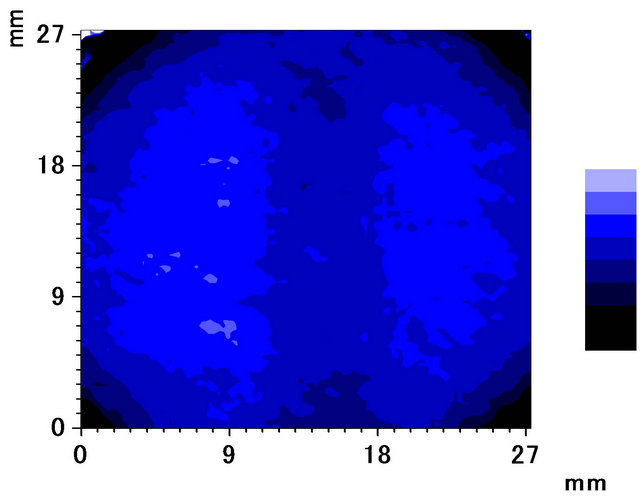 (b)
(b)
Figure 9. Reconstructed (a) amplitude (upper) and (b) phase (lower) images.
 (a)
(a)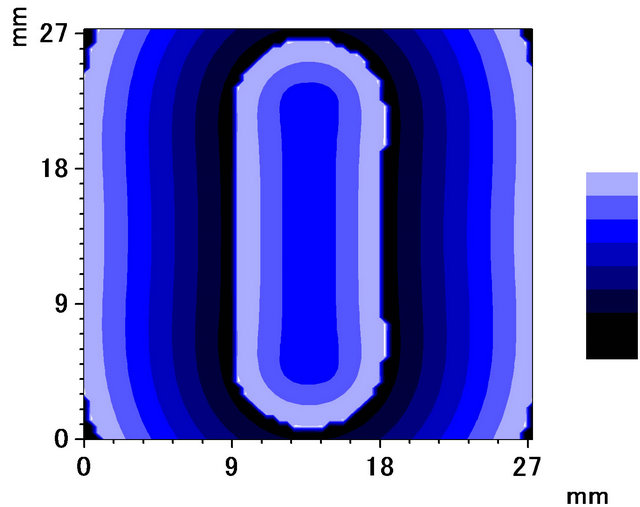 (b)
(b)
Figure 10. (a) Simulated amplitude (upper) and (b) phase (lower) images.
 (a)
(a)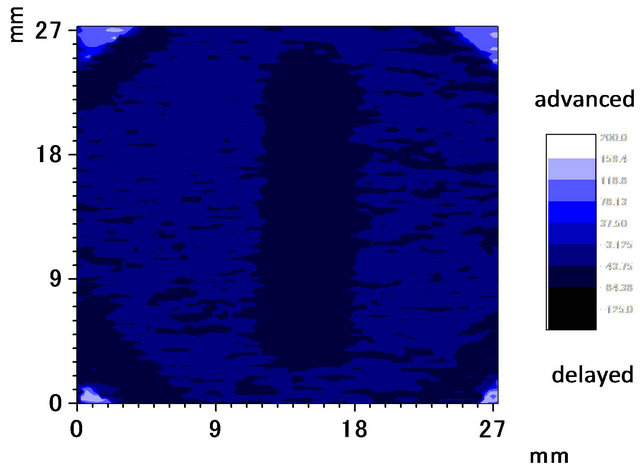 (b)
(b)
Figure 11. (a) Photoacoustic amplitude image for laser simulated undersurface defect obtained using a point-focus beam and the same apparatus (upper); (b) Corresponding phase image (lower) for f = 30 Hz, P = 80 mW.
PAT with LFB for both simulated surface and undersurface defects. Performing PAT experiments for the defects, it was found that the reconstructed images had high fidelity in terms of the apparatus and a rapid inspection tool with a limited number of scanning for the surface and undersurface defects. We present a unified theoretical formulation of PAT with LFB for both simulated surface and undersurface defects. Performing PAT experiments for the defects, it was found that the reconstructed images had high fidelity in terms of the absorption distribution and defect shape. They also agreed closely with measurements performed using a pointfocus PAM and images calculated using an optical model for thermal wave diffraction.
6. Acknowledgements
We are grateful to Prof. H. Endoh of Tohoku Gakuin University (TGU) for his help and discussion of the experiment. We also thank graduate students N. Ohtaki and T. Takatsu for their help with the experiments. TH also thanks Prof. A. Harata of Kyusyu University for sharing Dr. M. Kasai’s unpublished work on PAT, which was part of his Ph.D. thesis [30]. MH is grateful to Prof. T. Hoshimiya for guiding her research throughout the graduate course, and to T. Kanno for his help with the experiments.
REFERENCES
- R. L. Thomas, J. J. Pouch, Y. H. Wong, L. D. Favro, P. K. Kuo and A. Rosencwaig, “Subsurface Flaw Detection in metals by Photoacoustic Microscopy,” Journal of Applied Physics, Vol. 51, No. 2, 1980, pp. 1152-1156. doi:10.1063/1.327726
- K. R. Grice, L. J. Ingelhart, L. D. Favro, P. K. Kuo and R. L. Thomas, “Thermal Wave Imaging of Closed Cracks in Opaque Solids,” Journal of Applied Physics, Vol. 54, No. 11, 1983, pp. 6245-6255. doi:10.1063/1.331942
- N. Ohtaki, M. Hatake-yama, M. Suzuki, H. Endoh, T. Hoshimiya, M. Kawakami, Y. Muraki, T. Nakajima, A. Tominaga and M. Takeshi, “Nondestructive Image Evaluation of Welded Zone of Steel Plate by Photoacoustic Microscope,” Japanese Journal of Applied Physics, Vol. 46, No. 7B, 2007, pp. 4613-4615. doi:10.1143/JJAP.46.4613
- T. Hoshimiya, H. Endoh and Y. Hiwatashi, “Observation of Surface Defects Using Photoacoustic Microscope and Quantitative Evaluation of the Defect Depth,” Japanese Journal of Applied Physics., Vol. 35, No. 5B, 1996, pp. 2916-2920. doi:10.1143/JJAP.35.2916
- T. Hoshimiya, M. Hatake-Yama, N. Ohtaki and H. Endoh, “On the Photoacoustic Nondestructive Instrumentation with a Line-Focus Laser Beam and a Planar Specimen Combination,” Proceedings of the 26th Symposium on Ultrasonic Electronics (Tokyo), 2005, pp. 321-322.
- T. Nakata, H. N. Kobayashi and T. Ninomiya, “Heiretsu Reiki isou Shihuto Sekibunn Kennsyutsuhou wo Mochiita Kousoku Hikari Netsu Henni Kennbikyou no Kentou (Study on High-Speed Photothermal Displacement Microscopy Using Parallel Excitation and Phase-Shifting Signal Integration),” Abstract of the 14th Symposium on Ultrasonics Electronics (Yokohama), 1993, 81-82 (in Japanese).
- A. C. Kak and M. Slaney, “Principles of Computerized Tomographic Imaging,” IEEE Press, Piscataway, 1988.
- D. N. G. Roy, “Methods of Inverse Problems in Physics,” CRC Press, Boston, 1991.
- L. Nicolaides, M. Munidasa and A. Mandelis, “Thermal- Wave Infrared Radiometric Slice Diffraction Tomography with Back-Propagation and Transmission Reconstructions: Experimental,” Inverse Problems, Vol. 13, No. 5, 1997, pp. 1413-1425. doi:10.1088/0266-5611/13/5/019
- L. Nicolaides and A. Mandelis, “Image-Enhanced ThermalWave Slice Diffraction Tomography with Numerically Simulated Reconstruction,” Inverse Problems, Vol. 13, No. 5, 1997, pp. 1393-1412. doi:10.1088/0266-5611/13/5/018
- O. Pade’ and A. Mandelis, “Computational Thermal Wave Slice Tomography with Back Propagation and Transmission Reconstructions,” Review of Scientific Instruments, Vol. 64, No. 12, 1993, p. 3548. doi:10.1063/1.1144282
- O. Pade’ and A. Mandelis, “Thermal Wave Slice Tomography Using Wave Field Reconstruction,” Inverse Problems, 10, No. 1, 1994, pp. 185-197. doi:10.1088/0266-5611/10/1/014
- L. D. Favro, H. J. Jin, P. K. Kuo, R. L. Thomas and Y. X. Wang, “Real Time Thermal Wave Tomography,” Proceedings of the Seventh International Topical Meeting on Photoacoustic and Photothermal Phenomena, Doorwerth, 1991, pp. 519-521.
- R. L. Thomas, L. D. Favro, H. J. Jin, P. K. Kuo and Y. X. Wang, “Pulse-Echo Thermal Wave Tomography,” Proceedings of 14th International Congress Acoustics, Beijing, 1992, p. A13-8.
- K. P. Koestil and P. C. Beard, “Two-Dimensional Photoacoustic Imaging by the Use of Fourier-Transform Image Reconstruction and a Detector with an Anisotropic Response,” Applied Optics, Vol. 42, No. 10, 2003, pp. 1899-1908. doi:10.1364/AO.42.001899
- S. J. Norton and T. Vo-Dinh, “Optoacoustic Diffraction Tomography: Analysis of Algorithms,” The Journal of the Optical Society of America, Vol. 20, No. 10, 2003, pp. 1859-1866. doi:10.1364/JOSAA.20.001859
- X. Wang, Y. Xu, and L. V. Wang, “Time-Domain Reconstruction Algorithms and Numerical Simulations for Thermoacoustic Tomography in Various Geometries,” IEEE Transactions on Biomedical Engineering, Vol. 50, No. 9, 2003, pp. 1086-1099. doi:10.1109/TBME.2003.816081
- X. Wang, Y. Pang, X. Xie, G. Stoica and L. V. Wang, “Noninvasive Laser-Induced Photoacoustic Tomography for Structural and Functional in Vivo Imaging of the Brain,” Nature Biotechnology, Vol. 21, No. 7, 2003, pp. 803-806. doi:10.1038/nbt839
- M. Xu and L. Wang, “Universal Back-Projection Algorithm for Photoacoustic Computed Tomography,” Physical Review E, Vol. 71, No. 1, 2005, pp. 016706-1-7.
- J. F. Power, “Inverse Problem Theory in the Optical Depth Profilometry of Thin Films,” Review of Scientific Instruments, Vol. 73, No. 12, 2002, pp. 4057-4141. doi:10.1063/1.1517054
- T. Hoshimiya and M. Suzuki, “Undersurface Photoacoustic Imaging of Plane Solid Specimens by the Use of a Line Laser Beam,” Proceedings of 2005 IEEE Ultrasonics Symposium, Rotterdam, 18-21 September 2006, pp. 2093-2096.
- T. Hoshimiya and M. Hatake-yama, “Photoacoustic Tomographic Characterization of Surface and Undersurface Simulated Defects with a Line-focus Laser Beam,” Proceedings of 2006 IEEE International Ultrasonics Symposium, Vancouver, 2-6 October 2007, pp. 780-783.
- P. C. Sabatier, “Inverse Problems: An Interdisciplinary Study, Advances in Electronics and Electron Physics Supplement 19,” Academic Press, Norwell, 1978.
- S. R. Deans, “The Radon Transform and Some of its Applications,” Kreager, 1993.
- T. Hoshimiya, “Simulation of Thermally-Diffused Images and a Concept of Holoscan in Photoacoustics and OpticalProbe Imaging.,” Applied Optics, Vol. 33, No. 31, 1994, 1994, pp. 7251-7257. doi:10.1364/AO.33.007251
- K. Iizuka, “Engineering Optics,” Second Edition, Chapter 3, Springer Verlag, Heidelberg, 1983.
- T. Hoshimiya and K. Miyamoto, “Applications of LinearMotor-Driven Photoacoustic Microscope,” Ultrasonics, Vol. 42, No. 1-9, 2004, pp. 993-996. doi:10.1016/j.ultras.2003.12.011
- L. R. Rose, “Point-Source Representation for Laser- Generated Ultrasound,” Journal of the Acoustical Society of America, Vol. 75, No. 3, 1984, pp. 723-732. doi:10.1121/1.390583
- G. R. Wetsel, “Photothermal Generation of Thermoelastic Waves in Composite Media,” IEEE Transactions on Ultrasonics, Ferroelectrics and Frequency Control, Vol. 33, No. 5, 1986, pp. 450-461. doi:10.1109/T-UFFC.1986.26856
- M. Kasai, “Hikarionkyou Kenbikyou ni Kansuru Kenkyu (Research on Photoacoustic Microscope),” Ph.D. Thesis of Tokyo University, Chapter 3, 1984 (in Japanese). The Part of the Thesis without the PAT Description Was Published as T. Sawada and M. Kasai, “Hikari/Densi Onkyou Kenbikyou (Photon and Electron-Beam Acoustic Microscopy)” Bunkou Kenkyu, Vol. 33, 1984, 1984, pp. 307- 319 (in Japanese).
NOTES
*Corresponding author.