Journal of Electronics Cooling and Thermal Control
Vol.05 No.01(2015), Article ID:55067,10 pages
10.4236/jectc.2015.51002
Anisotropic Thermal Diffusivity Measurements in High-Thermal-Conductive Carbon-Fiber-Reinforced Plastic Composites
Masaya Kuribara, Hosei Nagano
Department of Aerospace Engineering, Nagoya University, Nagoya, Japan
Email: nagano@nuae.nagoya-u.ac.jp
Copyright © 2015 by authors and Scientific Research Publishing Inc.
This work is licensed under the Creative Commons Attribution International License (CC BY).
http://creativecommons.org/licenses/by/4.0/


Received 3 March 2015; accepted 23 March 2015; published 26 March 2015
ABSTRACT
This paper presents the temperature dependence of in-plane thermal diffusivity and anisotropy distribution for pitch-based carbon-fiber-reinforced polymers (CFRPs). The measurement was performed using the laser-spot periodic heating method. The samples were unidirectional (UD) and crossply (CP) CFRPs. All carbon fibers of the UD samples ran in one direction, while those of the CP samples ran in two directions. In both UD and CP CFRPs, from −80˚C to +80˚C, temperature dependence of thermal diffusivity values increased as temperature decreased. In this temperature range, the anisotropic ratio between the fiber direction and its perpendicular direction of the UD CFRP was 106 - 124. During the anisotropy distribution measurement, it was found that thermal anisotropy can be visualized by scanning the laser in a circle on the sample. The thermal diffusivity of the UD CFRP in the fiber direction was 17 times larger than that in the 15˚ direction, and the thermal diffusivity in the other directions was lower than that in the 15˚ direction. The anisotropy distribution for the CP CFRP reflected its inhomogeneous structure.
Keywords:
AC Calorimetric Method, Anisotropy, Carbon-Fiber-Reinforced Polymers, High Thermal Conductivity, Thermal Diffusivity

1. Introduction
High-thermal-conductive carbon-fiber-reinforced polymers (CFRPs) have recently been proposed as base material for thermal control devices in spacecraft [1] . CFRP is a composite material composed of carbon fibers and polymers, and is characterized by light weight, high strength, and high rigidity. Two types of carbon fibers are generally used: polyacrylonitrile (PAN)-based carbon fiber and pitch-based carbon fiber. The main difference between these fibers is the carbon structure. Pitch-based CFRPs are expected to have high thermal conductivity; therefore, they can be used to develop high-end thermal control devices. Measuring the thermophysical properties of the base material is necessary for the development of new devices. CFRPs can have large anisotropy depending on the direction of the carbon fibers, and are used over a wide temperature range. Therefore, it is essential to evaluate the temperature dependence of thermal diffusivity and anisotropy distribution for CFRPs.
Many studies have been conducted on the thermal conductivity of PAN-based CFRPs [2] -[5] . Wrobel [2] reported thermal diffusivity measurements in the out-of-plane direction at room temperature for a PAN-based CFRP by a flash method. Ellis [3] measured the temperature dependence of thermal diffusivity parallel and perpendicular to the fiber directions of PAN-based carbon fibers and copper matrix composites by using a laser flash method. Mirmira [4] measured the temperature dependence of thermal conductivity for PAN-based CFRPs by using a steady method. Yamane [5] measured the temperature dependence of thermal diffusivity for PAN- based single carbon fibers by using AC calorimetry. G. Kalogiannakis [6] performed the simulation of heat diffusion in layered anisotropic materials. On the other hand, works on the measurement of thermal diffusivity of pitch-based CFRPs are scarce, in which only a few studies have evaluated directional thermal diffusivity or ther- mal conductivity [2] -[5] . Therefore, this paper presents the temperature dependence of in-plane thermal diffusivity and anisotropy distribution for pitch-based CFRPs. In the measurements, a laser-spot periodic heating method was selected to evaluate in-plane anisotropy.
2. Materials
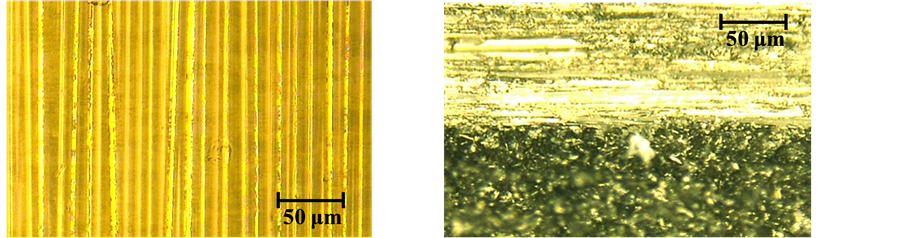
CFRP samples were fabricated by laminating prepreg sheets and curing with an autoclave. The prepreg consisted of pitch-based carbon fibers (Mitsubishi Plastics Inc., HYEJ16M90D) and epoxy resin (the final resin content was 32% by weight and the remaining was fibers). The diameter of the fibers was about 8 - 11 μm. Figure 1 shows the surface and cross-sectional surface images of the CFRP. Curing was performed at 125˚C temperature and 0.5 MPa pressure for 1.5 h. The glass-transition temperature of the material was 135˚C. The resin was composed of more than one type of epoxy resin and included the amine type. The samples were opaque. Figure 2 shows the two types of measured samples. In a CFRP, the orientation of fibers is the most important factor for the anisotropy of the material. One of the samples was unidirectional CFRP (UD, [0˚], 69 × 22 × t0.12 mm) and the other was cross-ply CFRP (CP, [0/90˚], 74 × 52 × t0.24 mm). The UD CFRP was fabricated using one prepreg sheet, in which the fibers ran in one direction. The CP CFRP was fabricated using two prepreg sheets, in which the fibers ran in two directions. Generally, the practical use of a CFRP requires more than 1 mm thickness. In this study, however, a simple structural CFRP was selected in order to clearly evaluate the anisotropy as a first step.
3. Laser-Spot Periodic Heating Method
3.1. Principles of Measurement
In case of a heat source that heats a point on a thin opaque sample with a frequency f, the AC temperature at the
 (a) (b)
Figure 1. Surface and cross-sectional surface images of CFRP. (a) Surface image; (b) Cross-sectional surface image.
 (a) (b)
Figure 2. CFRP samples. (a) UD sample; (b) CP sample.
point distant r from the heat source is expressed as follows [7] .
 (1)
(1)
where T0 is constant, and k is the inverse of the thermal diffusion length, l, expressed by Equation (2).
 (2)
(2)
At the point r, the phase lag, θ, with respect to the heat source is expressed as
 (3)
(3)
Thermal diffusivity, D, is calculated from the spatial dependence of the phase lag, dθ/dr, i.e.
![]() (4)
(4)
3.2. Restrictions on the Modulation Frequency of the Heating Source
For accurate measurement of thermal diffusivity, the heating frequency must satisfy two restrictions, depending on the sample size. First, the acceptable heating frequency is limited by the sample thickness, d. The conditional equation is expressed as Equation (5) [8] .
![]() (5)
(5)
where ld is the thermal diffusion length in the out of-plane direction. In Equation (1), one-dimensional thermal conduction is assumed. However, the actual phenomenon is two-dimensional because of the finite sample thickness. If the thermal diffusion length, ld, is much longer than the sample thickness, d, the phenomenon can be treated as one-dimensional. From Equation (5), the frequency, f, must satisfy Equation (6).
![]() (6)
(6)
where Dd is the thermal diffusivity in the thickness direction of the sample.
Second, the acceptable heating frequency is also limited by the sample length and width. The conditional equation is expressed as Equation (7) [9] .
![]() (7)
(7)
where L is the distance between the heat source and sample edge, and lL is the in-plane thermal diffusion length. In Equation (1), the sample area is assumed to be infinite. However, the actual sample area is limited; therefore, the heat flow is reflected from the sample edge. If the distance, L, is much longer than the in-plane thermal diffusion length, lL, the reflected heat flow decays and can be neglected. From Equation (7), the frequency f must satisfy Equation (8),
![]() (8)
(8)
where DL is the in-plane thermal diffusivity of the sample.
From Equations (6) and (8), the heating frequency must satisfy Equation (9).
![]() (9)
(9)
4. Experimental
Figure 3 shows a schematic of the experimental apparatus. This apparatus consists of a function generator, a lock-in amplifier, an acousto-optical modulator (AOM), a He-Ne laser, a digital voltage meter, a temperature controller, a microscope, an optical cryostat, an XY-stage, an external vacuum pump, and a computer. The function generator sends a periodic signal to the AOM and the lock-in amplifier. The He-Ne laser generates beam whose maximum output power is 10 mW. The AOM modulates the beam according to the periodic signal from the function generator. The modulated beam is focused on the sample using the microscope, and periodically heats the surface. The size of the laser spot is about 10 μm and the form is Gaussian. The sample is set in the cryostat and the interior of the cryostat is pumped to a vacuum on the order of 10−4 Pa. The temperature of the copper heat exchanger under the sample is controlled from −190˚C to +110˚C by a heater and liquid nitrogen. The temperature of the sample is controlled by radiation from the heat exchanger. The heat exchanger and sample are covered by a radiation shield, which has a hole only around the heating position in order to reduce the radiational heat loss. The 25 μm E-type thermocouple is attached to the center of the sample’s rear surface by a silver paste to measure the AC and DC temperatures of the sample. The lock-in amplifier measures the phase difference between the AC signal and reference signal. The lock-in amplifier model is SR830, from Stanford Research Systems. The DC signal is measured by the digital voltage meter to monitor the sample temperature. The temperature of the system is measured using a thermistor, which has an error of 0.5˚C. The heating position is controlled by the XY-stage; the error in the measurement of the position is 1 μm. The measurement uncertainties are within ±2.6%, as verified using stainless-steel (SRM141) and pure copper as the reference samples [10] .
Following three types of measurements were conducted.
1) Measurement of temperature dependence of thermal diffusivity over the temperature range from −80˚C to +80˚C.
2) Evaluation of repeatability in measurement at room temperature.
3) Measurement of anisotropy distribution at room temperature.
Figure 4 shows the shape of the laser path on the samples. It is necessary to define both the center of the thermocouple junction and the fiber direction. To find the center of the thermocouple junction, the laser was scanned near the junction, and the position comprising the minimum phase lag was detected. To find the fiber direction, the laser was scanned in a circle around the center of the thermocouple junction, and the direction comprising the minimum phase lag was detected.
4.1. Measurement of Temperature Dependence of Thermal Diffusivity
The laser was scanned linearly through the thermocouple and the distance dependence of the phase lag was measured as shown in Figure 4(a). The value of the heating frequency was selected within the permitted range, as calculated from Equation (9). For the calculation, the value of thermal diffusivities, Dd and DL, were obtained by preliminary measurement. For UD CFRP, the thermal diffusivity parallel to the fiber direction, DL//, was 297
![]()
Figure 3. Schematic of the experimental setup.
![]() (a) (b)
(a) (b)
Figure 4. Scanning directions on samples.
mm2/s; that perpendicular to the fiber direction, DL⊥, was 2.1 mm2/s; and that in the depth direction, Dd, was 2.1 mm2/s. For CP CFRP, the thermal diffusivity in the fiber direction, DL//, was 171 mm2/s and that in the depth direction, Dd, was 2.1 mm2/s. For UD CFRP, the allowed frequencies in the fiber direction were 1.5 - 12.8 Hz, and those in the direction perpendicular to the fiber direction were from 0.7 - 12.8 Hz. For CP CFRP, the allowed frequencies in the fiber direction were 0.61 - 3.1 Hz, and those in the direction perpendicular to the fiber direction were 1.61 - 3.1 Hz.
The measurements were conducted at temperatures from −80˚C to +80˚C. For UD CFRP, scanning directions are parallel (UD//) and perpendicular (UD⊥) to the fiber direction. For CP CFRP, scanning directions are parallel (CP//) to the fiber direction of the surface. In order to evaluate the frequency dependence of thermal diffusivity, each measurement was conducted with more than two frequencies that satisfied Equation (9). Each measurement with a certain frequency was taken two times. Table 1 lists the measurement conditions.
4.2. Evaluation of Repeatability in Room Temperature Measurements
All measurements were conducted at room temperature. In order to evaluate repeatability, each measurement at a certain frequency was conducted 20 times. In order to evaluate the frequency dependence of thermal diffusivity, each measurement was conducted with more than two frequencies that satisfied Equation (9). Table 2 lists the measurement conditions.
4.3. Anisotropy Distribution Measurements
The laser was scanned in a circle in a regular pattern of varying radius and angle, as shown in Figure 4(b). Each measurement at a certain frequency was conducted two times. Table 3 lists the measurement conditions.
5. Results and Discussions
5.1. Temperature Dependence of Thermal Diffusivity
Figure 5 shows the temperature dependence on thermal diffusivity of the UD and CP CFRP. The anisotropic ratio of the UD CFRP is also shown in Figure 5. It was found that thermal diffusivity increases as temperature decreases. This is because when temperature increases, the mean free path of the materials diminishes the length. Comparing the thermal diffusivity of UD// at −84˚C and +84˚C, the thermal diffusivity at −84˚C was 1.7 times larger than that at +84˚C. Comparing the thermal diffusivity of UD⊥ at −88˚C and +81˚C, the thermal diffusivity at −88˚C was 1.5 times larger than that at +81˚C. The anisotropic ratio, UD///UD⊥, was 106 - 124. Comparing the anisotropic ratio at −84˚C and +81˚C, the anisotropic ratio at −84˚C was 1.4 times higher than that at +81˚C. The thermal diffusivity of the CP CFRP at −88˚C was 1.7 times larger than that at +84˚C. The thermal diffusivity of the CP CFRP was larger than the average of the thermal diffusivity of UD// and UD⊥.
5.2. Repeatability in Measurement
Figure 6 shows the variation in phase lag with distance for UD//, and Figure 7 shows this variation for CP// and CP⊥. The origin of the horizontal axis is the center of the thermocouple junction. The linearity of the phase lag worsens near origin because of the depth effect described previously. The thermal diffusivity was calculated by

Table 1. Experimental parameters of measurement 1 at temperature from −80 to +80˚C.
Table 2. Experimental parameters of measurement 2.
Table 3. Experimental parameters of measurement 3.
![]()
Figure 5. Temperature dependence of thermal diffusivity and anisotropic ratio of UD and CP CFRP.
the rectilinear part of the line. The dispersion of the phase lag, which was evaluated by the double standard deviation, 2σ, was found to be within 1.3% for the UD CFRP and 2.7% for the CP CFRP.
The distance and phase difference between the laser and thermocouple were recorded at 20 points. The thermal diffusivities, D, were calculated from the corresponding phase lag, θ. The average thermal diffusivity, Dave, and double standard deviation, 2σ, were calculated from the thermal diffusivities, D. Table 4 lists Dave and 2σ of the UD// measurements. The 2σ percentages tended to be higher at high frequencies, and were within 2.6%. The
![]()
Figure 6. Relation between heating position and phase lag for UD//.

Figure 7. Relation between heating position and phase lag for CP// and CP⊥.
Dave values varied with frequency. The thermal diffusivities of low frequency measurements were lower than those of high frequency measurements. In the low frequency measurements, it is possible that the reflection of heat flow from the edge of the sample to the fiber direction has a large influence, although the heating frequency is selected within the allowed range. Table 5 lists the Dave and 2σ values of the UD⊥ measurements. The 2σ percentages were within 2.2%. The Dave values varied with frequency, although the selected heating frequency was within the allowed range.
Table 6 and Table 7 list the Dave and 2σ values of the CP// and CP⊥ measurements, respectively. The maximum 2σ percentage was 14%. Compared with UD CFRP, the 2σ percentages were relatively high. The Dave values varied with frequency, although the heating frequency was selected within the allowed range. For a frequency of 2 Hz, the average thermal diffusivity of CP⊥ was 167.7 × 10⁻⁶ m2∙s−1 and that of CP// was 153.1 × 10⁻⁶ m2∙s−1. Hence, the thermal diffusivity of CP⊥ was about 91% of that of CP//.
Two causes for the modulation frequency dependence of the measured thermal diffusivity are conceivable. First, if we measure an isotropic sample, the modulation frequency dependence of thermal diffusivity does not occur if we use an allowable modulation frequency. However, the CFRPs are composite materials and have an interfacial thermal resistance between fibers and polymer. The interfacial thermal resistance could influence the phase lag of the temperature. Second, the heat that gets conducted through the fibers could be reflected at the sample edge because the thermal conductivity of the fibers is very high. These issues require further study, and are to be addressed in the next stage of this research.
5.3. Anisotropy Distribution
Figure 8 and Figure 9 show the anisotropy distribution for UD and CP CFRP, respectively. The horizontal and
Table 4. Thermal diffusivity and standard deviations of UD// measurements.
Table 5. Thermal diffusivity and standard deviations of UD⊥ measurements.
Table 6. Thermal diffusivity and standard deviation of CP// measurements.
Table 7. Thermal diffusivity and standard deviation of CP⊥ measurements.
vertical axes were the concurrent phase lags. The fiber direction of the UD CFRP was horizontal, and those of the CP CFRP were horizontal and vertical. It was found that the anisotropy distribution can be visualized by

Figure 8. Anisotropy mapping of UD CFRP.

Figure 9. Anisotropy mapping of CP CFRP.
scanning the laser in a circle on the sample. The estimated directional dependence of the anisotropic ratio, which is based on the fiber direction, is shown in Figure 8 and Figure 9, and is compared with a calculation. Figure 10 is a schematic illustration of the calculation model. The thermal resistance in each direction can be obtained from following equations:
 (10)
(10)
 (11)
(11)
 (12)
(12)
 (13)
(13)
It was assumed that heat is transferred from the origin to a point on the circle through the x-directional thermal resistance Rx and y-directional thermal resistance Ry. The θ-directional thermal resistance Rθ is obtained from Rx and Ry.
Equations (10)-(13) represent the calculation formulae. Equation (14) is obtained by substituting Equations (11)-(13) into Equation (10), and assuming Dx = D// and Dy = D⊥.
 (14)
(14)
Figure 11 and Figure 12 show comparisons of results from experiments and calculation for the directional dependence of the anisotropic ratio of UD and CP CFRP.
The experimental results indicate that the thermal diffusivity of UD CFRP was extremely high only in the fiber direction, and low in the other directions. The thermal diffusivity of the CP CFRP exhibited a large dispersion depending on the direction. It is possible that the inhomogeneous structure of the composite causes the dispersion. The calculation results predict the trend of the directional dependence of the anisotropic ratio. However, the calculation results did not correspond to the experimental results exactly. For example, for UD CFRP, the anisotropic ratio predicted by the calculation was lower than that of the experimental value around the 15˚

Figure 10. Calculation model.
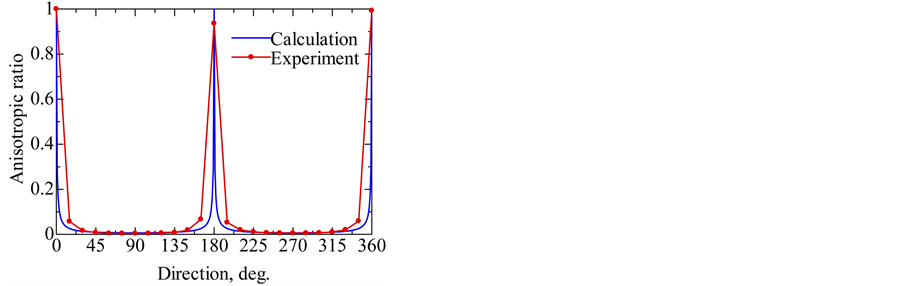
Figure 11. Directional dependence of anisotropic ratio of UD CFRP.
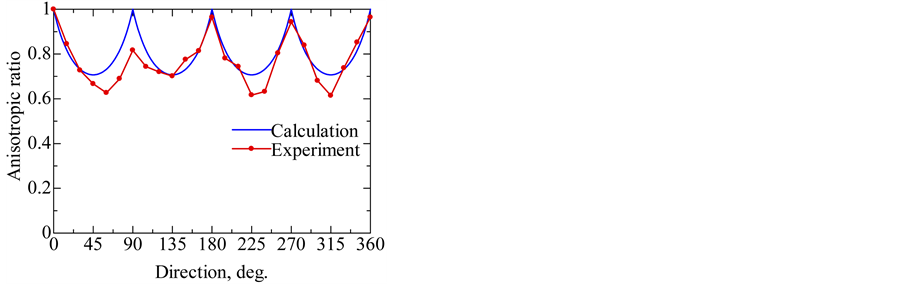
Figure 12. Directional dependence of anisotropic ratio of CP CFRP.
direction, and for CP CFRP, the calculation did not reproduce the large dispersion. These results indicate that it is important to evaluate the thermal diffusivity for each component.
6. Conclusion
The temperature dependence of the in-plane thermal diffusivities of pitch-based CFRP was measured using the laser-spot periodic heating method. It was found that the thermal diffusivity increased as temperature decreased. An anisotropic ratio of more than 100 was observed between UD// and UD⊥. The anisotropy distributions for the UD and CP CFRP were measured. It was found that the anisotropy distribution can be visualized by scanning the laser in a circle on the sample.
Acknowledgements
The authors are deeply grateful to Dr. Hideyuki Kato and Dr. Takashi Yagi from the National Institute of Advanced Industrial Science and Technology for their assistance, and to Ms. Takayo Kinoshita from Mitsubishi Plastics Inc. for supplying prepreg. A part of this research was supported by KAKENHI (23686122).
References
- Ohnishi, A. (2009) Mars-Observation Satellite “NOZOMI” and Asteroid-Observation Satellite “HAYABUSA”. Japan Journal of Thermophysical Properties, 23, 203-211.
- Wrobel, G., Rdzawski, Z., Muzia, G. and Pawlak, S. (2009) Determination of Thermal Diffusivity of Carbon/Epoxy Composites with Different Fiber Content Using Transient Thermography. Journal of Achievements in Materials and Manufacturing Engineering, 37, 518-525.
- Ellis, D.L. and McDanels, D.L. (1991) Thermal Conductivity and Thermal. Expansion of Graphite Fiber/Copper Matrix Composites. NASA Technical Memorandum 105233, NASA, Washington DC.
- Mirmira, S.R., Renzi, D.F. and Fletcher, L.S. (1998) Transverse Thermal Conductivity and Contact Conductance of Fiber Reinforced Composite Materials. Proceedings of the 11th International Heat Transfer Conference, 7, 83-88.
- Yamane, T., Katayama, S., Todoki, M. and Hatta, I. (1996) Thermal Diffusivity Measurement of Single Fibers by an AC Calorimetric Method. Journal of Applied Physics, 80, 4358-4365. http://dx.doi.org/10.1063/1.363394
- Kalogiannakis, G., Van Hemelrijck, D., Longuemart, S., Ravi, J. and Okasha A. (2006) Thermal Characterization of Anisotropic Media in Photothermal Point, Line, and Grating Configuration. Journal of Applied Physics, 100, Article ID: 063521. http://dx.doi.org/10.1063/1.2335381
- Carslaw, H.S. and Jaeger, J.C. (1959) Conduction of Heat in Solids. 2nd Edition, Chap.10, Oxford University Press, Oxford, 263.
- Hatta, I., Fujii, K., Sakibara, A., Takahashi, F., Hamada Y. and Kaneda, Y. (1999) Two-Dimensional Effects on Measurement of Thermal Diffusivity by AC Calorimetric Method: I. Conditions for Precise Measurement. Japanese Journal of Applied Physics, 38, 2988-2992. http://dx.doi.org/10.1143/JJAP.38.2988
- Gu, Y. and Hatta, I. (1991) Effect of Sample Edge in ac Calorimetric Method for Measuring Thermal Diffusivity of Thin Films with High Thermal Diffusivity. Japanese Journal of Applied Physics, 30, 1137-1138. http://dx.doi.org/10.1143/JJAP.30.1137
- Nagano, H., Kato, H., Ohnishi, A. and Nagasaka, Y. (2001) Measurement of Thermal Diffusivity of Anisotropy Graphite Sheet using AC Calorimetric Method. International Journal of Thermophysics, 22, 301-312. http://dx.doi.org/10.1023/A:1006780208048