Advances in Materials Physics and Chemistry
Vol.07 No.05(2017), Article ID:76210,25 pages
10.4236/ampc.2017.75013
Photophysical, Electrochemical and Photovoltaic Properties of Porphyrin-Based Dye Sensitized Solar Cell
William Ghann1, Tulio Chavez-Gil2*, Carentxa I. Goede2, Hyeonggon Kang1, Shamsuddin Khan1, Hany Sobhi1, Fred Nesbitt1, Jamal Uddin1*
1Center for Nanotechnology, Department of Natural Sciences, Coppin State University, Baltimore, MD, USA
2Inorganic Synthesis Lab, Department of Natural Sciences, Coppin State University, Baltimore, MD, USA

Copyright © 2017 by authors and Scientific Research Publishing Inc.
This work is licensed under the Creative Commons Attribution International License (CC BY 4.0).
http://creativecommons.org/licenses/by/4.0/


Received: March 23, 2017; Accepted: May 14, 2017; Published: May 17, 2017
ABSTRACT
Porphyrins occur in a number of important biomolecules and are also synthetically made for use as probe component of chemical and biological sensors. The performance of dye sensitized solar cells with two different porphyrin dyes was investigated in this work. The two porphyrin complexes comprised of a metal-free 5, 10, 15, 20-meso-tetrakis-(9H-2-fluorene-yl) porphyrin (H2TFP) and its Zinc complex (ZnTFP). UV-Vis, Fluorescence, and Fourier transformed infrared measurements of the two dyes were carried out to evaluate their absorption, emission and binding characteristics. Both dyes absorbed light in the UV-visible region all the way to the near-infrared. The surface morphology and elemental analysis of the porphyrin dye sensitized photoanodes were determined using Field Emission Scanning Electron Microscopy Imaging and Transmission Electron Microscopy Imaging. Cyclic voltammetry studies, current-voltage characteristics and the electrochemical impedance spectroscopic studies were also carried out. Solar-to-electric energy efficiency of H2TFP dye sensitized solar cell was higher (0.11%) than that of the zinc complex (0.08%). Thus the metal free porphyrin generated more power than the zinc complex under similar conditions. The impedance measurement also displayed less overall resistance for the free porphyrin (50 Ω) compared with the zinc complex (130 Ω). The LUMO levels of H2TFP and ZnTFP sensitizers were −0.87 eV and −0.77 eV respectively. Both of these LUMO values are higher than the lower bound level of the conduction band of TiO2 (−4.0 eV), ensuring the efficient injection of an electron from the excited porphyrin dye to the conduction band of the titanium dioxide.
Keywords:
Porphyrin Dyes, UV-VIS, Fluorescence, Lifetime Decay, IR, FESEM, TEM, I-V, Cyclic Voltammetry, Impedance and DFT Calculation

1. Introduction
Dye sensitized solar cells (DSSCs) use dyes to absorb energy from the sunlight to produce excited electrons for the generation of electricity [1] [2] [3] [4] [5] . They are inexpensive, easy to produce and environmentally friendly. DSSCs are composed of a working electrode, usually a dye sensitized nanocrystalline TiO2 on a conductive glass slide, a counter electrode, typically made of carbon or platinum on a conductive glass slide, and an electrolyte-a redox couple placed between the two electrodes for the regeneration of charge. Upon absorption of incident light, dye molecules are excited and subsequently relax by the injection electron into the conduction band of the TiO2 semiconductor. Both natural pigments [6] - [12] and synthetic dyes [13] [14] [15] [16] have been used as photosensitizers for DSSCs. Here, two different porphyrins dyes have been used as photosensitizers for DSSC. Porphyrins are heterocyclic macrocycle organic compounds that usually bind with metals such as Magnesium and Ruthenium to form complexes. An example of naturally occurring porphyrins is the pigment, heme, found in red blood cells. It is also the basic structure of chlorophyll, the green pigment found in green plants. The large conjugation system of porphyrins allows for intense absorption in the visible region of the electromagnetic spectrum which makes them great candidates for use as photosensitizers in the construction of dye sensitized solar cell. Indeed, a number of studies on DSSCs with different types of porphyrins as photosensitizers have been reported [17] - [26] .
In this work, a free base 5, 10, 15, 20-meso-tetrakis-(9H-2-fluorene-yl) porphyrin (H2TFP) and its Zinc complex (Zn-TFP) have been synthesized and characterized to study the photo-physical and current-voltage properties of the DSSC.
2. Experimental Section
2.1. Materials and Methods
Reagents were purchased commercially and used as received, except for pyrrole and DMF that were redistilled by literature procedures [27] . All synthesis and air-sensitive characterization processes were carried out under a vacuum line and standard Schlenk techniques. Solvents for synthesis and spectroscopic characterization (ACS Grade) including dichloromethane (DCM), chloroform, hexanes, alcohols, and tetrahydrofuran were either purchased from Sigma-Al- drich, St. Louis, MO, or Across Organics, NJ, USA. Doubly purified deionized water from an 18 M Millipore system was used for aqueous solutions. N, N’-di- methylformamide (DMF) was distilled over calcium hydride under N2 flow. Zn(OAc)2∙2H2O was synthesized with high purity and checked through NMR spectrometry and melting point techniques. Column chromatography was carried out using silica gel 60, 230 - 400 mesh, from EMD Chemicals. The proton NMR spectrum was collected on a Bruker Avance III 400 MHz NMR spectrometer; FT-IR spectra were collected as KBr disk on a Nicolet iS50 FT-IR spectrometer; Electrochemistry determinations were collected in DMF solutions on a Princeton Applied Research VersaSTAT-3 potentiostate using a three electrode cell unit. Steady-state absorbance spectra were measured on a Perkin Elmer Lambda 850 UV−visible (UV−vis) spectrophotometer and spectra were collected in DCM or chloroform solution. Elemental analyses were obtained from Galbraith laboratories Inc (Knoxville, TN). Titanium dioxide powder (Degussa P25) was purchased from the institute of chemical education. Fluorine tin oxide (FTO) conducting glass slides were purchased from Harford glass company, Hartford City, Indiana.
Steady-state fluorescence spectra were recorded on the fluorescence Nanolog Spectrofluorometer System from Horiba Scientific (FL3-22 iHR, Nanolog). The morphology of each film was analyzed using field emission scanning electron microscopy (FESEM; JSM-7100FA JEOL USA, Inc.). Transmission Electron Microscopy (TEM) images were acquired on JEM-1400 Plus (JEOL USA, Peabody, Massachusetts). The images were viewed using Digital Micrograph software from Gatan (Gatan. Inc, Pleasanton, CA). HOMO and LUMO calculations were carried out using Spartan’14 software from Wave function, Inc. Irvine, CA, and USA. TiO2 paste was printed on FTO glass using WS-650 Series Spin Processor from Laurell Technologies Corporation.
2.2. Synthesis of 5, 10, 15, 20-Meso-Tetrakis-(9H-2-Fluorene-yl) Porphyrin
The synthesis of 5, 10, 15, 20-meso-tetrakis-(9H-2-fluorene-yl) porphyrin, denoted as H2TFP, was carried out by the synthetic route shown in Scheme 1. In a 400 mL three-neck round-bottom flask equipped with a magnetic stirring bar and surmounted by a reflux condenser, freshly distilled pyrrole (1.45 g, 21.6 mmol), was added to a solution of fluorene-2-carboxaldehyde (4.2 g, 21.6 mmol), and propionic acid (180 mL) previously degassed through N2. After reagents were mixed, the system was immersed in an oil bath and temperature was raised to 130˚C. The reaction mixture was refluxed for 6 h to complete the reaction. The reaction progress was monitored by taking aliquots of the solution and recording its UV-vis spectra. After a constant pattern was observed for the Soret (=424 nm) and Q bands, the reaction was stopped, allowed to reach room
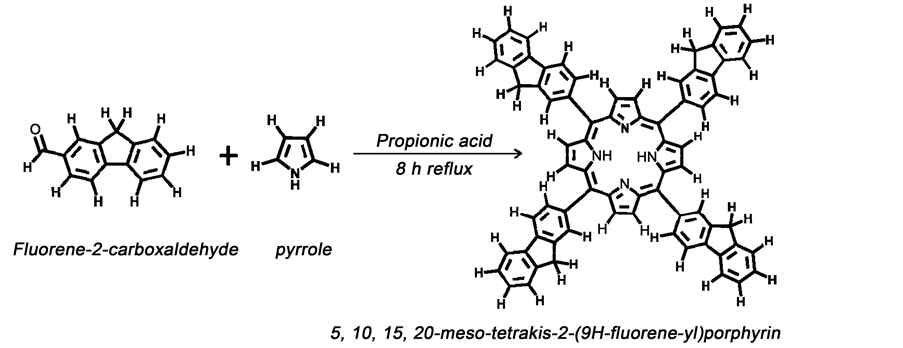
Scheme 1. Synthesis of H2TFP freebase.
temperature and crunched ice added to precipitate a deep green-violet solid. The cold solution was filtered and the residue washed several times with methanol until no more colored solution was observed in the filtrate. The resulting tarry residue was triturated with toluene (50 ml) and allowed to stand in the refrigerator overnight. A fine purple powder was precipitated, filtered and washed thoroughly with cold toluene. The dried powder was dissolved in dichloromethane (100 ml), treated with trifluoroacetic acid (0.15 ml), and allowed to stir at room temperature for 4 h. The reaction mixture was refluxed for an additional 2.5 h and allowed to cool down to room temperature after which, a saturated solution of sodium carbonate, NaHCO3 (100 mL) was added and the mixture was washed with water (2 × 100 mL) to attain an organic face after separation. Methanol (100 mL) was added over the organic layer to precipitate the free base H2TFP that was collected by filtration, washed several times with cold methanol and dried in desiccator under CaCl2. The solid was dissolved in a little amount of dichloromethane (~7 mL) followed by purification on an alumina column. Eluting with pure dichloromethane then ensued affording a pure compound that was also characterized by UV-Vis giving a sharp Soret band at 424 nm. The solvent was evaporated on rotavapor system and the solid was re-dissolved once more in dichloromethane and filtered over cotton to remove any impurities. The filtrate was recovered in a vial and kept in a dark place at room temperature for several days under gentle evaporation, yielding a deep green-foiled material. Yield, 1.06 g (25.2%). Anal. Calcd for C72H46N4∙CH2Cl2, H2TFP (MW = 967.22 g/mol): C, 83.32; H, 4.60; N, 5.32. Found: C, 83.31; H, 4.30; N, 5.61. Figure 1 shows the NMR spectrum of H2TFP. 1H-NMR (400 MHz, δppm (CDCl3): 8.94 (s, 8H, CHβ-pyrrolic), 8.42 (s, 4H, Hfluorenyl, H1), 8.28 (d, 4H, JHH = 0.1 Hz, Hfluorenyl, H4), 8.17 (d, 4H, JHH 0.02 Hz, Hfluorenyl, H3), 8.07 (d, 4H, JHH = 0.02 Hz, Hfluorenyl, H5), 7.72 (d, 4H, JHH = 0.2 Hz, Hfluorenyl, H8), 7.55 (t, 4H, Hfluorenyl, H6), 7.46 (t, 4H, Hfluoreneyl, H7), 7.24 (strong 1H, CDCl3), 5.43 (s, 2H, dichloromethane-trace), 4.22 (s, 8H, 4CH2-fluorenyl), and −1.36 (s 2H, Hα-pyrrolic, not shown). FT-IR (KBr disk, υ/cm−1): 3438 m, 3044 m, 2894 w, 1706 s, 1553 m, 1456 m, 1401 w, 1298br, UV-vis (CH2Cl2) 413, 507, 536, 583, 637 nm. 1226 w, 1049 w, 1004 w, 972 w, 800 w, 765 m, 734 s, 422 w. UV-vis DCM(λ, nm), (ԑ, 105 M−1, cm−1): 424 (Soret), 518, 554, 591, 649 (Qs).
2.3. Complex Zn-5, 10, 15, 20-Meso-Tetrakis-(9H-2-Fluorene-yl)Porphyrinato(II)
Zn-5, 10, 15, 20-meso-tetrakis-(9H-2-fluorene-yl) porphyrinato (II), denoted as ZnTFP, was prepared according to the synthetic route shown in Scheme 2. In a 50 mL two-neck round-bottom flask, 50 mg (0.22 mmol) of Zn(Oac)2∙2H2O was dissolved in 25 mL dichloromethane previously degassed under anitrogen atmosphere for 10 minutes. To this solution, 21 mg (0.02 mmol) of 5, 10, 15, 20-meso-tetrakis-(9H-2-fluorene-yl) porphyrin was added and degassed with nitrogen for about 10 min. Under these conditions, the reaction flask was capped with rubber septum and kept stirring for 12 h protected from light. After that period the flask was connected to a reflux condenser surmounted by a CaCl2 trap
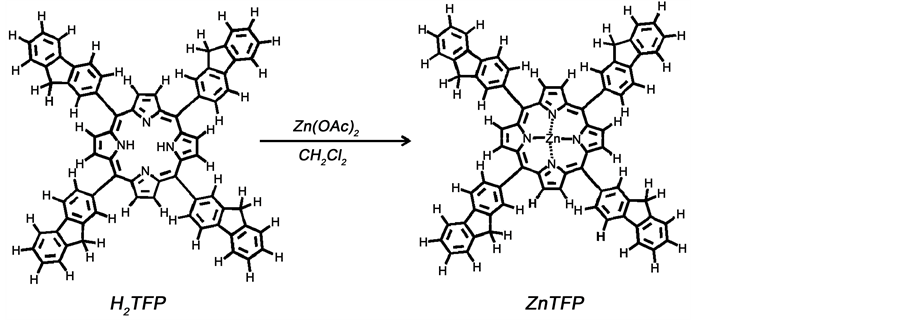
Scheme 2. Synthesis of Zinc-porphyrin complex.
and refluxed for more two additional hours. The solvent was evaporated and the resulting solid dried overnight on desiccator and dissolved in dichloro-methane. This solution was washed with a concentrated sodium hydrogen carbonate (10% solution, 100 mL) and after separation the resulting organic phase was dried on sodium sulfate anhydrous for 4 h protected from light. The solvent was evaporated and the solid dissolved in a small amount of dichloromethane. Silica gel was used for flash filtration employing dichloromethane: methanol (9:1 v/v) as eluent solution. After solvent evaporation, the solid was treated with dichloromethane (~10 mL), and filtered on cotton to remove any remaining impurities. The filtrate was recovered in a vial, placed inside of a flask capped with rubber septum under an atmosphere of methanol and left to stand for several days at room temperature protected from light. The obtained blue wish-violet solid was washed twice with cold methanol and dried in vacuum over fused CaCl2. The yield was 19.3 mg (88%). Anal. Calcd for C72H44N4Zn (1030.61g/mol): C, 83.90; H, 4.31; N, 5.44; Zn, 6.34; Found: C, 82.62; H, 6.18; N, 3.49; Zn, 2.57. The 1H-NMR spectrum of this compound is displayed in Figure 2. 1H-NMR (400MHz, δppm (CDCl3,): 9.08 (s, 8H, CHβ-pyrrolic), 8.42 (s, 4H, Hfluorenyl, H1), 8.28 (d, 4H, JHH = 0.1 Hz, Hfluorenyl, H4), 8.17 (d, 4H, JHH 0.02 Hz, Hfluorenyl, H3), 8.07 (d, 4H, JHH = 0.02 Hz, Hfluorenyl, H5), 7.72 (d, 4H, JHH = 0.2 Hz, Hfluorenyl, H8), 7.55 (t, 4H, Hfluorenyl, H6), 7.46 (t, 4H, Hfluoreneyl, H7), 5.43 (s, 8H, CHβ-pyrrolic), and 4.22 (s, 8H, 4CH2-fluorenyl). FTIR (cm−1, KBr): 2920 s, 2850 sh, 1710 m, 1460 s, 1400 w, 1340 m, 1280 m, 1220 m, 1000 m, 802 w, 476 w, 422 w. UV-vis (nm, dichloromethane), 427 (Soret); 552, 592 (Qs); 267 π-π* fluorenyl moieties.
2.4. Fluorescence Lifetime Measurements
The dye samples were dissolved in 3 mL of ethanol for fluorescence lifetime solution. To prevent inner filter effect, absorption measurements were carried out to ensure that the absorbances of the dyes were less or equal to 0.15 absorbance unit. Fluorescence decay was measured using Horiba Deltaflex fluorescence lifetime system using the time-correlated single-photon counting (TCSPC) technique with the PPD-850 picosecond photon detection module. The excitation source was 340 nm light-emitting diodes (Delta LED).
2.5. Fabrication of Solar Cell
The photoanode was prepared by depositing a thin film of TiO2 on the conductive side of fluorine doped tin oxide (FTO) glass using a spin coater and sintered at 380˚C for 2 hours [8] [9] . The TiO2 covered FTO glass was then immersed in a freshly prepared 5 mM dye solution for a period of two hours. The counter electrode (cathode) was prepared by painting FTO glass with colloidal graphite. The dye-sensitized electrode and the carbon electrode were assembled to form a solar cell sandwiched with a redox (I−/I3−) electrolyte solution. The active area of the cell was 5 cm2.
2.6. Photovoltaic Properties Measurement
The energy efficiencies of the fabricated DSSCs were measured using 150 W fully reflective solar simulator with a standard illumination with air-mass 1.5 global filter (AM 1.5 G) having an irradiance corresponding to 1 sun (100 mW/cm2) purchased from Sciencetech Inc., London, Ontario, Canada and Reference 600 Potentiostat/Galvanostat/ZRA from Gamry Instruments (734 Louis Drive, Warminster, PA 18974). The tested solar cells were masked to an area of 5 cm2. Each cell performance value was taken as the average of three independent samples. The solar energy to electricity conversion efficiency (η) was calculated based on the equation:
 (1)
(1)
where, FF is the fill factor, Isc is the short-circuit photocurrent density (mA cm?2), and Voc is the open-circuit voltage (V) as listed in Table 3.
3. Results and Discussion
3.1. 1H NMR Spectra
The proton NMR signals of free base H2TFP is depicted in Figure 1. In its β and meso positions are found the exocyclic protons with respect to the macrocyclic and local pyrrole currents which experience the deshielding influence of the latter. The signals for these protons are observed at low field (δ from 7.46 to 8.42 ppm for the meso-fluorenylprotons and at δ from 8.5 to 8.9 ppm for the β-pyr- role protons). The protons of the N-H groups are exocyclic with respect to the local ring currents and endo-cyclic with respect to the macrocyclic current. Thus, the shielding effect of the latter prevails and the signals for the protons of the N-H groups are observed at very high field (from δ −1.4 to −4.4 ppm). [28] The proton NMR spectra of the metallic fluorenylporphyrins show clear differences relative to the free base fluorenylporphyrin. Upon complexation of the free base H2TFP with zinc-acetate, the Hβ protons of pyrrole ring (in H2TFPat δ, 8.94 ppm) were shifted downfield (to δ 9.03 ppm).The inner imino hydrogens appear as a singlet at −2.60 ppm, relative to −2.75 ppm for H2TFP [28] . Thus the chemical shifts of 1H-NMR of free-base H2TFP especially for N-H protons, clearly shows the effect of non-planarity on the spectra of zinc-fluorenylporphyrin. In the neutral free base H2TFP, for example, the Hα and Hβ signals appeared at δ

Figure 1. 1H-NMR spectra of free base 5, 10, 15, 20-meso-tetrakis-(9H-2-fluorene-yl) porphyrin, (H2TFP) with proton numbering for clarity, 1.0 mM chloroform-d. Starred peaks are solvent impurities.
−2.60 and 8.94 ppm, respectively, while in the zinc-porphyrin complex (Figure 2), which has a severely distorted geometry with the Hβ signal substituted and the slighted low field shifted Hβ protons that appears as a quasi-doublet at δ9.08 ppm. Those variations in the proton NMR spectra are ascribed to the energy cost on the non-planar distortion geometry depicted by the porphyrin structure during its complexes formation. The difference between these protons in regard to their intensity and signal splitting is related to the geometry instead of molecular symmetry [29] [30] .
3.2. Electronic Absorption Spectra
The UV-visible absorption spectra in dichloromethane of the neutral free base (H2TFP) and its Zinc complex (ZnTFP) were carried out at room temperature and have been reported previously [31] . The measurements of these compounds were performed at different concentrations due to the difference in their absorption intensities; a more concentrated solution was used to display the Q bands and a less concentrated for the Soret band absorption of free and metallic porphyrin. The UV-visible spectra of neutral free base H2TFP exhibit an intense Soret band with a maximum absorption around 424 nm and four Q bands characteristic of a porphyrin free base which are located at 521, 556, and 598 and at 654 nm, respectively. In addition, there is a wide and strong absorption band around 267 nm, assigned to the π-π* intramolecular transitions of fluorenyl dyes if compared with the weak absorption in the UV range which is clearly apparent but absent for Tetra-Phenyl-Porphyrin (TPP) [31] . The absorption at 424 nm

Figure 2. 1H-NMR spectra of zinc-fluorenylporphyrin complex 1.5 × 10⁻⁵ M?dichloro- methane-d2 at 298 K. Starred peaks are solvent impurities.
corresponding to the B(0, 0) band (Soret band, ε = 2.3 × 10⁵ M−1 cm−1) is slightly red shifted compared to 417 nm for TPP. This tendency in red shifting is also observed for the four Q bands. The metallic porphyrin complexes in the other hand, exhibit characteristic changes on the electronic spectra compared to H2TFP.
Thus, the absorption spectra of Zn(II) porphyrin complex display a single Soret band which is a combination of the QX and QY electronic transitions due to the D4h symmetry of metallic porphyrins, instead of the D2h low symmetry characteristic of free base porphyrins, with two discernible sub-bands (Q(1,0) and Q(0-0)) [32] [33] . Thus, the zinc-porphyrin exhibit an intense and red shifted band at 426 nm (Soret), ε = 3.8 × 10⁵ M−1 cm−1), together with two Q-bands in the visible range, one of moderated intensity located at 554 nm (Q1-0) attributed to a vibration component which is responsible in the withdrawn of intensity of the Soret band, however its molar absorptivity is almost constant in metallo- porphyrins. A second Q-band is observed at 595 nm (Q0-0) which intensity in free-base porphyrins is defined for the difference between the transitions of two orbitals (a1u and a2u orbitals) that lead to Eu state, but if they are degenerated as occur in metallic-porphyrins this band practically does not exist [34] (Figure 3). An additional broad band is observed in the UV range which corresponds to π-π* absorption of the fluorenyl dyes. This absorption at 310 nm has different intensity than for the zinc complex as well for the free base H2TFP as consequence of the difference in electron’s donor/withdraw exerted for the fluorenyl groups on the porphyrin chromophore geometrical conformation (distorted, freebase; butterfly zinc complex). Also, a slightly red shift on the UV band from 268 nm to 271 nm shows a deeply change in the metallic porphyrin derivative due to the remarkable geometry changes on the 5, 10, 15, 20-mesofluorenyl positions on the porphyrin ring.
3.3. Steady State Fluorescence Studies
Fluorescence spectra of H2TFP and ZnTFP deployed in the fabrication of the DSSC were measured to investigate their emission characteristics. The spectra measured in dichloromethane by scanning from 500 to 800 nm with fixed excitation at 420 nm are displayed in Figure 4. Each of the dyes displayed different fluorescence behavior according with its chemical composition. Thus, the

Figure 3. UV-VIS spectra of free base 5, 10, 15, 20-meso-tetrakis-(9H-2-fluorene-yl) porphyrin, 1 (H2TFP), and Zn-5, 10, 15, 20-meso-tetrakis-(9H-2-fluorene-yl) porphyrinato (II) in dichloromethane.

Figure 4. Fluorescence spectra of free base 5, 10, 15, 20-meso-tetrakis-(9H-2-fluorene-yl) porphyrin, 1 (H2TFP), and Zn-5, 10, 15, 20-meso-tetrakis-(9H-2-fluorene-yl) porphyrinato (II) in dichloromethane.
emission pattern of the free porphyrin resembles its UV-Vis absorption spectrum but the emission observed with the Zn complex shows to be very different. H2TFP for example, displayed a red shift while ZnTFP exhibited a broadened fluorescence spectrum. The two emission peaks for the H2TFP occurred at 658 nm and 720 nm, whereas the fluorescence bands for ZnTFP occurred at 599 nm and 650 nm, respectively. It could also be observed from the absorption spectra that the fluorescence peaks are the result of the metallic substitution that occurred on the first Q-bands of the porphyrin and these transitions are not dependent on the Soret band.
3.4. Fluorescence Lifetime Measurement
As part of the photophysical studies on the porphyrin dyes, the fluoroscence lifetime measurement were carried out to determine the length of time the porphyrin molecules stay in the excited state before decay. Figure 5 and Table 1 show the fluorescence lifetime of the free-base (H2TFP) and the Zinc complex (ZnTFP). The fluorescence decay profiles were analyzed by two-exponential fit giving two components with lifetimes of 38.91 ps and 1.38 ns for the free porphyrin and 58.11 ps and 5.27 ns for the zinc complex. The two lifetime is an indication of presence of two different species that decay at different rates. In dye sensitized solar cells the electons from the excited state are injected into the conduction band of titanium dioxide on which they dye is anchored. The injection process is also in competition with the normal relaxation pathways of the florophore in the excited state. Thus, understanding the decay process may help predict the fate of the electron in the excited state. Most organic molecules including porphyrin have short fluorescence lifetime which could easily be quenched by the iodide/triodideredoxcouple. Therefore dye molecules with short lifetime are more likely to have a short lifetime in the presence of the electrolyte.

Figure 5. Fluorescence lifetime measurement of free base 5, 10, 15, 20-meso-tetrakis- (9H-2-fluorene-yl) porphyrin, 1 (H2TFP), and Zn-5, 10, 15, 20-meso-tetrakis-(9H-2-flu- orene-yl) porphyrinato (II) in dichloromethane.

Table 1. Fluorescence lifetime measurement of cyanine dyes free base 5, 10, 15, 20-meso- tetrakis-(9H-2-fluorene-yl) porphyrin, 1 (H2TFP), and Zn-5, 10, 15, 20-meso-tetrakis- (9H-2-fluorene-yl) porphyrinato (II) in dichloromethane.
3.5. FT-IR Spectroscopy
The FT-IR of the H2TFP and ZnTFP are displayed in Figure 6. In the free base, H2TFP, the moderate IR bands at 3433 and 1540 cm−1 are attributed to the NH stretching vibrations, but they were absent in the spectra of the complexes, because the hydrogen atom in the N?H bond were replaced by a transition metal ion. [35] The skeletal vibrations of the free porphyrin ring appear at 1553 and 1288 cm−1, respectively. A band of moderate intensity at 1450 cm−1 corresponds to (C-C) stretching of the fluorenyl dyes, and other two weak bands at 3030 and 2890 cm−1 are ascribed to the stretching of (9H) fluorenyl and (Hβ) pyrrolic hydrogen, respectively. The vibrations implicated below ∼1000 cm−1 generally entail out-of-plane stretching for C?C and C?H groups in the fluorenyl chromo- phore. Additionally, combination bands in the 1500 - 500 cm−1 region involving non-planar C-H vibrations have been reported previously for the fluorene dye [36] [37] [38] [39] . The IR results with Zn(II) metalloporphyrins, implies deep changes on the strong stretching composed by the two bands at 733 and 744 cm−1 observed for the H2TFP free base. On the Zn(II) metalloporphyrins (ZnTFP), these stretchings were splited into two weak bands shifted to 760 and 690 cm−1. Thus, the difference of energy between the splited signals for ZnTFP are mininal. These results are still directly related with the cost of stabilization energy encountered in the formation of metallic heterocyclic complexes.
3.6. Field Emission Electron Microscopy (FESEM) Studies
Studies on the morphology of the TiO2 electrode were further investigated using Field-Emission Scanning Microscopy Imaging (FESEM). Figure 7 shows the FESEM microscopic morphology of the porphyrin dye adsorbed nanocrystalline

Figure 6. FT-IR spectra of (a) 5, 10, 15, 20-meso-tetrakis-(9H-2-fluorene-yl)porphyrin, H2TFP (a), and (b) zinc-5, 10, 15, 20-meso-tetrakis-2-(9H-fluorenyl)porphyrinato (II), Zn-TFP (b), (KBr disk).
TiO2 film. Only minor changes are observed in the surface morphology of the samples before and after dye application. The dye adsorbed TiO2 was finer than the bare TiO2 nanocrystalline film. Energy dispersive X-ray spectroscopic (EDS) mapping analysis of a nanocrystalline TiO2 partially sensitized with porphyrin dye is displayed in Figure 7(a). The part of the film containing the dye shows prominent peak for carbon, the predominant element in porphyrin. The peak for carbon is negligible in the part of the film without the porphyrin, instead the prominent titanium peaks are observed. EDS was also used for the chemical characterization of the porphyrin sensitized TiO2 in comparison with the bare TiO2 film. An intense carbon peak was observed in the spectrum of porphyrin dye-sensitized TiO2 film (Figure 7(b)) compared to the barely visible carbon peak in the spectrum of the bare TiO2 (Figure 7(c)). Thus the results are consistent with the elemental composition of free porphyrin which is mainly

Figure 7. Field emission scanning electron microscopy and energy dispersive x-ray studies: (a) line profile analysis of a partially dyed TiO2 film on FTO glass (b) EDS spectrum of porphyrin dye sensitized TiO2 on FTO glass (c) EDS spectrum of bare TiO2 coated FTO glass (d) FESEM image of porphyrin dye sensitized TiO2 film (e) FESEM image of bare TiO2 coated FTO glass.
made up of carbon. The nanocrystalline nature of the TiO2 which increases the surface area of the titanium dioxide is clearly observed in Figure 7(d) and Figure 7(e). The increased surface area allows more dye molecules to be anchored on it which ultimately increase the efficiency of the solar cell.
3.7. Transmission Electron Microscopy Imaging Studies
To confirm the adsorption of the porphyrin dyes on the TiO2 nanoparticles, the high-resolution images were taken by transmission electron microscopy as shown in Figure 8. To get the TEM images, the porphyrin dye powder was dissolved in acetone and the resulting solution filtered with a filter paper (VWR.com, grade 410) to remove residues. After that, TiO2 powder was added to form a mixture with the filtered dye solution. The mixture was then suspended for 20 min to ensure the adsorption of the dye into the TiO2. A drop of the dye mixture was subsequently deposited on a TEM grid and allowed to dry inside a hood overnight. A mixture of TiO2 and acetone was dried on another TEM grid and used as an external control. Anatase TiO2 nanoparticles were observed with a particle size range of 20 - 25 nm as shown in Figure 8. In Figure 8(a) and Figure 8(b), the small spherical dyes of 1 - 3 nm were observed on the anatase TiO2 particles (the arrows in the images are guide to the dyes). Conversely, dye particles were not observed in the control as shown in Figure 8(c). Figure 8(d) and Figure 8(e) are a zoom-in images of one of the TiO2 crystals and its FFT pattern, respectively. The interplanar distance in the TiO2 crystal obtained by Fourier transform was 0.34 nm corresponding to the (101) plane of
 (a) (b)
 (c) (d) (e)
Figure 8. High-resolution TEM images of the porphyrin dye/TiO2 samples and the TiO2 nanoparticles. (a) and (b) high resolution TEM images of porphyrin dye/TiO2; and (c) of TiO2 nanoparticles without dye (d) zoom-in image of one of the TiO2 crystals (c), and (e) the FFT pattern of the zoom-in image.
the anatase TiO2 powder. It is speculated that the adsorption between the TiO2 nanoparticles and the dyes results from the electrostatic binding, since the dyes do not have any functional groups which are able to induce any binding between them.
3.8. Cyclic Voltammetry
The standard redox process of a free base porphyrin is characterized for the two-electron transfer reaction with two reversible waves named E1Ox and E2Ox, which are determinate by cyclic voltammetry. [40] The voltammogram of meso-tetrakis-phenyl porphyrin (TPP) had been used as a standard to interpret the electron transfer process that occurs on a large number of freebase and metallic porphyrins [41] . It is worth to mention that wave potentials on the meso positions are deeply affected by substituents around the porphyrin heterocyclic ring. In addition, the type of metal (hard or soft) and the degree of its oxidation state are directly related with the electron transfer changes on metallic porphyrins [42] . Felton et al. demonstrated that most of metallic porphyrins exhibit a constant potential difference between the first and the second macrocycle centered oxidation, or on the first and second macrocycle centered reductions. [43] Cyclic voltammetry, CV, for free base H2TFP and its metallic derivatives were recorded using a one-compartment three-electrode cell, equipped with a platinum, Pt, disk working electrode from Basi-Analytical Instruments (1.6 mm diameter), a platinum wire as auxiliary electrode, and all potentials were referenced to Ag/AgNO3 (0.10 M, in acetonitrile) electrode. The working electrode was polished first using 0.30 μm followed by 0.05 μm alumina polish (BASi). The supporting electrolyte was 0.1 M tetrabutylammonium perchlorate (NBu4ClO4) and the measurements were made in N, N’- dimethylformamide, DMF. All potentials were converted to the SHE scale by adding 0.50 V to the experimental data [44] .
The cyclic voltammetry were carried out on a Princeton Applied Research Versa STAT-3 potentiostate with samples degassed under a nitrogen flow before each scan. The synthesis and characterization of meso-tetrakis-fluorenylpor- phyrin, H2TFP, in Scheme 1, has been previously reported [45] and for comparative purposes, the electrochemical and spectroscopic results of this chromophore and its metallic complexes are included in this study [46] [47] . The cyclic voltammogram of free base H2TFP in a 0.1 M Bu4NClO4/DMF solution is illustrated in Figure 9(a) and summarized in Table 2. The CV of free base was recorded by applying three cycles, which shows two reversible redox couples with a peak potential, Eo1/2 = +0.31 V and at Eo1/2 = −0.79 V versus SHE. These two reversible reactions that occur at slightly different regions, correspond to the successive one electron redox reaction on the porphyrinic ring. The voltammogram shows another irreversible, strong, and broad wave at Eo1/2 = −0.56 V that correspond at two electron transference reaction, attributed to the meso-fluorenyl- moieties. This attribution is in agreement with similar meso-tetrakis aromaticporphyrins that shows identical electrochemical pattern according with Spiro et. al. [48] . In addition, the successive redox cycles applied on the same sample and at different scan rates do not shows great changes on the electrochemistry
 (a)
(a) (b)
(b)
Figure 9. Cyclic voltammograms of (a) H2TFP and (b) ZnTFP; 1.0 × 10⁻⁶ moldm−3, N, N’- dimethylformamide, 0.1 moldm−3 tetrabuthylammonium perchlorate. Scan rate 50 mV∙s−1 (a) three cycles, and (b) Zn-TFP + 0.1 μM of pyridine, (dashed line). Potentials recorded vs. Ag/AgNO3 (0.1 M) reference electrode and converted to SHE by addition of 0.5 V.
Table 2. Redox potentials for free base H2TFP, and metallic [ZnTFP]2+ complex.
aPotentials reported versus the SHE reference electrode in acetonitrile (0.1 M) with samples dissolved in DMF. Scans recorded at 100 mV∙s−1 and 25˚C.
behavior, that could be related with the high stability showed by this porphyrin when exposed to air for long times but light protected. The peak potential separations Ep between the anodic and cathodic peaks than for H2TFP and its complexes ranged from 53 mV to 67 mV with an average of 61 ± 0.002 mV. These values are close to the theoretical value of 59 mV for a one-electron transfer reaction, that for a reversible process the peak width is given by the following relationship:
 (2)
(2)
where Ep/2 is the half-peak potential at the half value of the peak current, Ep, is the peak potential, F is the Faraday constant and n is the number of electrons in the reaction. The presence of metallic ions in the fluorenylporphyr in core makes the oxidation reaction of these complexes easier with the redox potentials shifted towards lower values.
The results of our experiments shows that zinc-fluorenyl porphyrin complex (ZnTFP) undergoes a one electron transfer process with a half wave potential, Eo1/2 = 0.57 V vs SHE in DMF (Figure 9(a)) for oxidation; while the reduction reaction shows to occur at Eo1/2 = 0.03 V vs SHE in a reversible one electron transfer as indicated by the peak current ratio, ia/ic which is close to unity (herein, 1.0) at the scan rates investigated (50 - 100 mV/s). The peak separation between the anodic and cathodic peak potentials, Epa - Epc, shows to be close to 0.53 V (one electron transfer), which is attributed to a reversible electroche- mistry process [49] . Thus, the one electron donating/withdrawing in a symme- trical process (among its reversible characteristic), means that this material is very stable. Some broadening occurred, however, due to uncompensated resistance. Similar as observed on other free base porphyrins, the fluorenyl group on the pyrrolic ring makes ZnTFP easier to reduce [50] . Therefore, the presence of aromatic groups in the meso positions weakens the interaction between the metal and porphyrin by turning easier the electron transfer reactions. In addition, cyclic voltammograms were recorded after the addition of a diluted pyridine solution (1.25 μM, see Figure 9(b)-dotted curve), in that a symmetrical shift to low potentials with ΔEo1/2 = 0.21 V and ΔEo1/2 = 0.27 V ascribed to the oxidation of the ZnIII ion. This process occur in parallel to the raise of well defined peak current ratio, ia/ic (Δi = 12 μA) attributed to an enhancement in the zinc-complex geometry (Oh), instead of the butterfly associated with the square planar coordination.
3.9. I-V Performance
Figure 10 and Table 3 show the current-voltage characteristics the free base, H2TFP, and metallic meso-tetrakis-2-(H9-fluorenyl) porphyrin. The current?voltage curves reveal a significant difference in the photovoltaic performance of the free base porphyrin (H2TFP) and ZnTFP sensitized solar cell. A higher efficiency was obtained from devices fabricated with the free porphyrin

Figure 10. Current and Voltage Characteristics of dye sensitized solar cells fabricated with free base H2TFP and metallic meso-tetrakis-2-(H9-fluorenyl) porphyrin coordinated to Zn(II).
Table 3. Current and voltage characteristics for the porphyrin dye sensitized solar cells.
(0.11%) compared with that fabricated with Zn complex (0.08%). The higher efficiency of the free porphyrin compared to the Zn complex could be due to an efficient interaction between the TiO2 surface and the free porphyrin. Such interaction favors the injection of electron from the dye into the conduction band of the titanium dioxide. Specifically,, the geometry orientation and flexibility changes when the metal is inserted into the porphyrin ring. Thus, the rigidity of the resulting coordinated porphyrin reduces the interaction of the dye with the TiO2 surface leading to a decrease in the electron transfer efficiency of the cell. Therefore, the efficiency values on these dyes could be improved when anchoring groups that facilitate charge transfers attached to these porphyrin molecules.
3.10. Electrochemical Impedance Spectroscopy
Electrochemical impedance measurements on the solar cells fabricated using free base H2TFP and the metal complex (ZnTFP) were carried out to understand charge transfer and energetics of charge transport and recombination. The impedance measurements were carried out at frequencies between 0 and 100 KHz. Figure 11 shows the Nyquist plots (a) and Bode plots (b) of H2TFP and ZnTFP,
 (a)
(a) (b)
(b)
Figure 11. Impedance studies of the fabricated devices: (a) Nyquist plot of the dye sensitized solar cells fabricated using H2TFP (blue) and ZnTFP (blue); (b) Bode plot of dye sensitized solar cells fabricated using H2TFP (blue) and ZnTFP (red).
respectively. The arc in the high frequency region is usually associated with the charge transfer resistance at the interface between the redox couple/electrolyte and counter electrode whereas the arc in the low frequency region is ascribed to the resistance of the transport of the injected electrons within the TiO2 film. The results seen here are consistent with the IV data. The impedance measurement also shows less overall resistance for the free porphyrin (50 Ω) compared with the zinc complex (130 Ω). The position of the low frequency peak of the Bode plot provides information on the lifetime of the photo induced electrons via the equation:
 (3)
(3)
where, f is the frequency of superimposed ac voltage. Thus, H2TFP was found to have a longer lifetime than ZnTFP.
3.11. Density Functional Theory (DFT) Calculations
Density functional calculations were used to optimize the geometry of fluorenyl- porphyrin, H2TFP, molecule using the software Spartan 16 from Wave function. All geometries were computed using the ωB97X-D density functional theory method. Geometry optimization was performed using 6-31G* basis set. These calculations were used to calculate the highest occupied molecular orbital (HOMO) and the lowest unoccupied molecular orbital (LUMO) energies of free base and metallic meso-tetrakis-2-(H9-fluorenyl) porphyrin coordinated to Zn (square planar complex).
Figure 12(a) and Figure 12(b), show the Lewis and 3D structures of fluorene-porphyrin, respectively. Similarly, Figure 12(c) and Figure 12(d) show the

Figure 12. Lewis structure ((a), (c)) and 3D structure ((b), (d)) of free porphyrin ((a), (b)) and metallic porphyrin ((c), (d)).
Lewis and 3D structures of metallic meso-tetrakis-2-(H9-fluorenyl) porphyrin, respectively. The calculations gave a result for the HOMO as −6.29 eV and the result for the LUMO found to be −0.87 eV. Thus, the difference in the HOMO and LUMO which is the band gap was 5.42 eV. The calculations for the metallic compound gave a result for the HOMO as −6.36 eV and the result for the LUMO as −0.77 eV. The difference in the HOMO and LUMO which is the band gap was 5.59 eV. The HOMO and LUMO surfaces and orbital energy diagrams for the free base is displayed in Figure 13(a) and Figure 13(b) and that of metallic porphyrin are shown in Figure 13(c) and Figure 13(d), respectively. The blue and red regions in all the figures represent the positive and negative values of these orbitals, respectively.
 (a) (c)
 (b) (d)
Figure 13. LUMO Energy diagram and surface ((a), (c)) and HOMO energy diagram and surface ((b), (d)) of the free Porphyrin ((a), (b)) and metallic porphyrin ((c) (d)).
3.12. Energy Diagram
In the presence of solar energy, porphyrin dye molecules (S) adsorbed on the TiO2 film absorb photon and make a transition from the ground state or highest occupied molecular orbitals (HOMO) to the excited state or the lowest unoccupied molecular orbital (LUMO) state as displayed in Figure 14. The photoexcited dye species (S*) injects an electron into the conduction band of TiO2 electrode and becomes oxidized (S+). The oxidized dye species subsequently accept an electron from the electrolyte (I−) and the ground state of the dye (S) is restored. The injected electron is transported through the mesoporous TiO2 film to the FTO layer and is conducted through an external circuit to a load where the work done is delivered as electrical energy. The electron from the external load diffuses to the cathode where it gets transferred to the electrolyte (I3−).

Figure 14. Energy diagram of porphyrin dye sensitized solar cell.
4. Conclusion
Two different porphyrin dyes were used to fabricate dye sensitized solar cells. The two porphyrin complexes comprised of a metal-free 5, 10, 15, 20-meso-te- trakis-(9H-2-fluorene-yl) porphyrin (H2TFP) and its Zinc complex (ZnTFP). UV-Vis, Fluorescence, and Fourier Transformed Infrared measurements of the two dyes were carried out to evaluate their absorption, emission and binding characteristics. The Soret band of the dyes was almost the same while changes in the Q-band were observed. This observation was also confirmed in the fluorescence data where changes in peak intensity were due to Q-band. The surface morphology and elemental analysis of the porphyrin dye sensitized photoanodes were determined using Field Emission Scanning Electron Microscopy Imaging and Transmission Electron Microscopy Imaging. The nanocrystalline nature of the TiO2 and their interaction with the dyes were clearly observed under the electron microscopes. Cyclic voltammetry studies, current-voltage characteristics and the electrochemical impedance spectroscopic studies were also carried out. Solar-to-electric energy efficiency of H2TFP dye sensitized solar cell was higher (0.11%) than that of the zinc complex (0.08%). Thus the metal free porphyrin generated more power than the zinc complex under similar conditions. These efficiencies could be higher when anchoring groups are attached to the porphyrins. The free base H2TFP chromophore was found to possess the best photosensitization effect among the two porphyrin dyes studied which has been attributed by the flexibility of the dye to interact.
Acknowledgements
The work was financially supported by the University of Maryland System (Wilson E. Elkins Professorship), Constellation, an Exelon Company (E2-Ener- gy to Educate grant program) and Dept. of Education (SAFRA Title III Grant). The authors are also grateful to the Institution of Advancement, Coppin State University, for administrative help. The content is exclusively the responsibility of the authors and does not necessarily represent the official views of the funding agencies.
Cite this paper
Ghann, W., Chavez-Gil, T., Goede, C.I., Kang, H., Khan, S., Sobhi, H., Nesbitt, F. and Uddin, J. (2017) Photophysical, Electrochemical and Photovoltaic Properties of Porphyrin-Based Dye Sensitized Solar Cell. Advances in Ma- terials Physics and Chemistry, 7, 148-172. https://doi.org/10.4236/ampc.2017.75013
References
- 1. Wei, D. (2010) Dye Sensitized Solar Cells. International Journal of Molecular Sciences, 11, 1103-1113.
https://doi.org/10.3390/ijms11031103 - 2. Sugathan, V., John, E. and Sudhakar, K. (2015) Recent Improvements in Dye Sensitized Solar Cells: A Review. Renewable and Sustainable Energy Reviews, 52, 54-64.
- 3. Gratzel, M. (2003) Dye-Sensitized Solar Cells. Journal of Photochemistry and Photobiology C, 4, 145-153.
- 4. Gratzel, M. (2005) Solar Energy Conversion by Dye-Sensitized Photovoltaic Cells. Inorganic Chemistry, 44, 6841-6851.
https://doi.org/10.1021/ic0508371 - 5. O’Regan, B. and Gratzel, M. (1991) A Low-Cost, High-Efficiency Solar Cell Based on Dye-Sensitized Colloidal TiO2 Films. Nature, 353, 737-740.
https://doi.org/10.1038/353737a0 - 6. Hug, H., Bader, M., Mair, P. and Glatzel, T. (2014) Biophotovoltaics: Natural Pigments in Dye-Sensitized Solar Cells. Applied Energy, 115, 216-225.
- 7. Hao, S., Wu, J., Huang, Y. and Lin, J. (2006) Natural Dyes as Photosensitizers for Dye-Sensitized Solar Cell. Solar Energy, 80, 209-214.
- 8. Amadi, L., Jenny, S.S., Ahmed, A., Brown, N., Yadav, S., Brown, D., Ghann, W., Gayrama, A., Jiru, M. and Uddin, J. (2015) Creation of Natural Dye Sensitized Solar Cell by Using Nanostructured Titanium Oxide. Nanoscience and Nanoengineering, 3, 25-35.
https://doi.org/10.13189/nn.2015.030301 - 9. Ghann, W., Kang, H., Sheikh, T., Yadav, S., Chavez-Gil, T., Nesbitt, F. and Uddin, J. (2017) Fabrication, Optimization and Characterization of Natural Dye Sensitized Solar Cell. Scientific Reports, 7, Article No. 41470.
https://doi.org/10.1038/srep41470 - 10. Ludin, N.A., Al-Alwani Mahmoud, A.M., Bakar Mohamad, A., Kadhum, A.A.H., Sopian, K. and Abdul Karim, N.S. (2014) Review on the Development of Natural Dye Photosensitizer for Dye-Sensitized Solar Cells. Renewable and Sustainable Energy Reviews, 31, 386-396.
- 11. Yadav, S., Jenny, S.S., Ahmed, A., Amadi, L., Nesbitt, F., Ward, A.W.G., Brown, D., Uddin, J. and Uddin, N. (2015) Natural Light-Harvesting Sensitizers for Dye Sensitized Solar Cell. Energy and Environmental Engineering, 3, 94-99.
https://doi.org/10.13189/eee.2015.030403 - 12. Shalini, S., Balasundara Prabhu, R., Prasanna, S., Mallick, T.K. and Senthilarasu, S. (2015) Review on Natural Dye Sensitized Solar Cells: Operation, Materials and Methods. Renewable and Sustainable Energy Reviews, 51, 1306-1325.
- 13. Wu, W., Guo, F., Li, J., He, J. and Hua, J. (2010) New Fluoranthene-Based Cyanine Dye for Dye-Sensitized Solar Cells. Synthetic Metals, 160, 1008-1014.
- 14. Akhtaruzzaman, M., Islam, A., Yang, F., Asao, N., Kwon, E., Singh, S.P., Han, L. and Yamamoto, Y. (2011) A Novel Metal-Free Panchromatic TiO2 Sensitizer Based on a Phenylenevinylene-Conjugated Unit and an Indoline Derivative for Highly Efficient Dye-Sensitized Solar Cells. Chemical Communications, 47, 12400-12402.
https://doi.org/10.1039/c1cc15580f - 15. Chen, C.Y., Wang, M., Li, J.Y., Pootrakulchote, N., Alibabaei, L., Ngoc-Le, C.H., Decoppet, J.D., Tsai, J.H., Gratzel, C., Wu, C.G., Zakeeruddin, S.M. and Gratzel, M. (2009) Highly Efficient Light-Harvesting Ruthenium Sensitizer for Thin-Film Dye-Sensitized Solar Cells. ACS Nano, 3, 3103-3109.
https://doi.org/10.1021/nn900756s - 16. Klein, C., Nazeeruddin, M.K., Censo, D.D., Liska, P. and Gratzel, M. (2004) Amphiphilic Ruthenium Sensitizers and Their Applications in Dye-Sensitized Solar Cells. Inorganic Chemistry, 43, 4216-4226.
https://doi.org/10.1021/ic049906m - 17. Bhaumik, J., Weissleder, R. and McCarthy, J.R. (2009) Synthesis and Photophysical Properties of Sulfonamidophenyl Porphyrins as Models for Activatable Photosensitizers. The Journal of Organic Chemistry, 74, 5894-5901.
https://doi.org/10.1021/jo900832y - 18. Daphnomili, D., Landrou, G., Prakash Singh, S., Thomas, A., Yesudas, K., Bhanuprakash, K., Sharma, G.D. and Coutsolelos, A.G. (2012) Photophysical, Electrochemical and Photovoltaic Properties of Dye Sensitized Solar Cells Using a Series of Pyridyl Functionalized Porphyrin Dyes. RSC Advances, 2, 12899-12908.
https://doi.org/10.1039/c2ra22129b - 19. Daphnomili, D., Sharma, G.D., Biswas, S., Justin Thomas, K.R. and Coutsolelos, A.G. (2013) A New Porphyrin Bearing a Pyridinylethynyl Group as Sensitizer for Dye Sensitized Solar Cells. Journal of Photochemistry Photobiology A: Chemistry, 253, 88-96.
- 20. Gou, F., Jiang, X., Li, B., Jing, H. and Zhu, Z. (2013) Salicylic Acid as a Tridentate Anchoring Group for azo-Bridged Zinc Porphyrin in Dye-Sensitized Solar Cells. ACS Applied Materials & Interfaces, 5, 12631-12637.
https://doi.org/10.1021/am403987b - 21. Hart, A.S., Chandra, B.K.C., Gobeze, H.B., Sequeira, L.R. and D’Souza, F. (2013) Porphyrin-Sensitized Solar Cells: Effect of Carboxyl Anchor Group Orientation on the Cell Performance. ACS Applied Materials & Interfaces, 5, 5314-5323.
https://doi.org/10.1021/am401201q - 22. He, H., Gurung, A. and Si, L. (2012) 8-Hydroxylquinoline as a Strong Alternative Anchoring Group for Porphyrin-Sensitized Solar Cells. Chemical Communications, 48, 5910-5912.
https://doi.org/10.1039/c2cc31440a - 23. Higashino, T. and Imahori, H. (2015) Porphyrins as Excellent Dyes for Dye-Sensitized Solar Cells: Recent Developments and Insights. Dalton Transactions, 44, 448-463.
https://doi.org/10.1039/C4DT02756F - 24. Lan, C.M., Wu, H.P., Pan, T.Y., Chang, C.W., Chao, W.S., Chen, C.T., Wang, C.L., Lin, C.Y. and Diau, E.W.G. (2012) Enhanced Photovoltaic Performance with Co-Sensitization of Porphyrin and an Organic Dye in Dye-Sensitized Solar Cells. Energy & Environmental Science, 5, 6460-6464.
https://doi.org/10.1039/c2ee21104a - 25. Mai, C.-L., Moehl, T., Hsieh, C.-H., Décoppet, J.-D., Zakeeruddin, S.M., Gratzel, M. and Yeh, C.-Y. (2015) Porphyrin Sensitizers Bearing a Pyridine-Type Anchoring Group for Dye-Sensitized Solar Cells. ACS Applied Materials & Interfaces, 7, 14975-14982.
https://doi.org/10.1021/acsami.5b03783 - 26. Mathew, S., Yella, A., Gao, P., Humphry-Baker, R., Curchod, B.F.E., Ashari-Astani, N., Tavernelli, I., Rothlisberger, U., Nazeeruddin, M.K. and Gratzel, M. (2014) Dye-Sensitized Solar Cells with 13% Efficiency Achieved through the Molecular Engineering of Porphyrin Sensitizers. Nature Chemistry. 6, 242-247.
https://doi.org/10.1038/nchem.1861 - 27. Armarego, W.L. and Chai, C. (2009) Purification of Laboratory Chemicals. 6th Edition, Butterworth-Heinemann, Elsevier, UK.
- 28. Mamardashvili, N.Zh. and Golubchikov, O.A. (2001) Spectral Properties of Porphyrins and Their Precursors and Derivatives. Russian Chemical Reviews, 70, 577-606.
https://doi.org/10.1070/RC2001v070n07ABEH000661 - 29. Walker, F.A., Balke, V.L. and McDermott, G.A. (1982) Electronic Effects in Transition-Metal Porphyrins. 4. Effect of Unsymmetrical Phenyl Substitution on the NMR Spectra of a Series of Metal-Free and Zinc Tetraphenylporphyrins. Inorganic. Chemistry, 21, 3342-3348.
- 30. Kevin, M., Smith, K.M., Abraham, R.J. and Pearson, H. (1982) The NMR Spectra of Porphyrins—19. Tetrahedron, 38, 2441-2449.
- 31. Drouet, S., Merhi, A., Argouarch, G., Paul, F., Mongin, O., Blanchard-Desce, M. and Paul-Roth, C.O. (2012) Synthesis of New Luminescent Supramolecular Assemblies from Fluorenyl Porphyrins and Polypyridyl Isocyanurate-Based Spacers. Tetrahedron, 68, 98-105.
- 32. Gouterman, M. (1961) Spectra of Porphyrins. Journal of Molecular Spectroscopy, 6, 138-163.
- 33. Spellane, P.J., Gouterman, M., Antipas, A., Kim, S. and Liu, Y.C. (1980) Porphyrins. 40. Electronic Spectra and Four-Orbital Energies of Free-Base, Zinc, Copper, and Palladium Tetrakis(Perfluorophenyl)Porphyrins. Inorganic Chemistry, 19, 386-391.
https://doi.org/10.1021/ic50204a021 - 34. Gouterman, M. (1979) The Porphyrins. Vol. III, Academic Press, New York.
- 35. Liu, W., Shi, Y.-H., Wang, Y.-J., Shi, T.-S. and Zhang, W.-J. (2003) Synthesis of Tetra(4-n-Lauryloyloxyphenyl)Porphyrin Complexes and Its Liquid Crystalline Characterization. Chemical Journal of Chinese Universities, 24, 200-204.
- 36. Michaelian, K.H., Wen, Q., Billinghurst, B.E., Shaw, J.M. and Lastovka, V. (2012) Far- and Mid-Infrared Photoacoustic Spectra of Tetracene, Pentacene, Perylene and Pyrene. Vibrational Spectroscopy, 58, 50-56.
- 37. Boersma, C., Mattioda, A.L., Bauschlicher Jr., C.W., Peeters, E., Tielens, A.G.G.M. and Allamandola, L.J. (2009) The 5.25 and 5.7 μm Astronomical Polycyclic Aromatic Hydrocarbon Emission Features. The Astrophysical Journal, 690, 1208.
https://doi.org/10.1088/0004-637X/690/2/1208 - 38. Joblin, C., d’Hendecourt, L., Léger, A. and Défourneau, D. (1994) Infrared Spectroscopy of Gas-Phase PAH Molecules. Astronomy and Astrophysics, 281, 923-936.
- 39. Szczepanski, J. and Vala, M. (1993) Infrared Frequencies and Intensities for Astrophysically Important Polycyclic Aromatic Hydrocarbon Cations. Astrophysical Journal, 414, 646-655.
https://doi.org/10.1086/173110 - 40. Gritzner, G. and Kuta, J. (1984) Recommendations on Reporting Electrode Potentials in Nonaqueous Solvents. Pure & Applied Chemistry, 56, 461-466.
https://doi.org/10.1351/pac198456040461 - 41. Rault-Berthelot, J., Paul-Roth, C., Poriel, C., Juillard, S., Ballut, S., Drouet, S. and Simonneaux, G. (2008) Comparative Behaviour of the Anodic Oxidation of Mono-, Di- and Tetra-Arylporphyrins: Towards New Electroactive Materials with Variable Bandgaps. Journal of Electroanalytical Chemistry, 623, 204-214.
- 42. Felton, R.H. and Linschitz, H. (1966) Polarographic Reduction of Porphyrins and Electron Spin Resonance of Porphyrin Anions. Journal of the American Chemical Society, 88, 1113-1116.
https://doi.org/10.1021/ja00958a004 - 43. Kadish, K.M., Sazou, D., Liu, Y.M., Saoiabi, A., Ferhat, M. and Guilard, R. (1988) Electrochemical and Spectral Characterization of the Monomer-Dimer Equilibrium Involving (Meso-tetrakis(1-methylpyridinium-4-yl)porphinato)nickel(II) in Dimethylformamide. Inorganic Chemistry, 27, 686-690.
https://doi.org/10.1021/ic00277a023 - 44. Engelmann, F.M., Losco, P., Winnischofer, H., Araki, K. and Toma, H.E. (2002) Synthesis, Electrochemistry, Spectroscopy and Photophysical Properties of a Series of Meso-Phenylpyridylporphyrins with One to Four Pyridyl Rings Coordinated to [Ru(bipy)2Cl]+ Groups. Journal of Porphyrins and Phthalocyanines, 6, 33-42.
https://doi.org/10.1142/S1088424602000063 - 45. Paul-Roth, C.O. and Simonneaux, G. (2006) Porphyrins with Fluorenyl and Fluorenone Pendant arms. Tetrahedron Letters, 47, 3275-3278.
- 46. Paul-Roth, C., Rault-Berthelot, J., Simonneaux, G., Letessier, J. and Bergamini, J.-F. (2007) Selective Anodic Preparation of 1D or 2D Electroactive Deposits from 5, 15-Bis-(9H-fluoren-2-yl)-10,20-Diphenyl Porphyrins. Journal of Electroanalytical Chemistry, 606, 103-116.
- 47. Paul-Roth, C.O. and Simonneaux, G. (2006) Porphyrins with Fluorenyl and Fluorenone Pendant Arms as Red-Light-Emitting Devices. Comptes Rendus Chimie, 9, 1277-1286.
- 48. Reed, R.A., Purrello, R., Prendergast, K. and Spiro, T.G. (1991) Resonance Raman Characterization of the Radical Anion and Triplet States of Zinc Tetraphenylporphine. The Journal of Physical Chemistry, 95, 9720-9727.
https://doi.org/10.1021/j100177a024 - 49. Li, B., Li, J., Fu, Y. and Bo, Z. (2004) Porphyrins with Four Monodisperse Oligofluorene Arms as Efficient Red Light-Emitting Materials. Journal of the American Chemical Society, 126, 3430-3431.
https://doi.org/10.1021/ja039832y - 50. Lever, A.B.P. (1990) Electrochemical Parametrization of Metal Complex Redox Potentials, Using the Ruthenium(III)/Ruthenium(II) Couple to Generate a Ligand Electrochemical Series. Inorganic Chemistry, 29, 1271-1285.
https://doi.org/10.1021/ic00331a030