Advances in Materials Physics and Chemistry
Vol.4 No.2(2014), Article ID:42832,9 pages DOI:10.4236/ampc.2014.42004
Morphological and Optical Properties of Dimetallo-Phthalocyanine-Complex Thin Films
1Facultad de Ingeniería, Universidad Anáhuac (México Norte), Huixquilucan, México
2Instituto de Física, Universidad Nacional Autónoma de México, México, D.F., México
3Instituto de Investigaciones en Materiales, Universidad Nacional Autónoma de México, México, D. F., México
Email: *elena.sanchez@anahuac.mx
Copyright © 2014 María Elena Sánchez-Vergara et al. This is an open access article distributed under the Creative Commons Attribution License, which permits unrestricted use, distribution, and reproduction in any medium, provided the original work is properly cited. In accordance of the Creative Commons Attribution License all Copyrights © 2014 are reserved for SCIRP and the owner of the intellectual property María Elena Sánchez-Vergara et al. All Copyright © 2014 are guarded by law and by SCIRP as a guardian.
Received December 11, 2013; revised January 15, 2014; accepted January 22, 2014
KEYWORDS
Phthalocyanines; Organic Semiconductors; Thin Films; Optical Gap
ABSTRACT
In this work, the synthesis of semiconducting molecular materials formed from metallo-phthalocyanines (MPcs) and bidentate amines is reported. Powder and thin-film samples of the synthesized materials, deposited by vacuum thermal evaporation, show the same intra-molecular bonds in IR-spectroscopy studies. The morphology of the deposited films was studied using scanning electron microscopy and atomic force microscopy. The optical parameters have been investigated using spectrophotometric measurements of transmittance in the wavelength range 200 - 1100 nm. The absorption spectra in the UV-Vis region for the deposited samples showed two bands, namely the Q and Soret bands. The optical band gap values of the thin films were calculated from the absorption coefficient α in the absorption region and were found to be around 1.4 - 1.6 eV. The dependence of the Tauc and Cody optical gaps on the thickness of the film was also determined.
1. Introduction
Organic semiconductors remain promising candidates for future technological devices due to their properties and variants [1]. In this context, phthalocyanine (Pc) molecules are particularly appealing because of their unique optical and electrical properties. In general, they can be classified as p-type semiconductors characterized by low mobility and low carrier concentration [2-6]. Phthalocyanine represents a large family of heterocyclic conjugated molecules, consisting of four benzoisoindole units, with potential applications in the fabrication of solar cells, chemical sensors, electronic displays and optical data storage systems [3-12]. Phthalocyanine compounds were first observed as highly colored by-products of O-cyanobenzamide preparation from phthalamide and acetic anhydride [13]. Phthalocyanine (Pc) is a planar molecule formed by a porphyrin-like central ring bonded to four aromatic rings [14,15]. Phthalocyanines have rich coordination chemistries and can be complex with most metallic elements. The most widely investigated materials of this family are copper, nickel and magnesium phthalocyanines in the forms of single crystal and thin film [13].
Although lithium and sodium phthalocyanines have received comparatively less attention [16-18], they seem to have some characteristics that make them suitable active materials for the fabrication of optical sensors. The coordination of phthalocyanine ligands with the lithium and sodium atoms forms monometallo or dimetallo complexes [16-18]. They are remarkably soluble in organic solvents and have demonstrated to be useful precursors in the syntheses of novel metallo-phthalocyanines, such as the sandwich-type complexes [16-18]. The UV-Vis absorption spectra of dilithium and disodium phthalocyanines (Li2Pc and Na2Pc) have been studied, and strong similarities with the normal closed-shell MPcs, such as ZnPc, have been noticed. The chemical or electrochemical oxidation of M2Pc (M = Li, Na) produces the monometallo phthalocyanine MPc (M = Li, Na), which has a relatively high electric conductivity and is considered as an intrinsic molecular semiconductor [2-6, 16]. These materials can be easily sublimated in vacuum, resulting in high-purity thin films without decomposition. As organic semiconducting thin films are made up of individual molecules held together by weak van der Waals forces, the optical properties of the solid are strongly influenced by the degree of intermolecular orbital overlap. In the case of phthalocyanine molecules, the implication is that charge transport involves some degree of anisotropy [19].
Optical properties, such as absorption and emission, are frequently anisotropic, a characteristic that has been used for organic light emitting diodes as well as for organic solar cells [8-12]. They are also widely used as laser dyes capable of excellent optical amplification in the red region because of their good light absorption in the UV-Vis region [20-24]. Interest in Li2Pc and Na2Pc is particularly related to their optical and semiconducting properties. The band gap is the most important parameter in the physics of semiconductors and is usually deduced from the optical absorption spectrum [25]. In a crystalline semiconductor, the absorption spectrum terminates abruptly at points defined by the energy gap. In amorphous semiconductors, a tail in the absorption spectrum encroaches into the gap region [26]. This tail in the absorption spectrum, arising as a consequence of the disorder which characterizes these semiconductors, makes the absorption edge of an amorphous semiconductor difficult to define experimentally. As a result, various empirical measures for the optical gap have been devised [26]. Two of these models, namely the Tauc and the Cody models, are widely applicable [26,27]. The Tauc model has served as the standard empirical model, whereby the optical gap of an amorphous semiconductor may be determined [26]. This model suggests that the curvature in the spectral dependence of α(hν) is the dominant factor responsible for the increase in the Tauc optical gap, while the Cody model considers the spectral dependence of the refractive index, n(hν), as the dominant factor in the determination of the optical gap [26,27].
In this work, a method has been developed to synthesize amorphous semiconductors from the reaction of dimetallo-phthalocyanines (M2Pc) and bidentate amines. New thin films have been produced by vacuum thermal evaporation. The specific aims are the determination of the optical parameters involved in the principal optical transitions of the UV-Vis region and the application of the Tauc and Cody models in the determination of the band gap [26,27]. We determine the dependence of the Tauc and Cody optical gaps associated with amorphous dimetallo-phthalocyanines on the thickness of the film, taking into account that few studies have been made to check their validity in the case of two central metallic atoms. The application of the Tauc and Cody models enables us to establish some important correlations between film structure and optical absorption properties. Film characterization was performed through infrared spectroscopy, scanning electron microscopy (SEM) and atomic force microscopy (AFM). It is worthwhile noting that these materials have also attracted interest in recent times because of their semiconductivity and chemical stability [28].
2. Materials and Methods
2.1. Synthesis: Starting Material and Chemicals
All the reactants employed were acquired from Aldrich Chemical Co., Inc. The reactants were used with no previous purification. In general, dimetallo-phthalocyanines could be purified by Soxhlet extraction of commercial material. A solution of the M2Pc (M = Li, Na) in absolute ethanol was added to a solution of the appropriate diamine ligand [1,4-diaminobutane (BDA) or 1,4-diaminoanthraquinone (AqDA)] in the same solvent. The resulting mixture was maintained under reflux for about 3 days until a precipitate was obtained. The product was then filtered, washed with absolute ethanol and then dried in vacuum. The product was purified from 1:1 ethanol-water.
BDALiPc. 0.30 g (0.57 mmol) of C32H16N8Li2 in 25 mL ethanol, 0.30 g (3.4 mmol) of 1,4-diaminebutane in 25 mL ethanol. Blue powder, yield 87%, Calculated analysis for C36H26N9Li2: C, 72.24%, N, 21.07%, H, 4.35%; Found: C, 72.36%, N, 21.56%, H, 4.31%; m.p. 350˚C (dec).
AqDALiPc. 0.30 g (0.57 mmol) of C32H16N8Li2 in 25 mL of ethanol, 0.30 g (1.3 mmol) of 1,4-diamineanthraquinone in 25 mL ethanol. Violet powder, yield 62%, Calculated analysis for C46H26N10O2Li2: C, 72.25%, N, 18.32%, H, 3.40%; Found: C, 72.96%, N, 17.66%, H, 3.94%; m.p. 350˚C (dec).
BDANaPc. 0.30 g (0.54 mmol) of C32H16N8Na2 in 25 mL ethanol, 0.30 g (3.4 mmol) of 1,4-diaminebutane in 25 mL ethanol. Blue powder, yield 84%, Calculated analysis for C36H26N9Na2: C, 68.57%, N, 20.0%, H, 4.1%; Found: C, 68.46%, N, 19.49%, H, 4.30%; m.p. 330˚C (dec).
AqDANaPc.0.30 g (0.54 mmol) of C32H16N8Na2 in 25 mL of ethanol, 0.30 g (1.3 mmol) of 1,4-diamineanthraquinone in 25 mL ethanol. Blue powder, yield 71%, Calculated analysis for C46H26N10O2Na2: C, 69.34%, N, 17.58%, H, 3.29%; Found: C, 69.32%, N, 17.05%, H, 3.76%; m.p. 330˚C (dec).
2.2. Powder Characterization
The characterization of powder materials was carried out, for IR spectroscopy, in a Bruker spectrophotometer, model Tensor 27, using KBr pellets for solid samples in the 4000 to 300 cm−1 region with an 8 cm−1 resolution. Mass spectra (FAB+) were measured on a 3-nitrobenzyl alcohol support in the positive ion mode on a Jeol JMS-SX102A instrument.
2.3. Thin Film Deposition
Thin film deposition of the synthesized compounds -BDALiPc, AqDALiPc, BDANaPc, AqDANaPcwas carried out by vacuum thermal evaporation onto quartz and (100) single-crystalline silicon (c-Si) 200 Ω-cm wafers. The quartz substrates were ultrasonically degreased in warm methanol and dried under a nitrogen atmosphere. The silicon substrates were chemically etched with a p-etch solution (10 ml HF, 15 ml HNO3 and 300 ml H2O) to remove the native oxide from the c-Si surface. In order to achieve high purity for these thin films, a vacuum chamber was used with a diffusion pump and a special tungsten crucible with a double-grid cover. Quartz fiber was added inside the crucible to avoid the ejection of grains towards the substrate at a temperature of 298 K. The evaporation temperature in the boat was 453 K, which is lower than the decomposition temperature previously evaluated by thermogravimetric study of the materials synthesized. This value was measured by means of a chromel-alumel K-type thermocouple. All samples were obtained by using the same deposition system, with the crucible and substrates arranged in the same geometry. The pressure in the vacuum chamber before the film deposition (1 × 10⁻⁶ Torr), the amount of mass inside the crucible (0.1 g) and the evaporation rate (74 Å/s) were the same in all cases. The thicknesses were monitored during deposition with a quartz crystal monitor and were subsequently checked with ellipsometry.
2.4. Thin Film Characterization
(i) IR measurements were obtained with a Nicolet iS5-FT spectrophotometer, using silicon flakes as substrate for the thin films. (ii) For SEM, a Leica Cambridge scanning electron microscope (model Stereoscan 440) was coupled to a microanalysis system and operated at a voltage of 20 kV and a focal distance of 25 mm with the thin films on the quartz substrate. (iii) AFM characterization used a JEOL microscope, model JSPM-4210, in the Tapping (AFM) work mode. For AFM characterization of the films, quartz substrates were used. (iv) Ultraviolet-visible spectroscopy was carried out in a Unicam spectrophotometer; model UV300 with a quartz substrate. (v) Film thickness and refractive index were determined by ellipsometry. This was carried out in a Gaertner Scientific Corporation ellipsometer (model L117) with the He-Ne laser operating at 630 nm and using silicon flakes as substrate.
3. Results and Discussion
IR spectroscopy was used to determine the presence of the most important and representative functional groups (see Figure 1), and whether there were significant chemical changes in the materials during the vacuum thermal evaporation process. Due to the thermal stability of these compounds, chemical changes or reactions were not expected to occur. Table 1 shows the characteristic bands for these compounds. These results suggest that the vacuum thermal evaporation and deposition processes do not affect film formation, in contrast with other bimetallic complexes, where material decomposition occurs [29,30]. It is worth noting that a slight difference is always expected in all thin films deposited by any method, since the inner stresses in the films affect the angles and energies of the intramolecular bonds. Although the deposited material is amorphous in nature, it is formed by the same chemical units as the material in the synthesized powder. The absorption peaks lie predominantly in the fingerprint region. The peaks responsible for carbon/nitrogen stretching and bending occur at 1587, 1487, 1328, 1282, and 1057 cm−1. The peaks located at 1167, 1115, 779, and 750 cm−1 result from the interaction of carbon with the peripheral-ring hydrogen atoms [18]. The peaks at 1606 and 1093 cm−1 result from a carbon/ carbon stretch within the macrocyclic ring. Notable peaks also occur at 1706, 1454, 887, and 729 cm−1; they all represent carbon/hydrogen interactions within the macrocyclic ring of Li2Pc [10,19] and the bidentate amine. Finally, AqDANaPc and AqDALiPc have the peak cor-
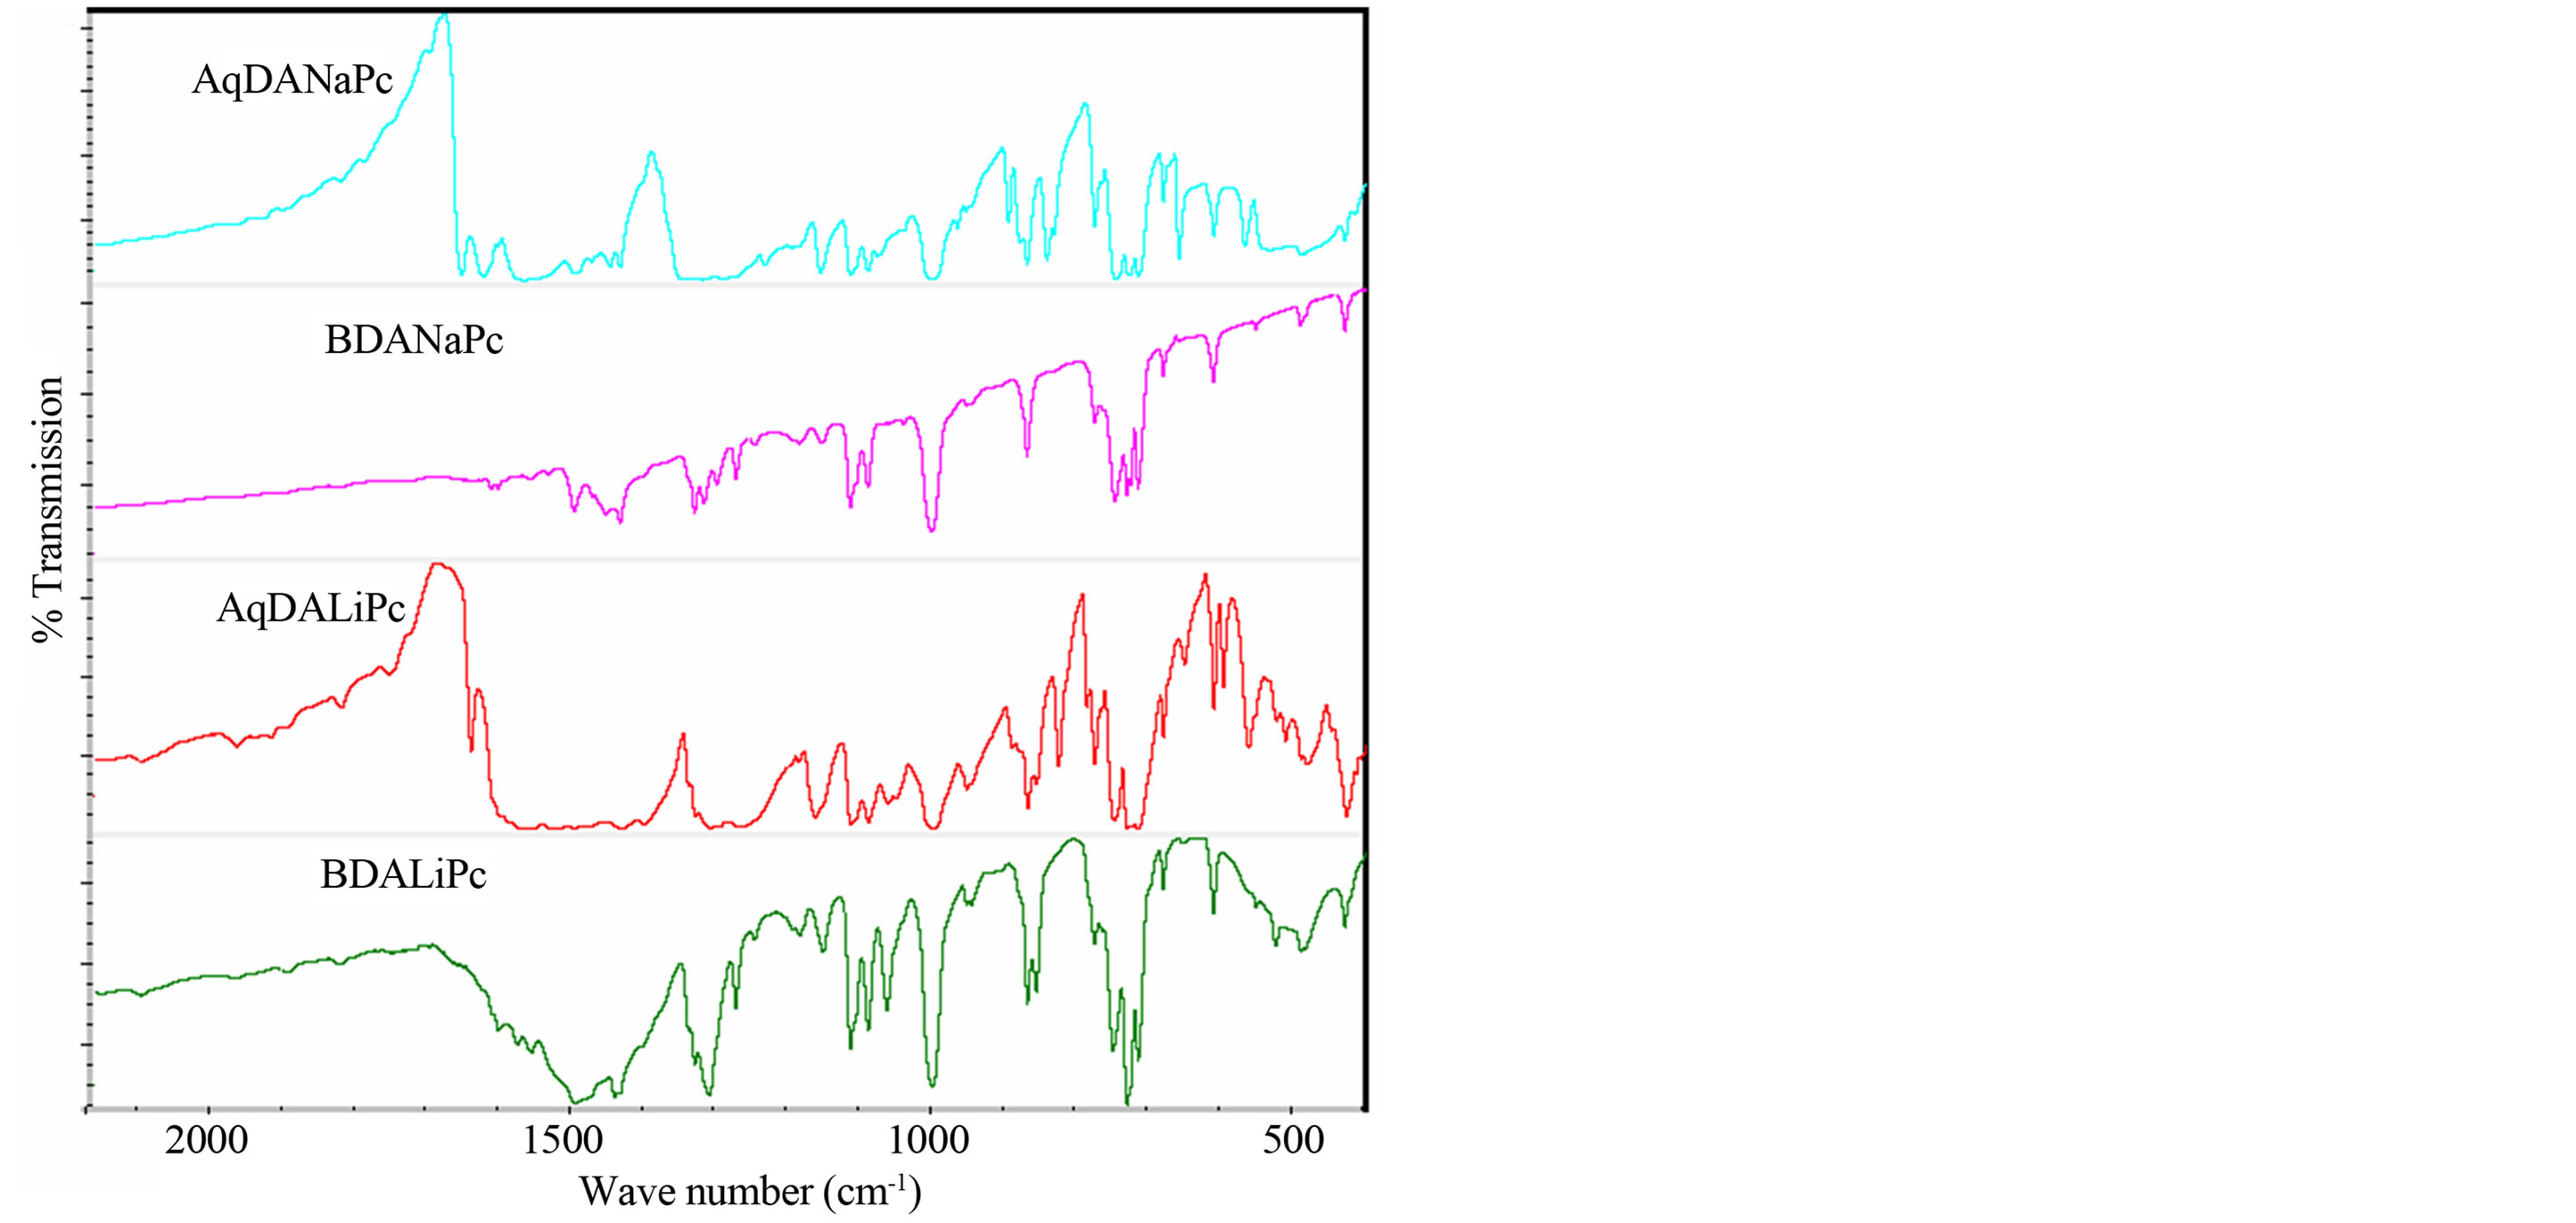
Figure 1. Infrared absorption spectra in KBr pellets.
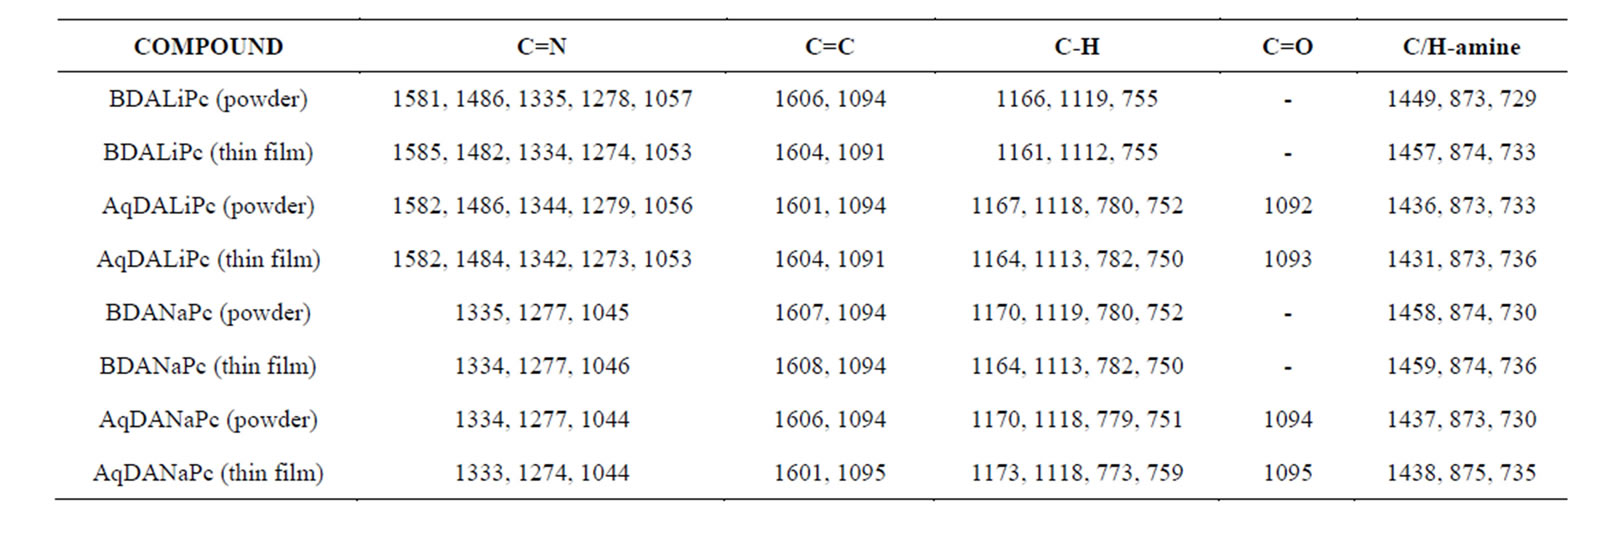
Table 1. IR (cm−1) characteristic bands for powder and thin films.
responding to the anthraquinone group C = O at around 1092 - 1095 cm−1 [31].
The positive-ion fast-atom bombardment (FAB) mass spectra of the LMPcs derivatives were obtained. It is worth mentioning that these compounds have low solubility. FAB mass spectra show signals for M2Pc (M = Li, Na) at 526 m/z, [C32H16N8Li2]+ and 558 m/z [C32H16N8Na2]+. The BDALiPc and BDANaPc spectra exhibit a small fragment related to 1,4-diaminobutane at 88 m/z [C4H12N2]+ and the signal corresponding to the new compounds at 630 m/z [C36H26N9Na2]+ and 616 m/z [C36H26N9Li2]+, respectively, with the loss of one (NH2) group. AqDALiPc and AqDANaPc spectra show the fragment representing the 1,4-diaminoanthraquinone at 238 m/z [C14H10N2O2]+. The signal at 764 and 796 m/z also represents the [C46H26N10O2Li2]+ and [C46H26N10O2Na2]+ group. These results confirm the presence of both the M2Pc and the amine compound.
All materials in the SEM micrographs had an amorphous appearance with no periodicity. Figure 2(a) shows the micrograph at 1500× corresponding to the BDALiPc thin film. It is observed that the sample has a flat surface with two apparent phases. One phase shows a coating with several ramifications and low relief. The micrographs of thin films AqDALiPc and BDANaPc show that the morphology of each material is quite regular (Figures 2(b) and (c)); the surface of each sample has a smooth appearance and seems to have smaller elements. In the 1500× micrograph of AqDANaPc (Figure 2(d)), one can readily find smooth grains of a generally round shape, although some of them show rather capricious forms. During the deposition process, when the molecules reach the portion of the substrate at the lowest temperature, their kinetic energy is insufficient for them to have a large surface mobility. Thus, the long-range order which is characteristic of crystals is not achieved and an amorphous film structure results.
The variations in the microscopic morphology and roughness of the films deposited onto quartz substrates were examined by atomic force microscopy and are

Figure 2. SEM micrographs of (a) BDALiPc; (b) AqDALiPc; (c) BDANaPc and (d) AqDANaPc thin films at 1500×.
shown in Figure 3 and Table 2. 3D micrographs permit a large surface inspection of the micro-structural arrays, topological structure, porosity and film quality of the deposited layers. Three AFM scans were made for each film; the initial one at 10 μm and then two subsequent scans at 5 μm in order to verify that a similar surface was analyzed. For the purposes of this work, it is expected that such morphological variations as observed in the film samples will relate to other important physical properties. All films nearly completely covered the substrate. Thin films from samples BDALiPc and BDANaPc (Figures 3(a) and (c)) show a very similar aspect. Both films are extremely homogeneous and a fine granular structure can be observed in them. In the case of film deposited onto quartz from AqDALiPc, a heterogeneous distribution is seen and particles agglomerate to generate irregular structures (Figure 3(b)). On the other hand, in the film deposited from AqDANaPc (Figure 3(d)), particles agglomerate to generate larger structures with a reasonably homogeneous distribution.
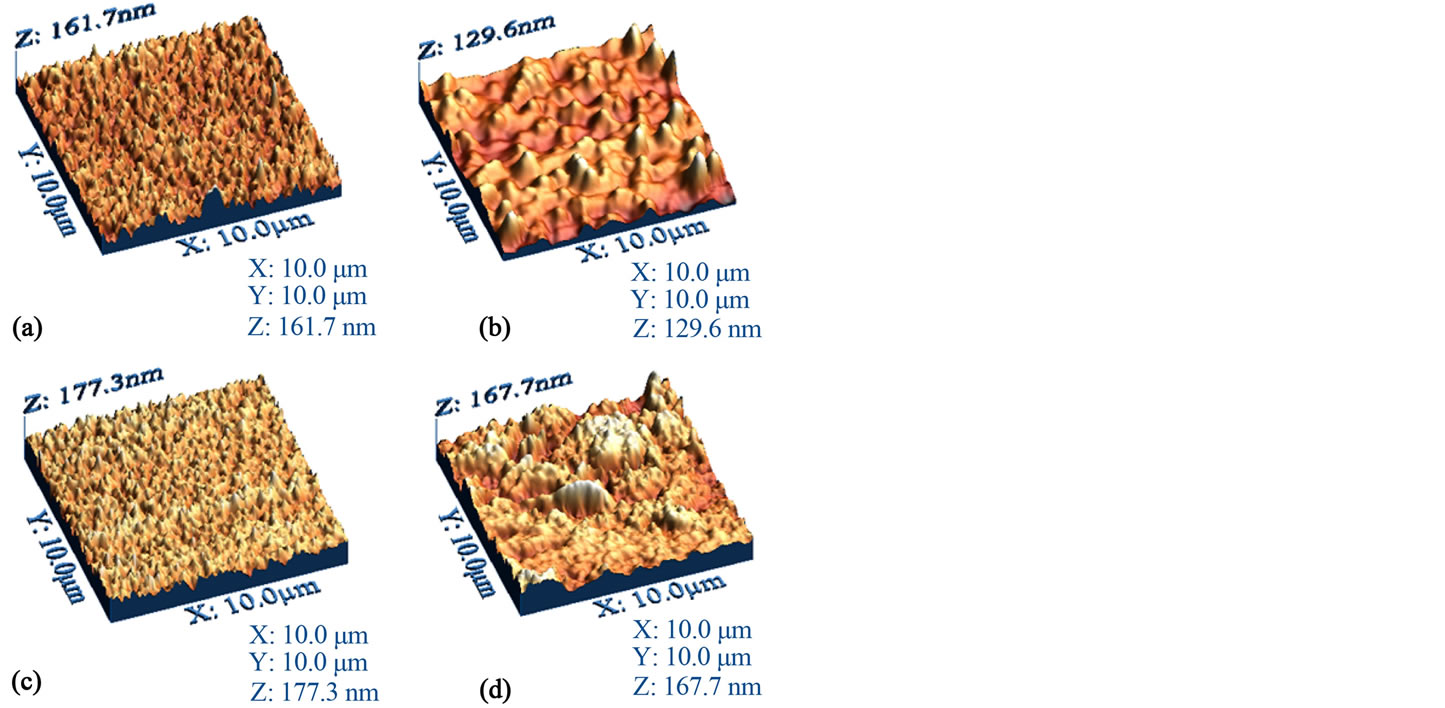
Figure 3. AFM three-dimensional images of films from compounds (a) BDALiPc; (b) AqDALiPc; (c) BDANaPc and (d) AqDANaPc onto quartz.
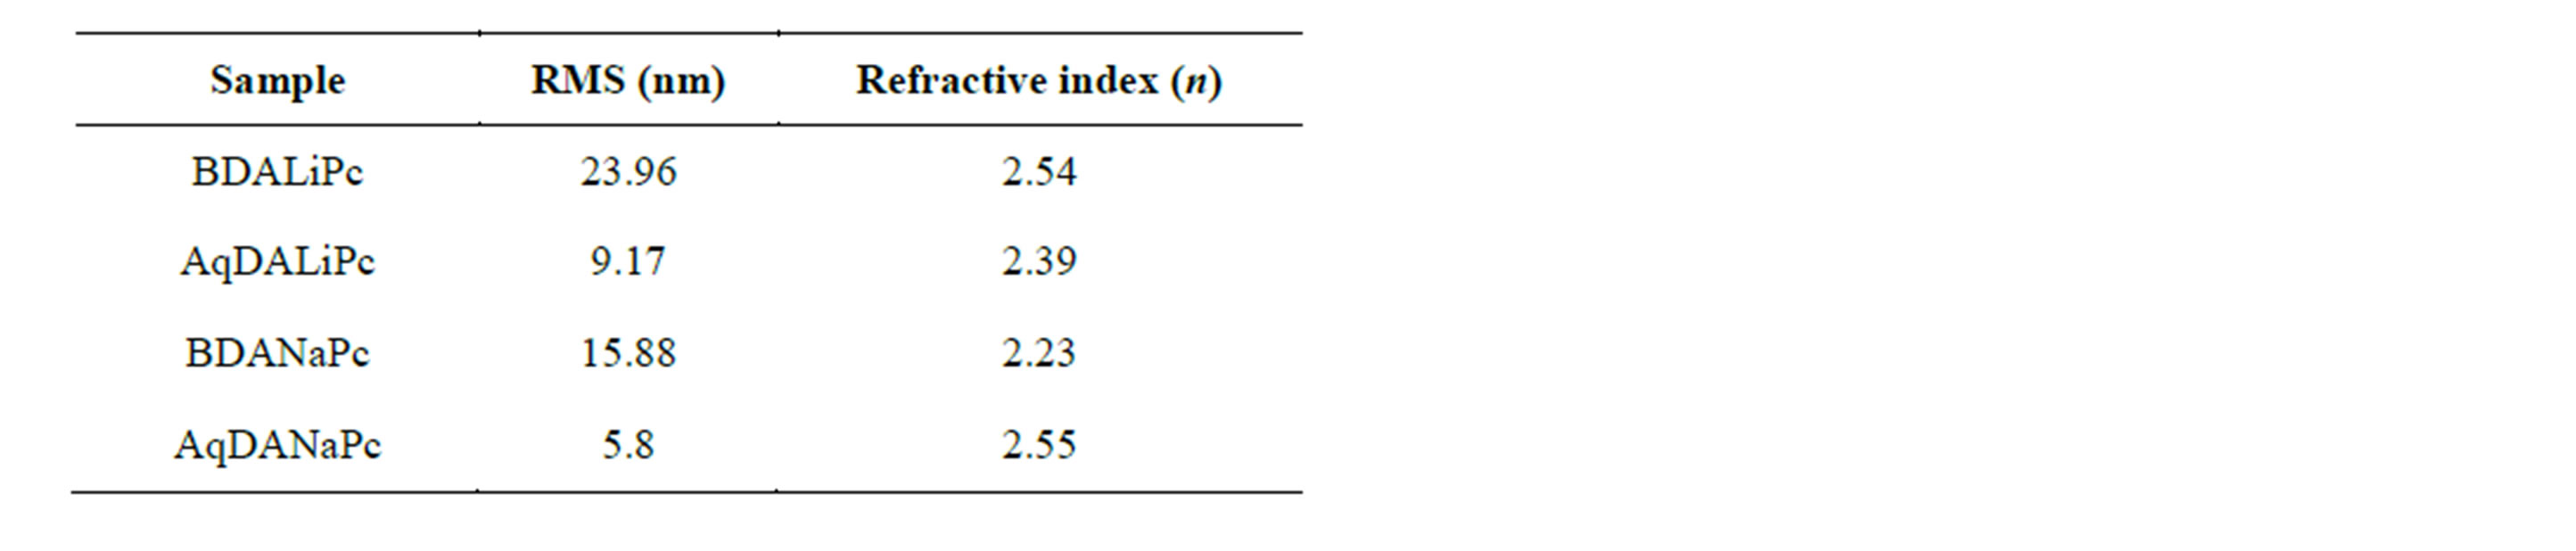
Table 2. Roughness and refractive index of the thin films.
The calculated RMS wrinkle heights for the thin films are shown in Table 2. This evaluation was performed on three different sites. The difference in the roughness values may be related to the different bidentate ligand in each molecular material. It appears that the aliphatic amine group in BDALiPc and BDANaPc acts as a Lewis base with a pair of available electrons. The nitrogen atom intervenes in the delocalized orbital of the aromatic ring, delocalizing the non-shared amine group electron pair within this structure. Hence, the amine group activates the aromatic ring into an oxidation state, due to the influence of electrophilic agents such as atmospheric oxygen, as well as other oxidation products which might affect the film’s surface [28].
Optical absorption measurements are widely used to characterize the electronic properties of the materials through the determination of parameters describing the electronic transitions, such as band gap, valence band tails and excited state lifetime [32]. The UV-Vis spectra for metallo-phthalocyanines originate from the molecular orbitals within the 18-π electron system and from the overlapping orbitals on the central metal atom. Phthalocyanines have two typical absorption bands, namely the Q band in the visible region (530 - 800 nm) and the B or Soret band in the near-ultraviolet region (300 - 400 nm) [20-24]. The optical transmittance spectra of the thin-film compounds deposited on quartz were recorded from 200 to 1100 nm and are shown in Figure 4. Differences in the transmittance of the films under examination can be attributed to changes in film thickness and their aggregation state, as observed in the AFM-micrographs (see Figure 3). It was also observed that the positions of the transmittance bands were weakly influenced by the backbone structure of these compounds.
The UV-Vis spectra of BDALiPc and AqDALiPc exhibited characteristic Q and B bands, one in the visible region at 688 and 530 nm, respectively (Q-band), attributed to the π → π* transition from the highest occupied molecular orbital (HOMO) to the lowest unoccupied molecular orbital (LUMO) of the pc2− ring, and the other in the UV region at 333 and 306 nm (B-band), respectively, for BDALiPc and AqDALiPc, arising from the deeper π levels → LUMO transition. The electronic spectra of the BDANaPc and AqDANaPc show the characteristic Q-band absorptions at 613 - 716 and 640 - 707 regions. B bands of the BDANaPc and AqDANaPc arising from the deeper π levels → LUMO transitions are observed in the UV region at about 302 - 340 and 303 - 357 nm, respectively. The Q-band is related to the amine addition to the metallic ion in the phthalocyanine. The presence of this absorption band may be interpreted as an overlap of π orbitals through the bidentate ligand. The conjugated double bonds within the structure of the films produce electron orbital overlapping between the molecules (π orbitals). Electrons are therefore able to transfer energy throughout the structure and become responsible for the absorption spectra. The Soret band is due to electronic transitions between molecules of an intermediate ionic degree that characterize the synthesized molecular materials. The changes in the UV-Vis spectra are due to the contributions of the central elements in the Pc ring to the molecular orbitals in this region: the lowest unoccupied molecular orbital of Li2Pc is lower in energy than the LUMO of Na2Pc [17]. The thin films absorb light from either side of the blue-green region and can be used as photoconductive materials and color filters [24].
The optical band gap was determined from the analysis
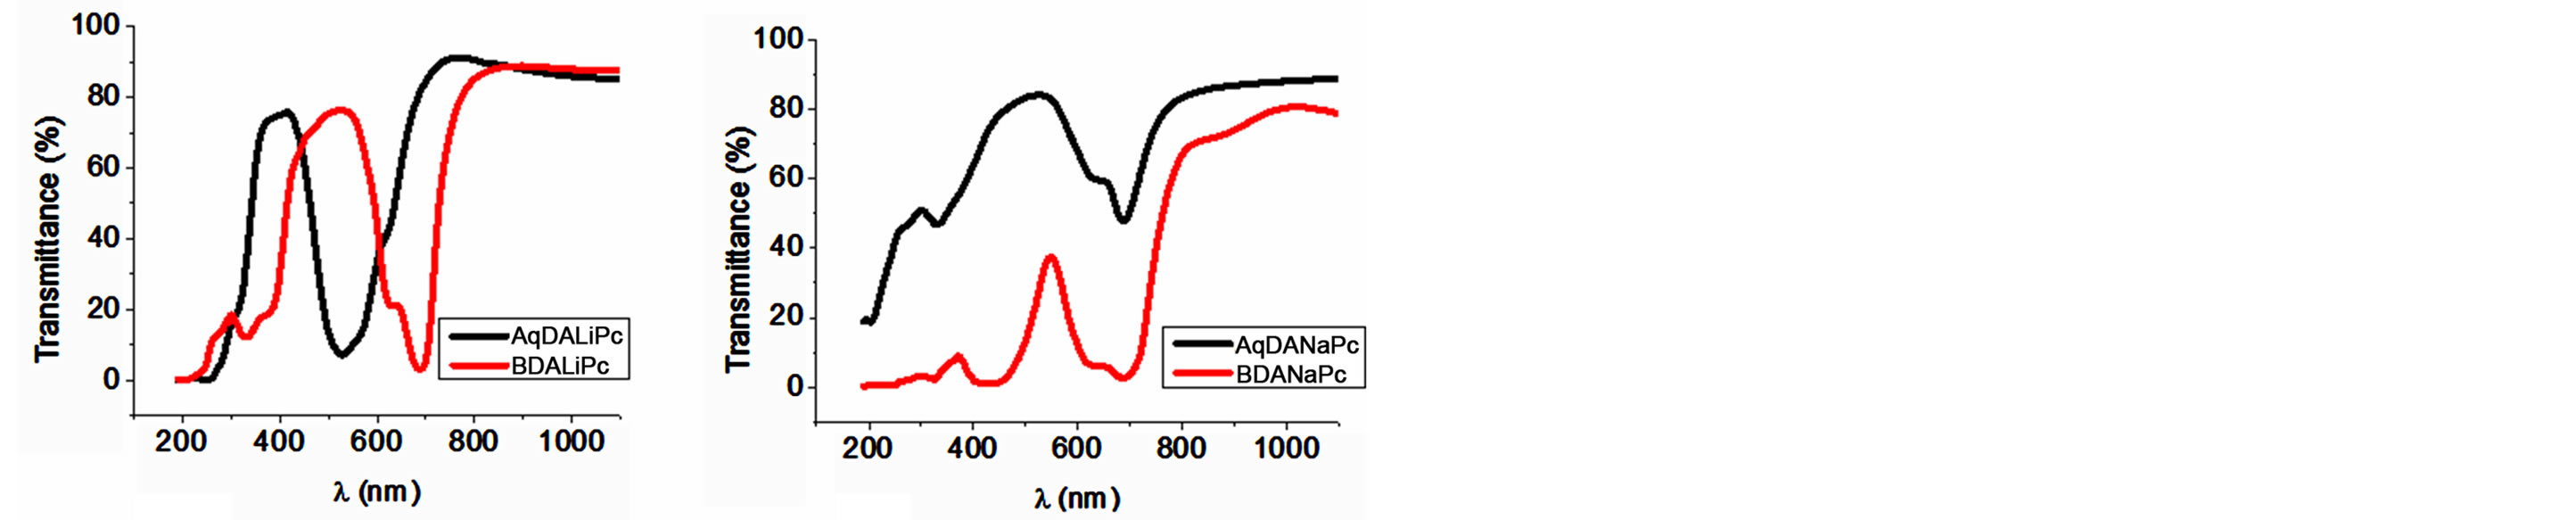
Figure 4. UV-Vis transmission spectra of (a) LDALiPc and (b) LDANaPc thin films.
of the spectral dependence of the absorption near the fundamental absorption edges. Evaluation of the absorption coefficient α is defined by the Lambert-Beer law and can be calculated from the optical transmittance [33,34]:
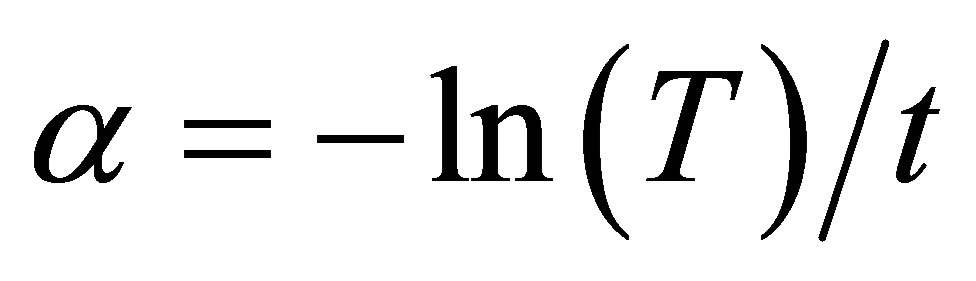
T is the transmittance and t is the film thickness (see Table 3), which was evaluated by ellipsometry. The absorption coefficient α in many amorphous semiconductors shows an exponential dependence on photon energy usually obeying the empirical relation [26-28]:
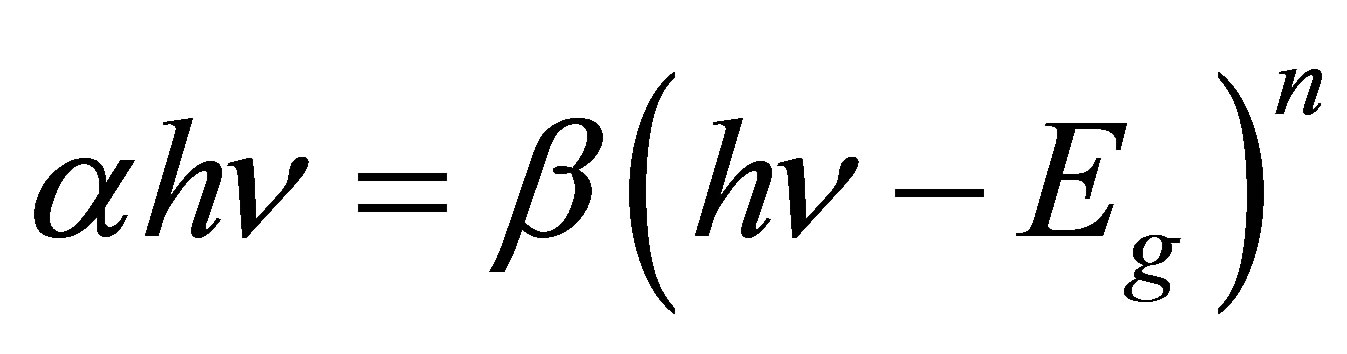
The factor β depends on the transition probability and can be assumed to be constant within the optical frequency range and n is a number characterizing the transition process. For allowed direct transitions, n = ½, and for allowed indirect transitions, n = 2. Thus, the optical gaps Egd and Egi for both transitions could be determined from the extrapolation to zero of the linear regions of the (αhυ)2 = f(hν) and (αhυ)½ = f(hν) curves, respectively [21]. The theory of Bardeen et al. [21,35] has been successfully applied to analyze the absorption edge of different amorphous semiconductors. In amorphous semiconductors, the optical transitions are dominated by the so-called indirect interband transitions, as the absorption (α ˂ 104 cm−1) is related to indirect interband transitions [21]. In a disordered semiconductor, such as BDALiPc, AqDALiPc, BDANaPc and AqDANaPc, distributions of electronic states encroach into the otherwise empty gap region between the valence band and the conduction band. As a consequence, there is no true gap in the distributions of electronic states [27]. Despite this fact, for the purposes of this analysis, we consider two such optical gaps, the Tauc and Cody gaps. The Tauc model assumes that, in amorphous semiconductors, disorder will relax the stringent momentum conservation rules that dominate crystalline optical response considerations [26,27]. The Tauc model also argues, drawing upon the crystalline semiconductor case, that the momentum matrix element is independent of the photon energy, hν. As a consequence, the optical gap associated with the amorphous thin film is determined through an extrapolation of the linear trend observed in the spectral dependence of (αhν)1/2 over a limited range of hν [26,27].
The Tauc optical gap is defined as occurring at the intersection of this linear extrapolation with the abscissa axis [26,27]. In order to gain some appreciation regarding how the film thickness associated with BDAMPc and AqDAMPc (M = Li, Na) influences the evaluation of the corresponding Tauc optical gap, consider Figure 5, which shows the dependence of the absorption coefficient on photon energy and in which the Tauc optical gap determination is shown for four different film thicknesses (Table 3). Figure 5 indicates that BDAMPc and AqDAMPc thin films have a strong absorption band around 1.4 - 1.6 eV and a somewhat weaker band in the region between 2.0 and 2.3 eV. Similar results were obtained for NiPc thin films [7], the analysis of the spectral behavior revealing two indirect allowed transitions. Given the nature of the curvature, as shown in Figure 5, the Tauc optical gap corresponding to the thinner film is smaller (see Table 3). This increase in the Tauc optical gap with increasing film thickness has been attributed to a number of factors [26,27]; our analysis suggests that curvature in the Tauc plot is the dominant responsible factor. Thus, the Cody model is theoretically applicable to the BDAMPc and AqDAMPc thin films.
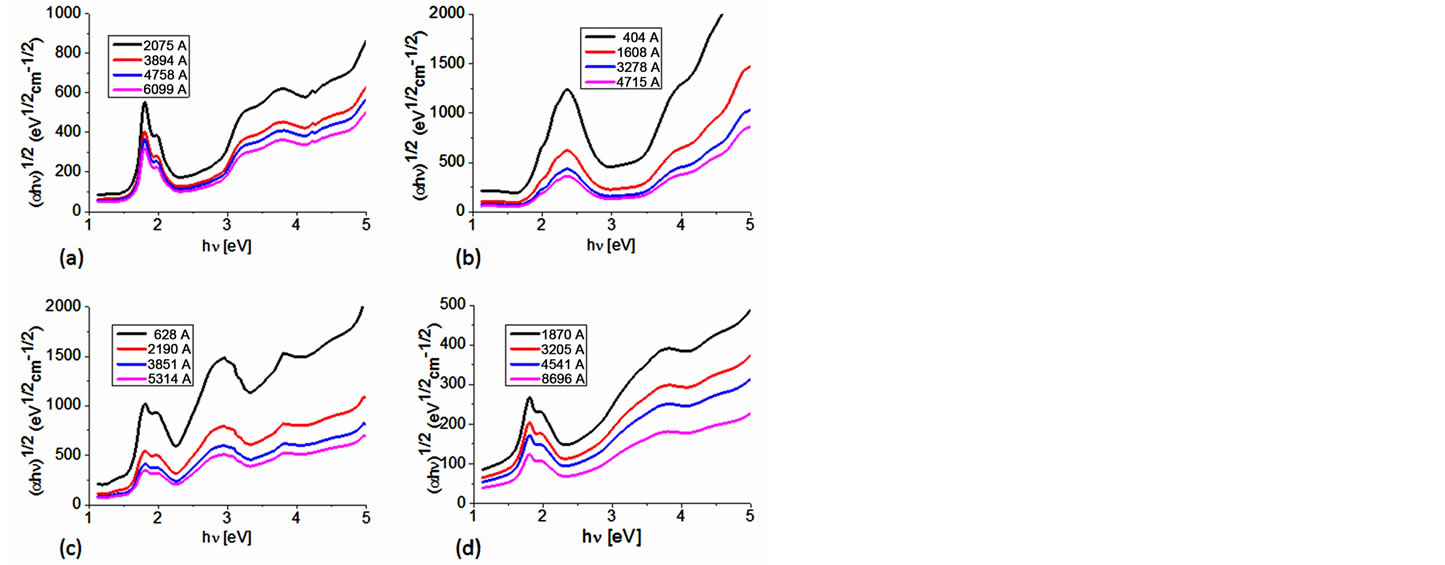
Figure 5. Plot of (αhν)1/2 vs. photon energy hν of (a) BDALiPc; (b) AqDALiPc; (c) BDANaPc and (d) AqDANaPc thin films.
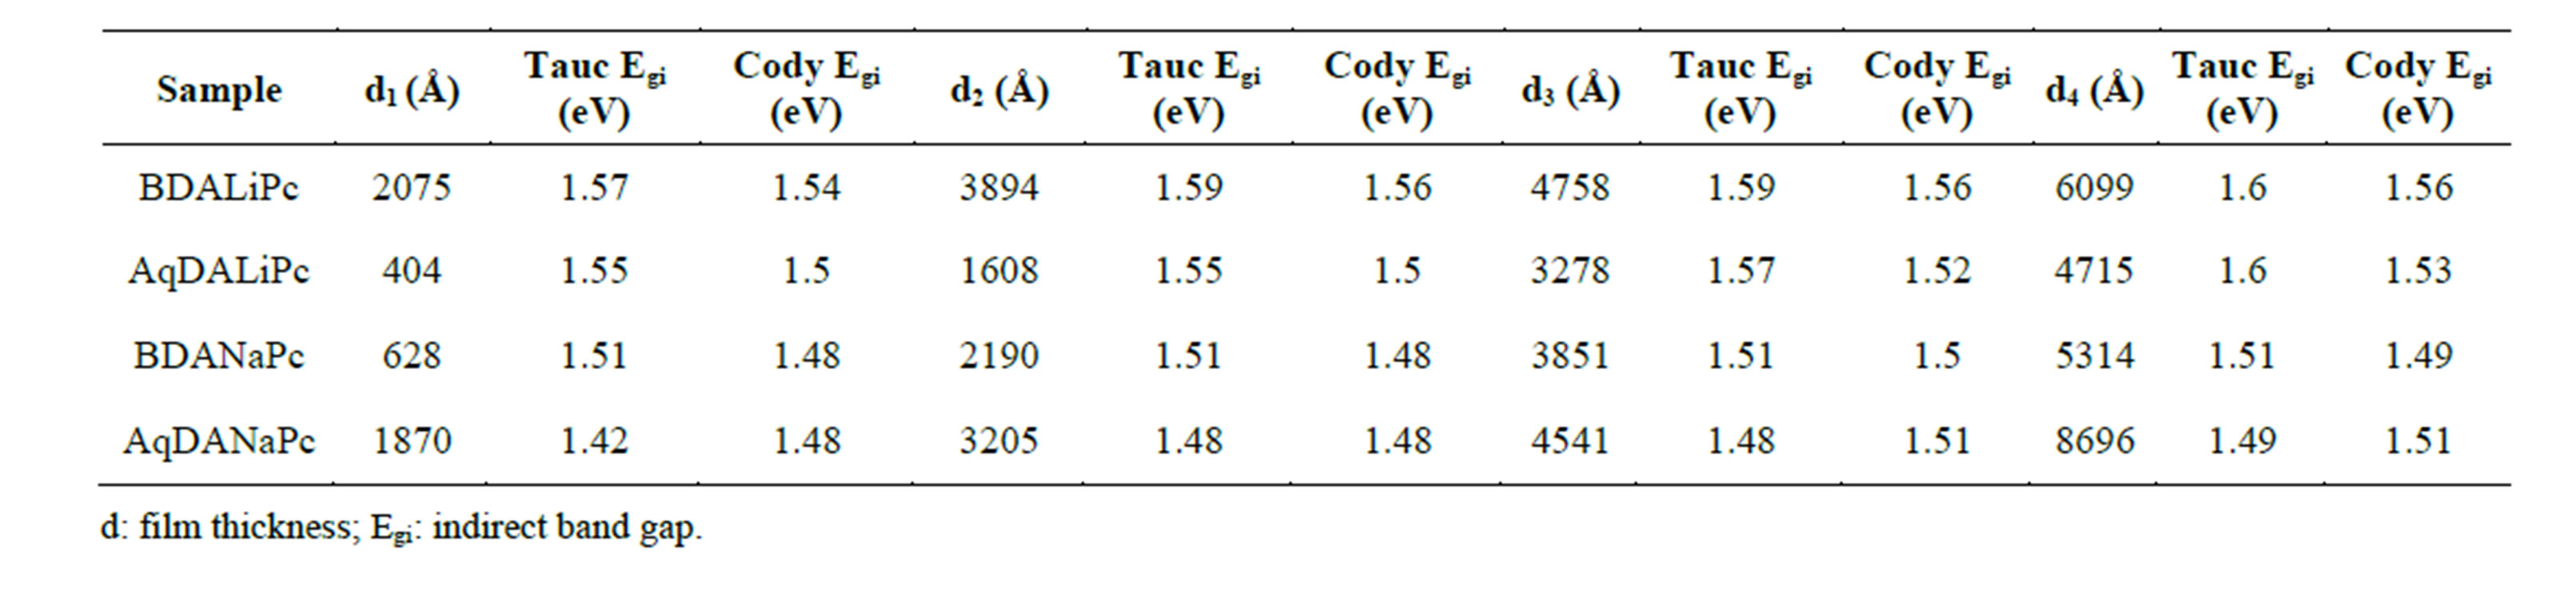
Table 3. Comparison of tauc and cody optical gaps for different thicknesses.
The Cody model hypothesizes that this behavior occurs because of a fundamental curvature in the spectral dependence of (αhυ)½ = f(hν), which is held responsible for the increases in the Tauc optical gap with decreasing film thickness [26,27,36]. In accordance to this model, as given by Cody et al, the optical gap associated with BDAMPc and AqDAMPc thin films should rather be determined by extrapolating the linear trend observed in the spectral dependence of (α/hν)1/2, over a limited range of photon energies. The abscissa-axis intersection of this linear extrapolation corresponds to the Cody optical gap (Figure 6) at the thickness of the film. Cody plots exhibit a much milder curvature than their Tauc counterparts and a much reduced dependence of the gap on film thickness than is the case with the Tauc optical gap [26,27]. Table 3 shows the optical gap determinations from the Cody model. Even though some differences in terms of the activation energy may be noticed in the graphs, similar values may be observed by comparing the results arising from the Tauc and the Cody models. If the measurement error range is taken into account, it may be concluded that these differences are really not important, so any of the two models may be used for calculating the activation energy of BDAMPc and AqDAMPc semiconductors.
If one considers that the optical activation energy values for semiconductors are typically found in the region between 1 and 3 eV, it can be inferred that the reported thin films show a rather semiconductor-like behavior, as their onset band gaps are barely above 1.5 - 1.6 eV (Table 3). Comparing the materials in this family, it is observed that BDANaPc and AqDANaPc have the smallest band gap of the four materials, followed by BDALiPc and finally AqDALiPc. This is the expected behavior if one takes into account the hierarchy of factors most likely to affect the size of the band gap. The thin film with sodium has the smallest band gap: it seems that the larger size of the sodium atom favors a larger electronic transport and is
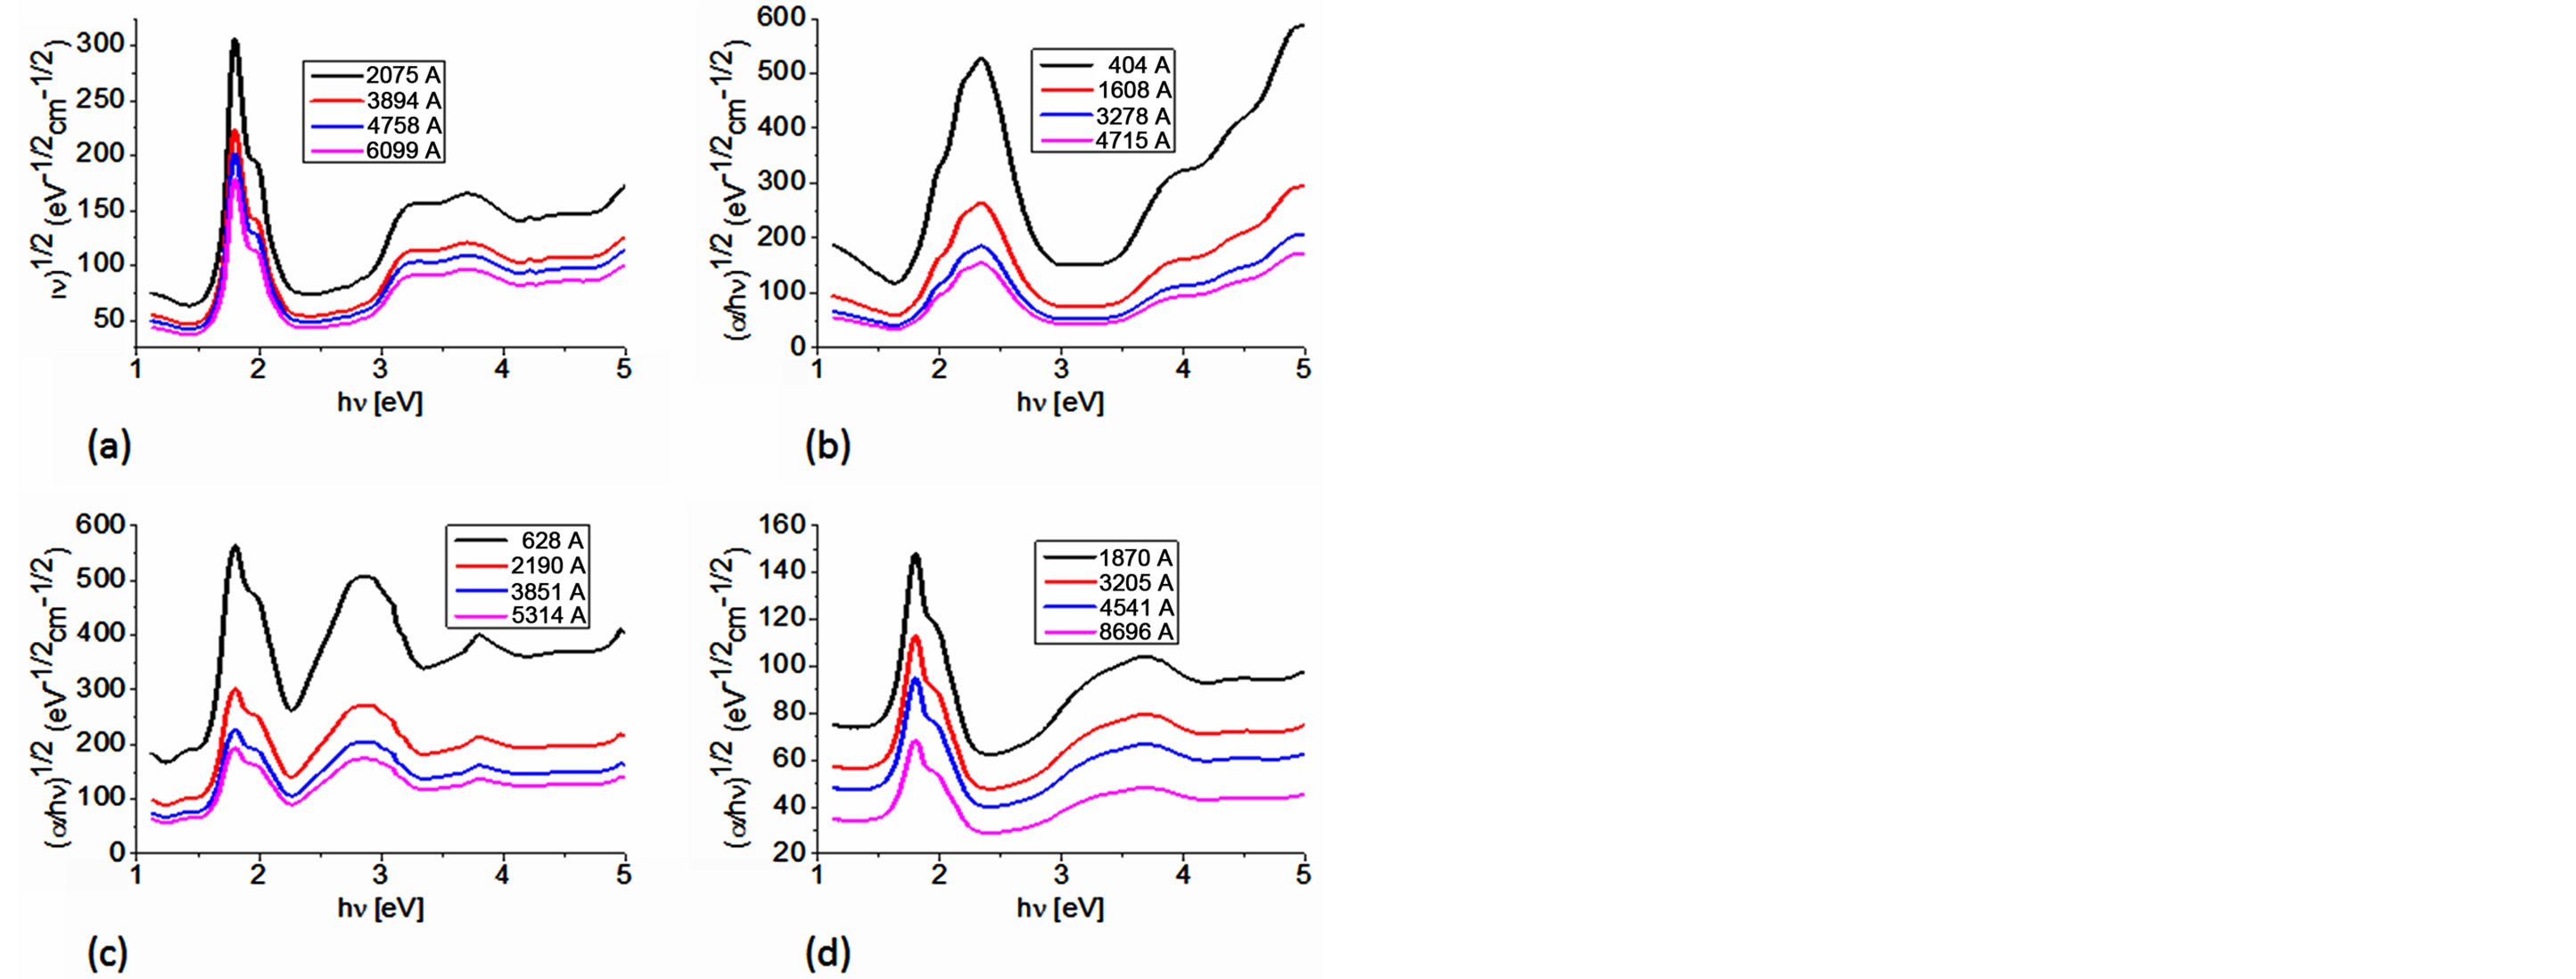
Figure 6. Plot of (α/hν)1/2 vs. photon energy hν of (a) BDALiPc; (b) AqDALiPc; (c) BDANaPc and (d) AqDANaPc thin films.
the main influence with respect to the bidentate amine. The optical band gap decreases when the number of electrons for the monovalent cation (Li+ and Na+) increases. This suggests that the larger-sized sodium atom produces a larger distortion in the macrocycle and increases electronic transport between the phthalocyanine and the ligand.
Table 2 shows the estimated values of the linear refractive index n for the obtained thin films. Semiconductors’ refractive indices and absorption coefficients are relevant when considering the design and analysis of optoelectronic devices [21,36,37]. The energy gap can be related to a maximum in the refractive index because the extinction coefficient at the corresponding photon energy is quite small [2-4,7]. Thus, the optical band-gap values may be attributed to indirect electronic interband transitions. The largest n-values are obtained for BDALiPc, in agreement with the highest values of the optical gap measured for these compounds. The spectral dependence of the refractive index, n(hν), plays an important role in influencing the determination of the Cody optical gap [2-4, 14,15]. It is thus clear that care must be exercised when drawing conclusions from the dependence of the Tauc and Cody optical gaps associated with BDAMPc and AqDAMPc (M = Li, Na) on the thickness of the film.
4. Conclusion
Thin films of BDAMPc and AqDAMPc (M = Li, Na) can be deposited by vacuum thermal evaporation on quartz and (100) single-crystalline silicon (c-Si) wafers. Although the deposited material is amorphous in nature, it is formed by the same chemical units as the material coming from the synthesized powder. The vacuum thermal evaporation process does not change the intra-molecular bonds, suggesting that the deposition process can be considered as a molecular process. The absorption spectra thus obtained show that the π – π* transition appears in the 363 - 383 nm region for the Soret-band and within the 559 - 684 nm region for the Q-band. The optical absorption spectrum was used to parameterize the photon energy dependence of the refractive index and extinction coefficient. The Tauc and Cody models were used to obtain the band gap; any of the two models may be used to calculate the activation energy of BDAMPc and AqDAMPc semiconductors. Electron transport in these materials is strongly influenced by the metal in the phthalocyanine. On the basis of the optical band-gap values and the feasibility of preparing these compounds as thin films, it is suggested that these materials may have a potential use in electronic device fabrication.
Acknowledgements
The authors wish to thank the technical assistance of M. Rivera (IF-UNAM). One of the authors (M.E. SánchezVergara) gratefully acknowledges the financial support of the SEP-CONACYT-México, under project number 153751.
REFERENCES
- M. M. El-Nahass, K. F. Abd-El-Rahman and A. A. A. Darwish, “Fourier-Transform Infrared and UV-Vis Spectroscopes of Nickel Phthalocyanine Thin Films,” Materials Chemistry and Physics, Vol. 92, No. 1, 2005, pp. 185-189. http://dx.doi.org/10.1016/j.matchemphys.2005.01.008
- T. S. Shafai and T. D. Anthopoulos, “Junction Properties of Nickel Phthalocyanine Thin Film Devices Utilizing Indium Injecting Electrodes,” Thin Solid Films, Vol. 398-399, 2001, pp. 361-367. http://dx.doi.org/10.1016/S0040-6090(01)01345-1
- S. Robinet, C. Clarisse, M. Gauneau and M. Salvi, “Spectroscopic and Structural Studies of Scandium Diphthalocyanine Films,” Thin Solid Films, Vol. 182, No. 1-2, 1989, pp. 307-317. http://dx.doi.org/10.1016/0040-6090(89)90267-8
- S. Gravano, A. K. Hassan and R. D. Gould, “Effects of Annealing on the Trap Distribution of Cobalt Phthalocyanine Thin Films,” International Journal of Electronics, Vol. 70, No. 3 1991, pp. 477-484.
- S. J. Kim, M. Matsumoto and K. Shigehara, “Synthesis and Electrical Properties of One-Dimensional Octacyanometallophthalocyanine (M≡Fe, Co),” Journal of Porphyrins and Phthalocyanines, Vol. 4, No. 1, 2000, pp. 136-144. http://dx.doi.org/10.1002/(SICI)1099-1409(200001/02)4:1<136::AID-JPP213>3.0.CO;2-J
- R. Seoudi, G. S. El-Bahy and Z. A. El Sayed, “FTIR, TGA and DC Electrical Conductivity Studies of Phthalocyanine and Its Complexes,” Journal of Molecular Structure, Vol. 753, No. 1-3, 2005, pp. 119-126. http://dx.doi.org/10.1016/j.molstruc.2005.06.003
- M. M. El-Nahass, A. M. Farag, Abd-El-Rahman and A. A. A. Darwish, “Dispersion Studies and Electronic Transitions in Nickel Phthalocyanine Thin Films,” Optics & Laser Technology, Vol. 37, No. 7, 2005, pp. 513-523. http://dx.doi.org/10.1016/j.optlastec.2004.08.016
- T. Del Caño, V. Parra, M. L. Rodriguez-Méndez, R. F. Aroca and J. A. De Saja, “Characterization of Evaporated Trivalent and Tetravalent Phthalocyanines Thin Films: Different Degree of Organization,” Applied Surface Science, Vol. 246, No. 4, 2005, pp. 327-333. http://dx.doi.org/10.1016/j.apsusc.2004.11.036
- G. A. Kumar, G. J. Vinoy Thomas, N. V. Unnikrishnan and V. P. N. Nampoori, “NIR to UV Absorption Spectra and the Optical Constants of Phthalocyanines in Glassy Medium,” Spectrochimica Acta Part A, Vol. 59, No. 1, 2003, pp. 1-11. http://dx.doi.org/10.1016/S1386-1425(02)00037-9
- K. Tokumaru, “Photochemical and Photophysical Behavior of Porphyrins and Phthalocyanines Irradiated with Violet or Ultraviolet Light,” Journal of Porphyrins and Phthalocyanines, Vol. 5, No. 1, 2001, pp. 57-86. http://dx.doi.org/10.1002/1099-1409(200101)5:1<77::AID-JPP302>3.0.CO;2-X
- Z. T. Liu, H. S. Kwok and A. B. Djurišic, “The Optical Functions of Metal Phthalocyanines,” Journal of Physics D: Applied Physics, Vol. 37, No. 5, 2004, pp. 678-688. http://dx.doi.org/10.1088/0022-3727/37/5/006
- M. E. Ragoussi, J. J. Cid, J. H. Yum, G. De la Torre, D. Di Censo, M. Grätzel, M. K. Nazeeruddin and T. Torres, “Carboxyethynyl Anchoring Ligands: A Means to Improving the Efficiency of Phthalocyanine-Sensitized Solar Cells,” Angewandte Chemie International Edition, Vol. 51, No. 18, 2012, pp. 4375-4378.
- T. D. Anthopoulos and T. S. Shafai, “SCLC Measurements in Nickel Phthalocyanine Thin Films,” physica Status Solidi (a), Vol. 181, No. 2, 2000, pp. 569-574. http://dx.doi.org/10.1002/1521-396X(200010)181:2<569::AID-PSSA569>3.0.CO;2-Y
- L. Ottaviano, S. Di Nardo, L. Lozzi, M. Passacantando, P. Picozzi and S. Santucci, “Thin and Ultra-Thin Films of Nickel Phthalocyanine Grown on Highly Oriented Pyrolitic Graphite: An XPS, UHV-AFM and Air TappingMode AFM Study,” Surface Science Vol. 373, No. 2-3, 1997, pp. 318-332. http://dx.doi.org/10.1016/S0039-6028(96)01179-X
- N. Kobayashi, T. Fukuda, K. Ueno and H. Ogino, “Extremely Non-Planar Phthalocyanines with Saddle or Helical Conformation: Synthesis and Structural Characterization,” Journal of the American Chemical Society, Vol. 123, No. 43, 2001, pp. 10740-10741. http://dx.doi.org/10.1021/ja0113753
- X. Liu, L. C. Xu, T. J. He, D. M. Chen and F. C. Liu, “Density Functional Theory Investigations of Geometries and Electronic Spectra of Lithium Phthalocyanines,” Chemical Physics Letters, Vol. 379, No. 5-6, 2003, pp. 517-525. http://dx.doi.org/10.1016/j.cplett.2003.08.065
- T. Kimura, M. Sumimoto, S. Sakaki, H. Fujimoto, Y. Hashimoto and S. Matsuzaki, “Electronic Structure of Lithium Phthalocyanine Studied by Ultraviolet Photoemission Spectroscopy,” Chemical Physics, Vol. 253, No. 1, 2000, pp. 125-131. http://dx.doi.org/10.1016/S0301-0104(99)00381-X
- M. M. Hart, “Cationic Exchange Reactions Involving Dilithium Phthalocyanine,” Thesis for the degree of Master of Science. Wright State University, Dayton, 2009.
- B. P. Rand, D. Cheyns, K. Vasseur, N. C. Giebink, S. Mothy, Y. Yi, V. Coropceanu, D. Beljonne, J. Cornil, J. L. Brédas and J. Genoe, “The Impact of Molecular Orientation on the Photovoltaic Properties of a Phthalocyanine/ Fullerene Heterojunction,” Advanced Functional Materials, Vol. 22, No., 2012, pp. 2987-2995. http://dx.doi.org/10.1002/adfm.201200512
- M. M. El-Nahass, M. M. Sallam and H. A. Ali, “Optical Properties of Thermally Evaporated Metal-Free Phthalocyanine (H2Pc) Thin Films,” International Journal of Modern Physics B, Vol. 19, No. 27, 2005, pp. 4057-4071.
- M. M. El-Nahass, K. F. Abd-El-Rahman, A. A. AlGhamdi and A. M. Asiri, “Optical Properties of Thermally Evaporated Tin-Phthalocyanine Dichloride Thin Films, SnPcCl2,” Physica B: Condensed Matter, Vol. 334, No. 1-4, 2004, pp. 398-406. http://dx.doi.org/10.1016/j.physb.2003.10.019
- M. M. El-Nahass, K. F. Abd-El-Rahman and A. A. A. Darwish, “Fourier-Transform Infrared and UV-vis Spectroscopes of Nickel Phthalocyanine Thin Films,” Materials Chemistry and Physics Vol. 92, No. 1, 2005, pp. 185-189. http://dx.doi.org/10.1016/j.matchemphys.2005.01.008
- K. R. Rajesh and C. S. Menon, “D. C. Electrical and Optical Properties of Vacuum-Deposited Organic Semiconductor FePcCl Thin Films,” Canadian Journal of Physics, Vol. 83, No. 11, 2005, pp. 1151-1159. http://dx.doi.org/10.1139/p05-065
- R. Seoudi, G. S. El-Bahy and Z. A. El Sayed, “Ultraviolet and Visible Spectroscopic Studies of Phthalocyanine and Its Complexes Thin Films,” Optical Materials, Vol. 29, No. 2-3, 2006, pp. 304-312. http://dx.doi.org/10.1016/j.optmat.2005.10.002
- X. Li, H. Zhu, J. Wei, K. Wang, E. Xu, Z. Li and D. Wu, “Determination of Band Gaps of Self-Assembled Carbon Nanotube Films Using Tauc/Davis-Mott Model,” Applied Physics A, Vol. 97, No. 2, 2009, pp. 341-344. http://dx.doi.org/10.1007/s00339-009-5330-z
- S. K. O’Leary and P. K. Lim, “On Determining the Optical Gap Associated with an Amorphous Semiconductor: A Generalization of the Tauc Model,” Solid State Communications, Vol. 104, No.1, 1997, pp. 17-21.
- T. M. Mok and S. K. O’Leary, “The Dependence of the Tauc and Cody Optical Gaps Associated with Hydrogenated Amorphous Silicon on the Film Thickness: αl Experimental Limitations and the Impact of Curvature in the Tauc and Cody Plots,” Journal of Applied Physics, Vol. 102, No., 2007, pp. 113525. http://dx.doi.org/10.1063/1.2817822
- M. E. Sánchez-Vergara, J. C. Alonso-Huitrón, A. Rodriguez-Gomez and J. N. Reider-Burstin, “Determination of the Optical GAP in Thin Films of Amorphous Dilithium Phthalocyanine Using the Tauc and Cody Models,” Molecules, Vol. 17, No. 9, 2012, pp. 10000-10013. http://dx.doi.org/10.3390/molecules170910000
- S. Nlate, E. Herdtweck, J. Blümel and R. A. Fischer, “Coordination of Alane and Aluminum Alkyls to the N-Donor Atom of Side Chain Functionalized Cyclopentadienyl Iron and Nickel Complexes; Structure of {[(C5H5)(C5H4CH2NMe2)]Fe}2AlH3,” Journal of Organometallic Chemistry, Vol. 545-546, 1997, pp. 543-548. http://dx.doi.org/10.1016/S0022-328X(97)00359-8
- R. A. Fischer and T. Priermeier, “Transition-Metal-Substituted Alanes: Synthesis and Spectroscopic Studies and the Structure of (eta5-C5H5)(CO)2Fe-Al[(CH2)3NMe2](iBu), Organometallics, Vol. 13, No. 11, 1994, pp. 4306-4314.
- O. G. Morales-Saavedra, M. E. Sánchez-Vergara, A. A. Rodríguez-Rosales, R. Ortega-Martínez, A. Ortiz-Rebollo, B. A. Frontana-Uribe and V. García-Montalvo, “Synthesis and Electrical, Spectroscopic and Nonlinear Optical Properties of Cobalt Molecular Materials Obtained from PcCo(CN)L (L = Ethylenediamine, 1,4-Diaminebutane, 1,12-Diaminododecane and 2,6-Diamineanthraquinone),” Materials Chemistry and Physics, Vol. 123, No. 2-3, 2010, pp. 776-785. http://dx.doi.org/10.1016/j.matchemphys.2010.05.059
- N. Laidani, R. Bartali, G. Gottardi, M. Anderle and P. Cheyssac, “Optical Absorption Parameters of Amorphous Carbon Films from Forouhi-Bloomer and Tauc-Lorentz Models: A Comparative Study,” Journal of Physics: Condensed Matter, Vol. 20, 2008, Article ID: 015216. http://dx.doi.org/10.1088/0953-8984/20/01/015216
- L. Leontie, M. Roman, F. Brinza, C. Podaru and G. I. Rusu, “Electrical and Optical properties of some new synthesized ylides in thin films,” Synthetic Metals, Vol. 138, No. 1-2, 2003, pp. 157-163. http://dx.doi.org/10.1016/S0379-6779(02)01277-8
- E. Carbia-Ruelas, M. E. Sánchez-Vergara, V. GarcíaMontalvo and O. G. Morales-Saavedra, “Electrical and Optical Properties of Thermally-Evaporated Thin Films from A2[TiO(C2O4)2] (A = K, PPh4) and 1,8-Dihydroxyanthraquinone,” Applied Surface Science, Vol. 257, No. 8, 2011, pp. 3313-3319. http://dx.doi.org/10.1016/j.apsusc.2010.11.011
- M. E. Azim-Araghi and A. Krier, “Optical Characterization of Chloroaluminium Phthalocyanine (ClAlPc) Thin Films,” Journal of Optics A: Pure and Applied Optics, Vol. 6, 1997, pp. 443-453. http://dx.doi.org/10.1088/0963-9659/6/4/007
- G. D. Cody, “Hydrogenated Amorphous Silicon, Part B, Optical Properties, Semiconductors and Semimetals,” Academic Press, Orlando, 1984.
- A. Thakur, G. Singh, G. S. S. Saini, N. Goyal and S. K. Tripathi, “Optical Properties of Amorphous Ge20Se80 and Ag6(Ge0.20Se0.80)94 Thin Films,” Optical Materials, Vol. 30, No. 4, 2007, pp. 565-570. http://dx.doi.org/10.1016/j.optmat.2006.12.013
NOTES
*Corresponding author.