Advances in Materials Physics and Chemistry
Vol.3 No.4(2013), Article ID:36088,3 pages DOI:10.4236/ampc.2013.34032
Synthesis of Yb3+ Doped TiO2 Nano Particles Powder as IR Filter via Sol-Gel
1College of Science, Baghdad University, Baghdad, Iraq
2College of Science for Woman, Baghdad University, Baghdad, Iraq
Email: moh4691@gmail.com, asmaashawky67@yahoo.com, hanaaalheety@yahoo.com
Copyright © 2013 Mohammed A. Hamza et al. This is an open access article distributed under the Creative Commons Attribution License, which permits unrestricted use, distribution, and reproduction in any medium, provided the original work is properly cited.
Received June 16, 2013; revised July 21, 2013; accepted August 1, 2013
Keywords: Sol-Gel; Nano Technology; TiO2; MID IR Optical Filter
ABSTRACT
Ytterbium doped TiO2 nano-particles were prepared via Sol-Gel Technique under varying conditions to investigate the effects of Ytterbium ion doping on the Titania optical properties in MID IR range. X-ray diffraction analyses show that prepared Yb3+ doped TiO2 samples have polycrystalline structure in Anatas phase. FTIR spectrums for pure and doped samples after annealing process show a single transmission peak at wave number around 1145 cm−1. Transmission rate of this peak depends on Yb3+ concentrations and its value rises from 1.82% (for pure TiO2) to 58.1% (for doped with 1.13 wt% Yb3+). Slightly peak shift occurs at a lower doping rate with no further response to higher concentration rate. FTIR spectra gives a good indication in direction of preparation of optical band-pass filter at a wavelength around 8.733 µm (~1145 cm−1).
1. Introduction
Titanium dioxide as a semiconductor photocatalyst has attracted a great deal of attention due to its scientific and technological importance. Nano-particles TiO2 has promising applications in many fields such as photocatalyst for environmental purification, solar energy conversion, sensors, self-cleaning, super-hydrophilic smart material and so on [1-2].
One of the most important aspects of TiO2 is its photocatalytic activity of degrading various organic pollutants with its high catalytic efficiency, high chemical stability, non-toxicity and low cost. Despite its promising properties, however, there are several problems that limit the photocatalytic activity of TiO2. For example, due to the large band gap, it can be photo-exited only in the ultraviolet region, which comprises less than 5% of the overall solar energy spectrum. Another problem is the recombination of electrons and holes that generally take place in the large TiO2 particles. It substantially reduces the number of free charges on the surface and lowers the photocatalytic activity. Therefore, several methods have been employed to improve the photocatalytic efficiency of TiO2.
Recently, doping lanthanide into TiO2 attracted much attention [3-7]. Lanthanide ions are known for their ability to form complexes with various Lewis bases (e.g. acids, amines, aldehydes, alcohols, thiols, etc.) due to the interaction of these functional groups with the f-orbital of the lanthanides [6]. Thus, incorporation of lanthanide ions into a TiO2 matrix could provide a way to concentrate the organic pollutant on the semiconductor surface and therefore enhance the photoactivity of Titania [6].
Sol-gel process is one of the most successful techniques for preparing nanocrystalline metallic oxide materials due to low cost, easy of fabrication (flexibility) and low processing temperatures. Generally, in a typical solgel process, a colloidal suspension or a sol is formed due to the hydrolysis and polymerization reactions of the precursors, which on complete polymerization and loss of solvent leads to the transition from the liquid sol into a solid gel phase. The wet gel can be converted into nanocrystals with further drying and hydrothermal treatment [8,9].
2. Experimental
2.1. Samples Preparation
The doped and un-doped titania nanoparticles were synthesized by sol-gel method from Titanium (IV)-isopropoxide (TTIP) (Aldrich 98%), Ethanol (EtOH 99.9%) from GCC, hydrochloric acid (HCl, 34.5%) from BDH and Ytterbium(III) oxide (Aldrich). Deionized water was used for the hydrolysis of (TTIP) and preparation of pure and doped TiO2 Sol. The final solution was left for 30 minutes under magnetic stirring. The reaction was performed at a cooler water jacket (i.e. the solution was cooled by water at temperature (10˚C - 15˚C). The amount of each chemical in this procedure was TTIP:H2O:EtOH: HCl = 1:1:10:0.1 in molar ratio. The gelation of monoliths was achieved by pouring the sol into covered glass tube at room temperature. After aging for 24 hour, first drying occurred for 1 hour at temperature 60˚C. Then samples left in room temperature without covers in order to permit solvent evaporation through the drying process. The doping rate of samples with Yb3+ equal to: 0 wt%, 0.21 wt%, 0.68 wt% and 1.13 wt%.
2.2. Samples Characterization
All samples were calcinated for 2 hour in a box furnace operating at 500˚C in an ambient atmosphere. Structural characterizations of the doped and un-doped TiO2 samples were done by X-ray diffraction (XRD). θ - 2θ scans were recorded using ITAL-STRUCTURE diffractometer equipped. While Mid-IR spectra were obtained for the prepared samples using FT-IR spectrometer, Shimadzu, on KBr pellets of the samples
3. Result and Discussion
The X-ray diffraction spectrums (XRD) were illustrated in Figure 1 for the doped and undoped samples after annealing process, which show that prepared samples have polycrystalline structure in Anatas phase [10-12].
The FTIR spectrums were illustrated in Figures 2 and 3 for the samples before and after annealing process respectively. The peaks at 667 cm−1, 505 cm−1 and 447 cm−1 are attributed to Ti-O bond. The peak at 667 cm−1 refers to symmetric O-Ti-O stretch while peak at 447 cm−1 and 505 cm−1 are due to the vibration of Ti-O bond [13-14]. Another two bands were appeared at about 1600 cm−1 and 3400 cm−1. These two absorption bands are attributed to the characteristics vibration of O-H bond in water molecules [15,16], and indicating that the drying process at 60˚C does not completely trap the wate r molecules from the pores of Titania network. After annealing process at 500˚C the last two absorption bands were disappeared from FTIR spectrums (Figure 3).
The important result that could be seen from the FTIR spectra is the existence of transmission peak centered at around 1145 cm−1. Annealing process at 500˚C improves the transmission rate of this peak. Furthermore, doping with Yb3+ ion makes this peak so much strong and becomes the only major peak could be observed from the FTIR spectrums in range of 4000 cm−1 to 400 cm−1
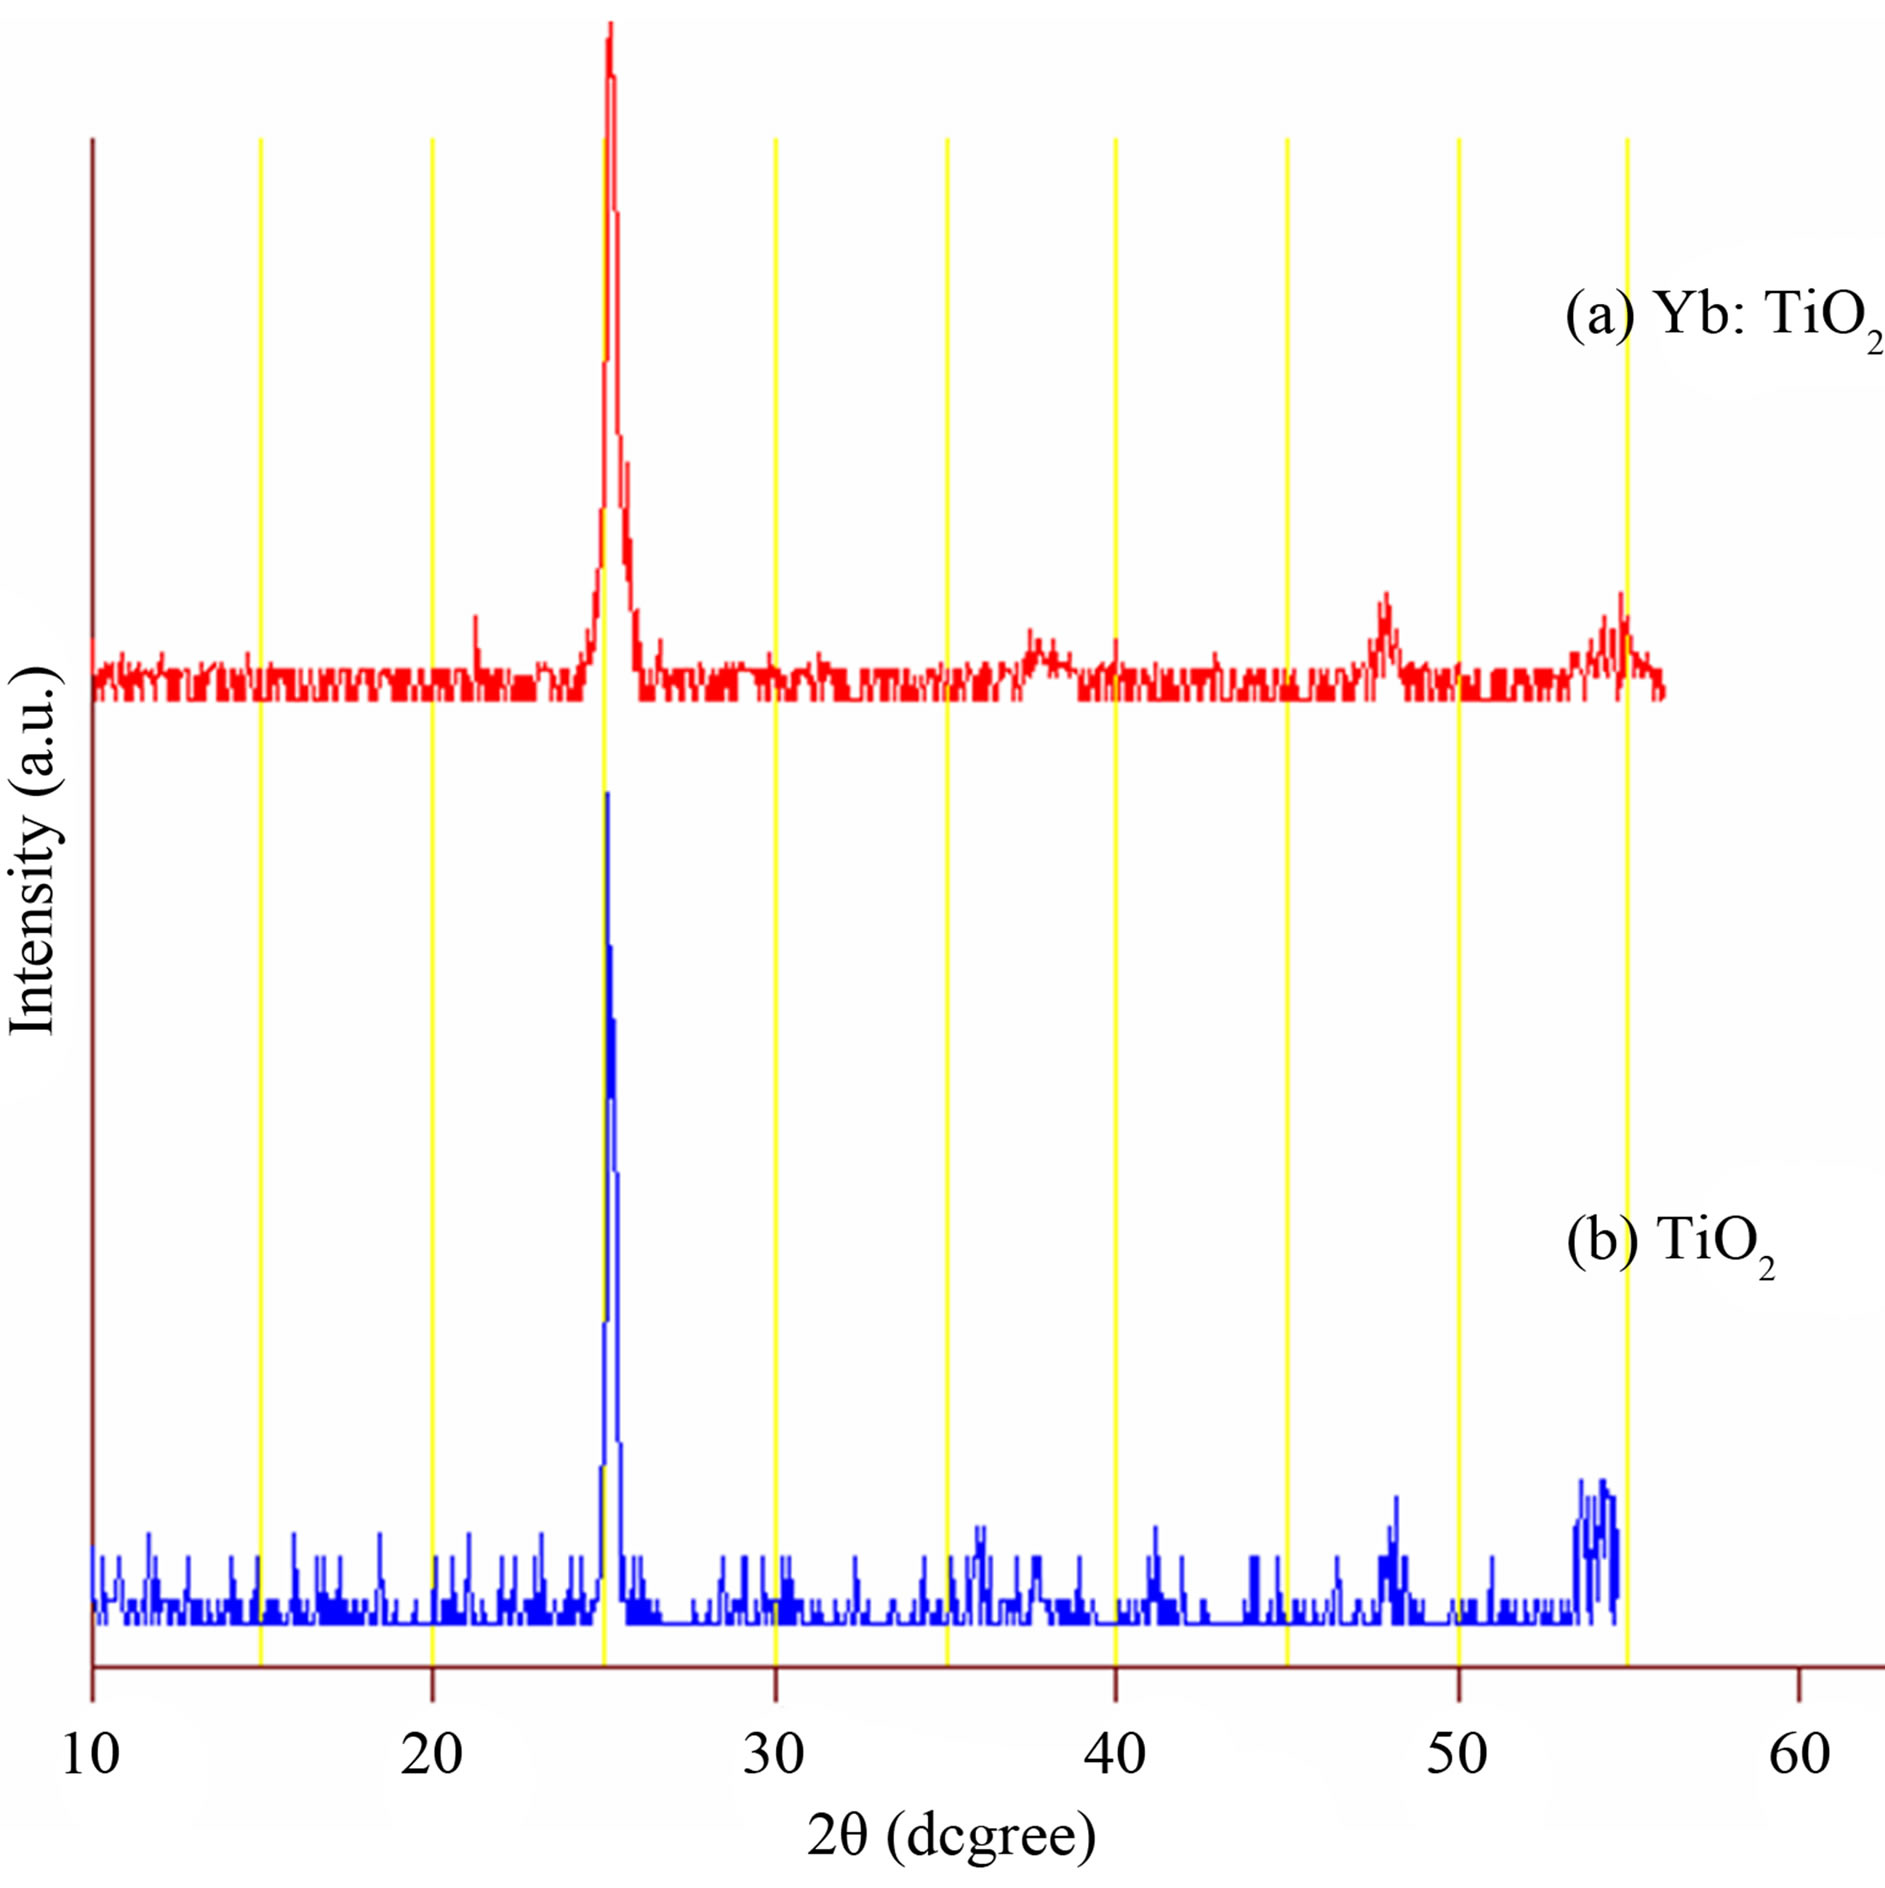
Figure 1. XRD spectrums for samples after annealing process. (a) Yb:TiO2 doped; (b) Pure TiO2.
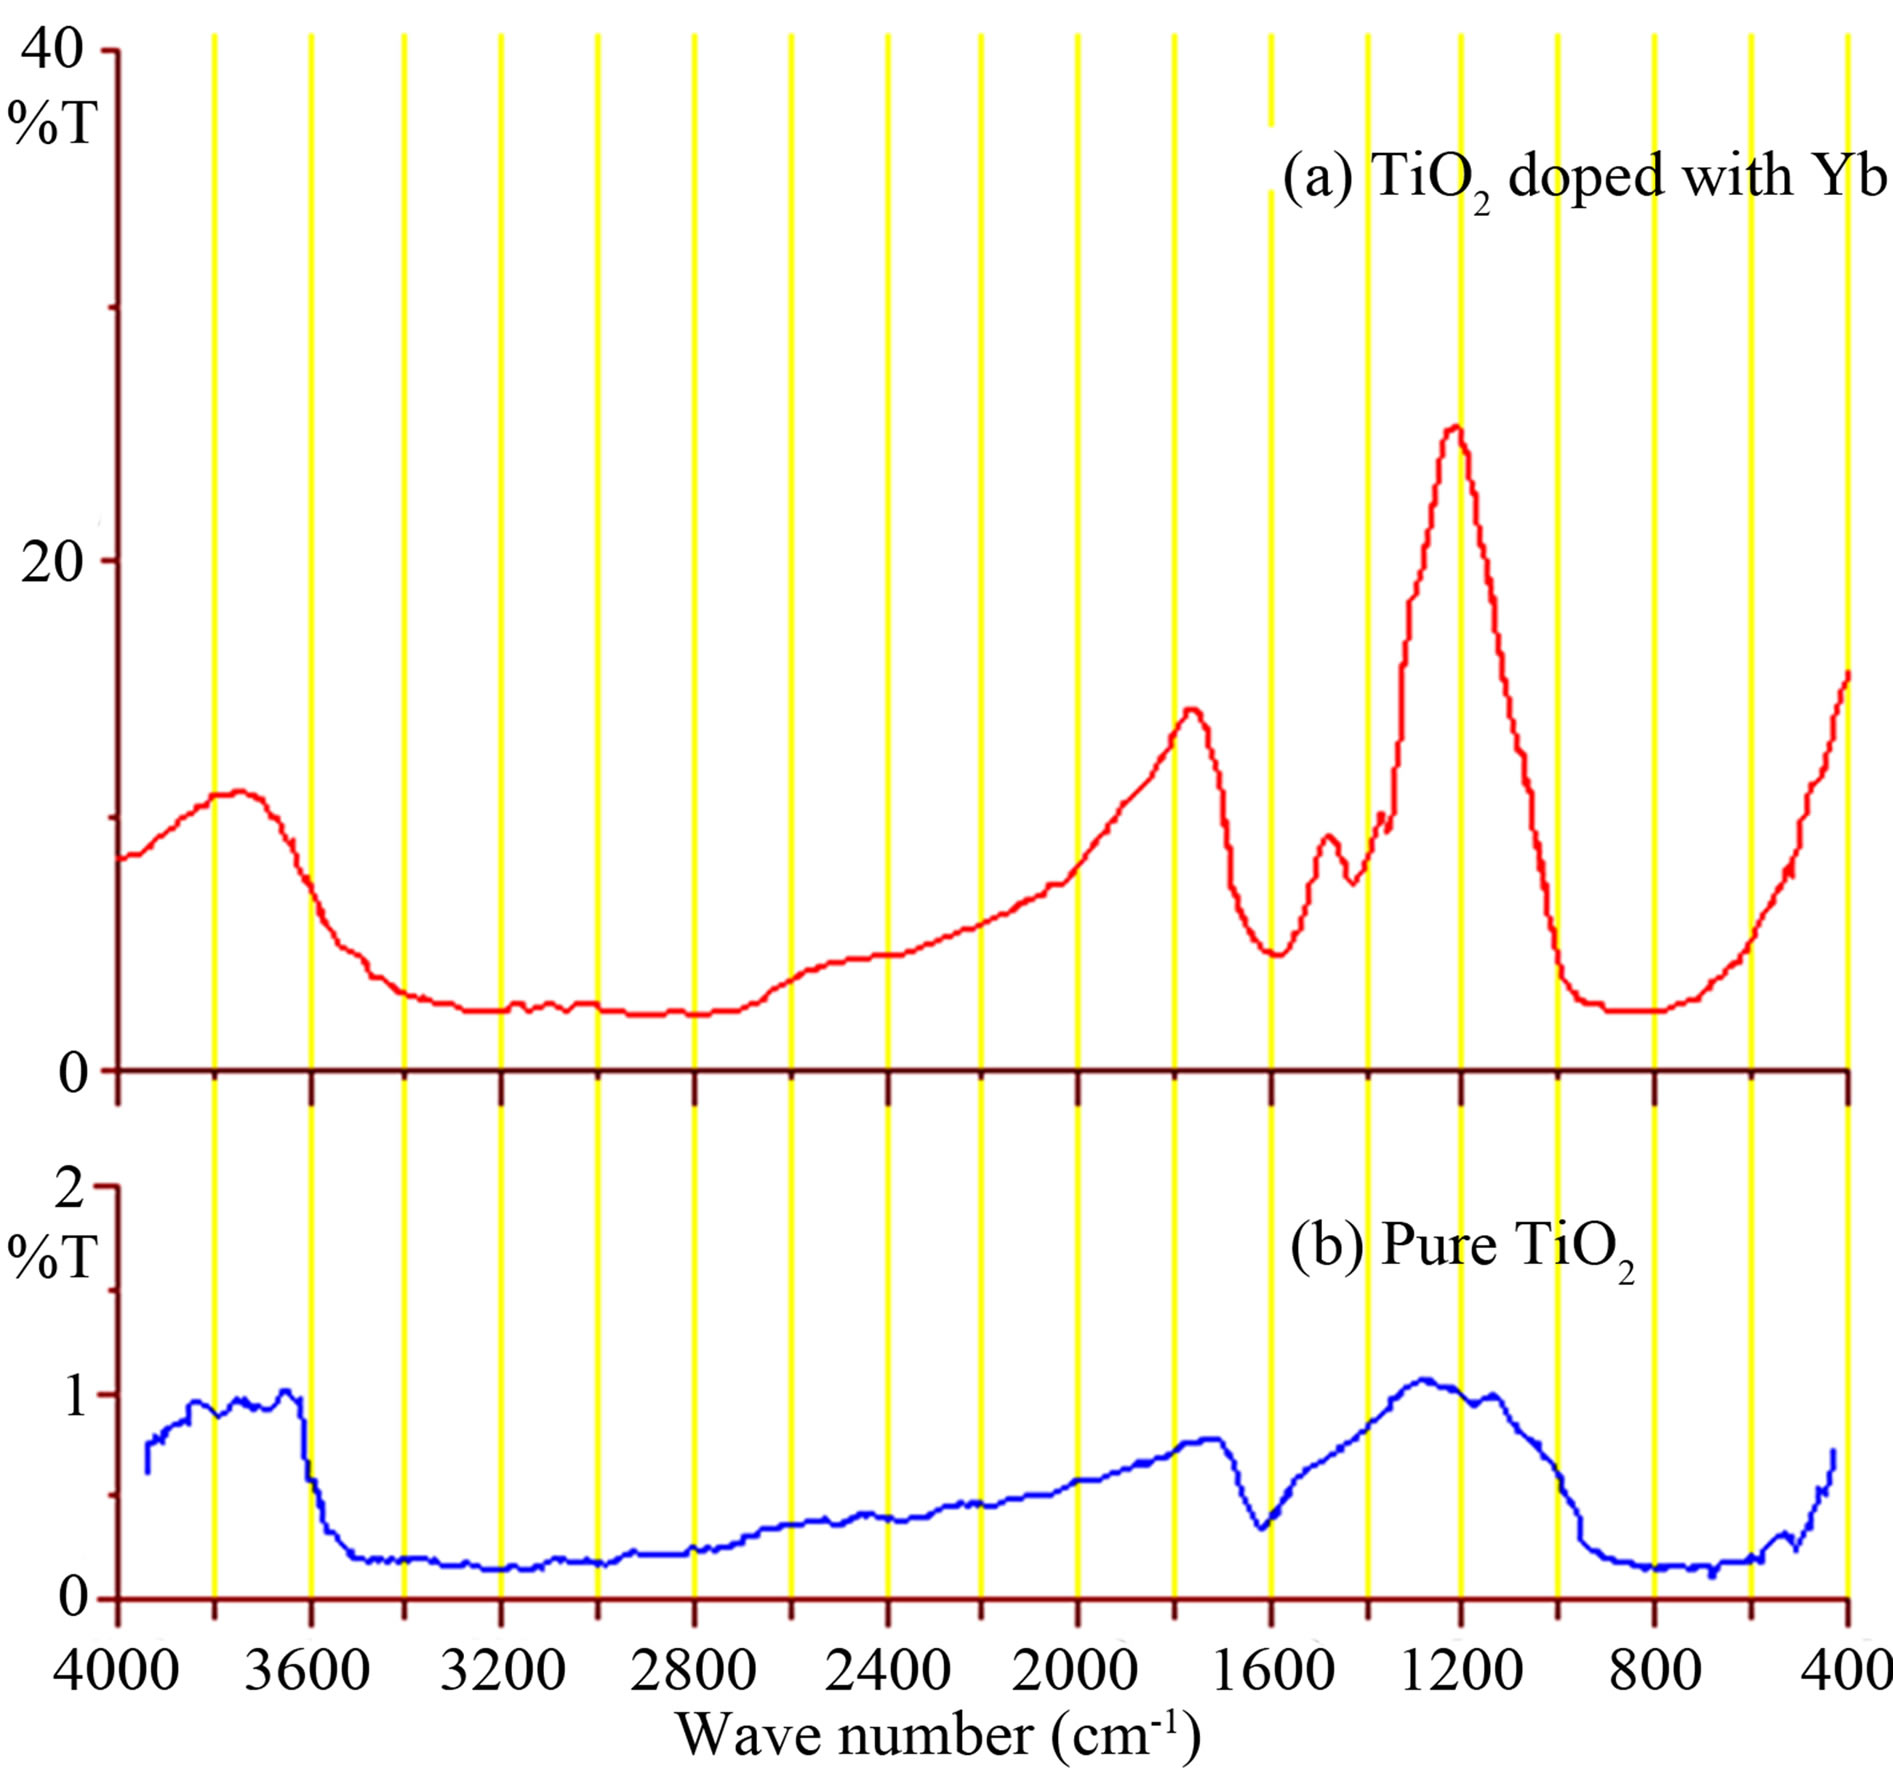
Figure 2. FTIR spectrums for samples before annealing process. (a) TiO2 doped with Yb3+; (b) Pure TiO2.
(Figure 3). This result gives a good indication in direction of production of optical band-pass filter around the wavelength 8.733 µm (~1145 cm−1) [3]. The effect of doping rate on amplitude, FWHM of the band width and maximum peak wavelength is summarized in Table 1.
From Table 1, it can see that the two parameter transmission rate and FWHM are increase with increasing of doping rate. That’s mean the two parameters effected with the amount of doping rate. While the maximum of transmission peak shifted with increasing of doping at the lower doping rate then become stable at higher concentration [3].
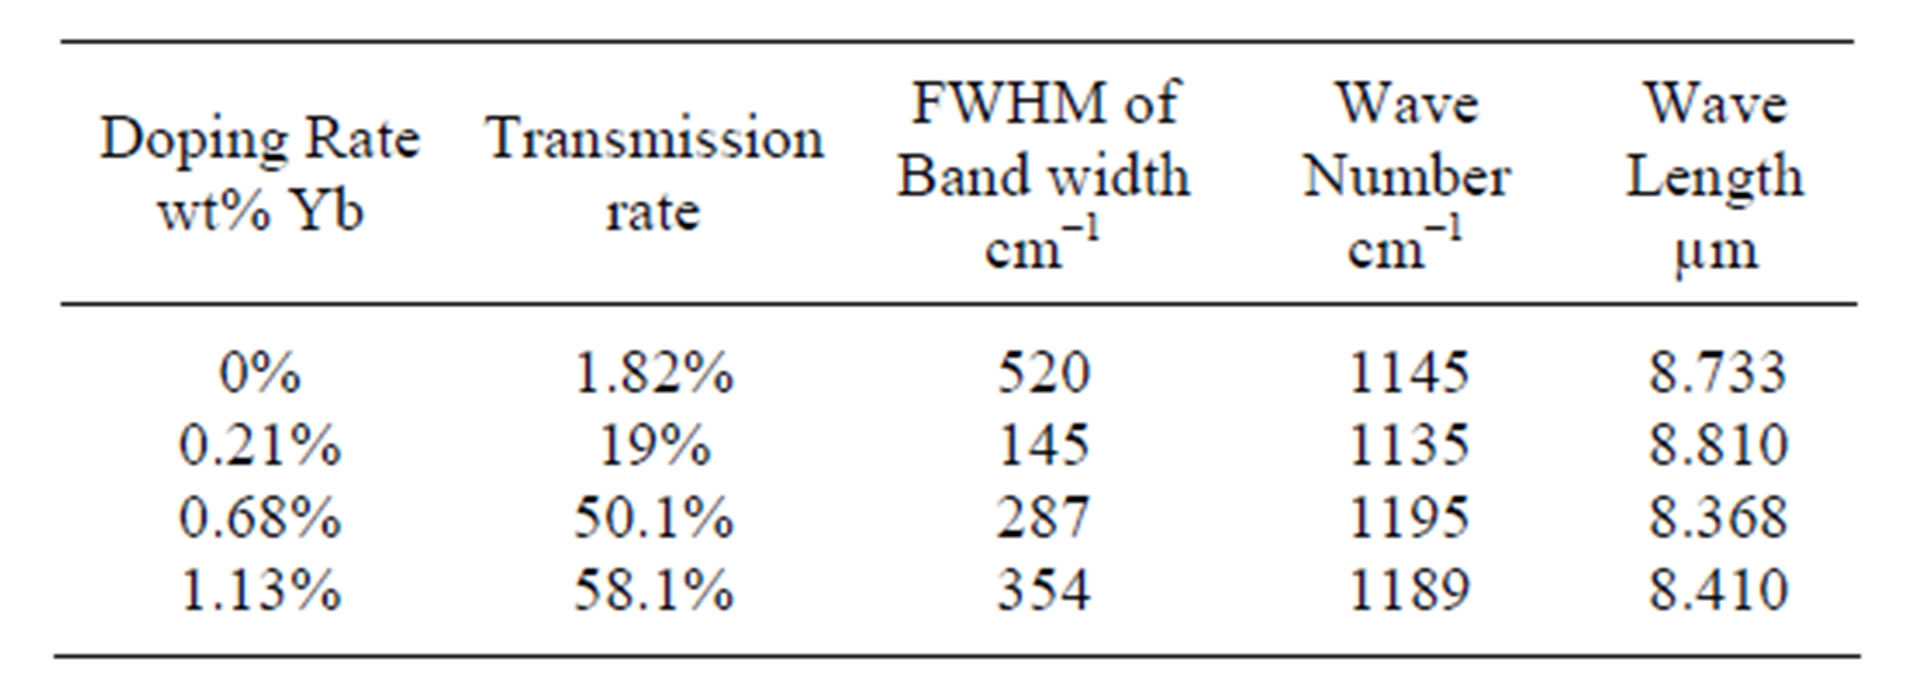
Table 1. Transmission peak parameter for Yb:TiO2 samples after annealing process.
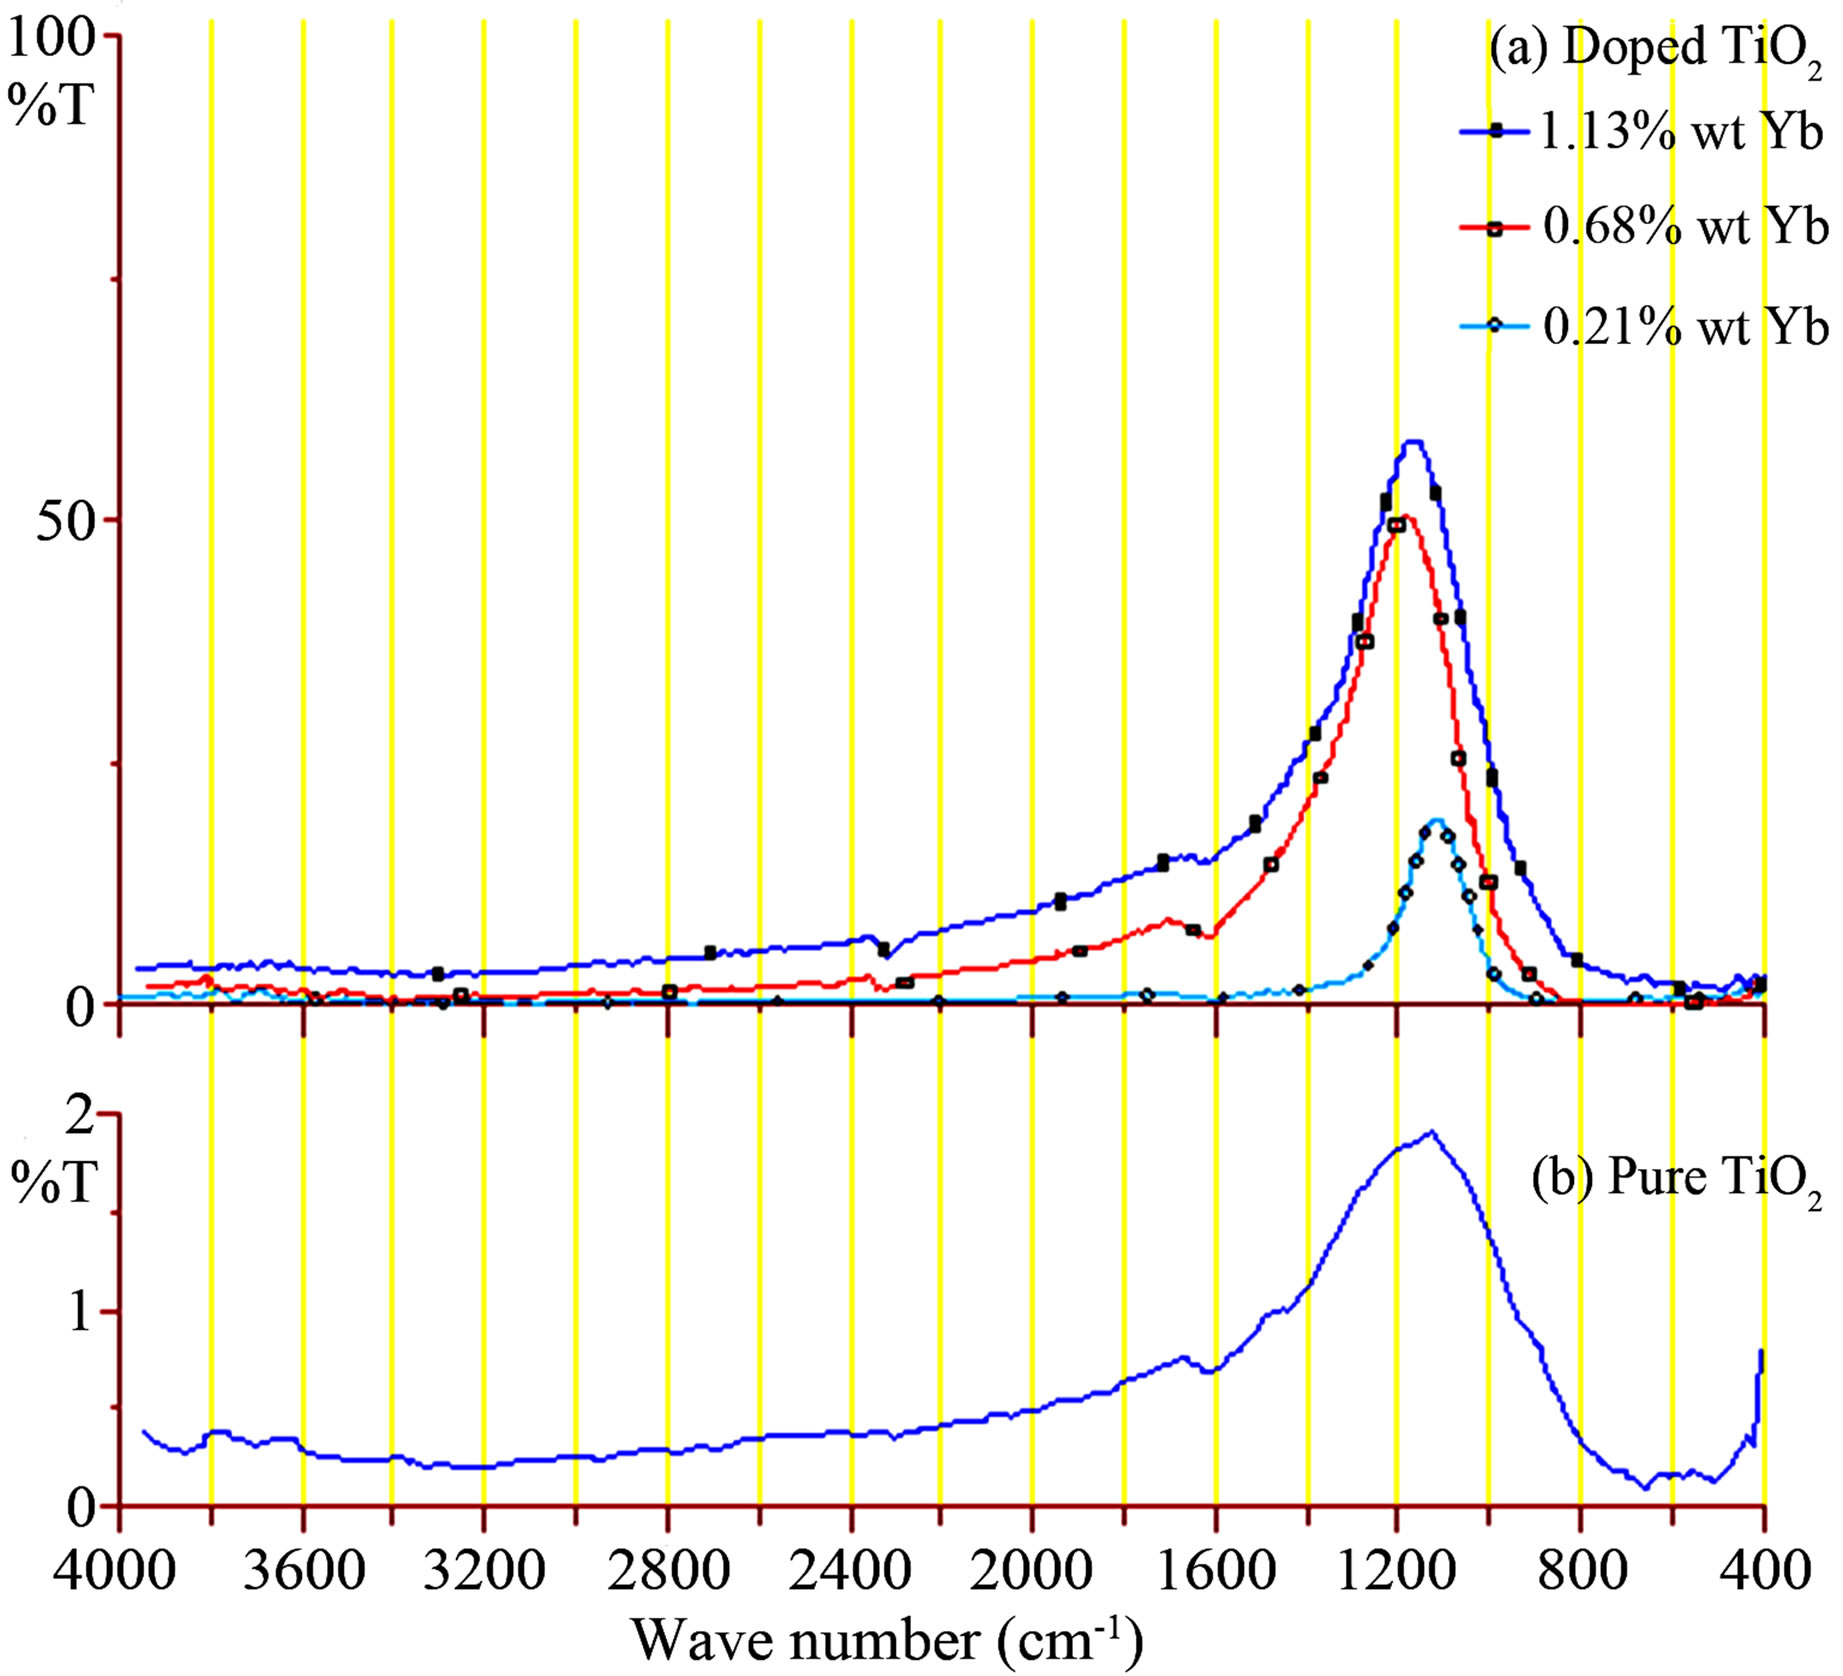
Figure 3. FTIR spectrums for samples after annealing process. (a) Yb:TiO2 with different doped rate; (b) Pure TiO2.
4. Conclusion
Both of annealing process and doping with Yb3+ increase the photocatalytic efficiency of nanoparticles TiO2 through enhancement of the transmission rate at the wave number around the 1145 cm−1. The band width of this transmission peak is increase with increasing of doping rate.
The maximal of the transmission peak shifted with increasing of Yb3+ concentration at the lower doping rate then became stable at higher concentration.
FTIR spectra gives a good indication in direction of preparation of optical band-pass filter at a wavelength around 8.733 µm (~1145 cm−1).
REFERENCES
- K. K. Gupta, M. Jassal and A. K. Agrawal, “Sol-Gel Derived Titanium Dioxide Finishing of Cotton Fabric for Self Cleaning,” Indian Journal of Fibre & Textile Research, Vol. 33, No. 4, 2008, pp. 443-450.
- J. Banfield and A. Navrotsky, “Nanoparticles and the Environment,” Reviews in Mineralogy and Geochemistry, Vol. 44, No. 1, 2001, pp. 1-58.
- M. A. Hamza, F. Saiof, A. Al-ithawi, M. Ameen and H. Yaseen, “Prepared of Nd: TiO2 Nano Particles Powder as IR Filter via Sol-Gel,” Advances in Materials Physics and Chemistry, Vol. 3, No. 2, 2013, pp. 174-177. doi:10.4236/ampc.2013.32024
- S. I. Shah, W. Li, C.-P. Huang, O. Jung and C. Ni, “Study of Nd3+, Pd2+, Pt4+, and Fe3+ Dopant Effect on Photoreactivity of TiO2 Nanoparticles,” PNAS, Vol. 99, Suppl. 2, 2002, pp. 6482-6486. doi:10.1073/pnas.052518299
- W. Li, Y. Wang, H. Lin, S. I. Shah, C. P. Huang, D. J. Doren, S. A. Rykov, J. G. Chen and M. A. Barteau, “Band Gap Tailoring of Nd3-Doped TiO2 Nanoparticles,” Applied Physics Letters, Vol. 83, No. 20, 2003, pp. 4143- 4145. doi:10.1063/1.1627962
- H. S. Kim, Y. B. Li and S. W. Lee, “Nd3+ Doped TiO2 Nano-particles Prepared by Sol-Hydrothermal Process,” Materials Science Forum, Vol. 510-511, 2006, pp. 122-125.
- X. Chen and W. Luo, “Optical Spectroscopy of Rare Earth Ion-Doped TiO2 Nanophosphors,” Journal of Nanoscience and Nanotechnology, Vol. 10, No. 3, 2010, pp. 1482-1494. doi:10.1166/jnn.2010.2034
- J. Livage, M. Henry and C. Sanchez, “Sol-Gel Chemistry of Transition Metal Oxides,” Progress in Solid State Chemistry, Vol. 18, No. 4, 1988, pp. 259-342. doi:10.1016/0079-6786(88)90005-2
- C. J. Brinker and G. W. Scherer, “The Physics and Chemistry of Sol-Gel Processing,” Sol-Gel Science Academic press, Waltham, 1990.
- A. Burns, G. Hayes, W. Li, J. Hirvonen, J. D. Demaree and S. I. Shah, “Neodymium Ion Dopant Effects on the Phase Transformation in Sol-Gel Derived Titania Nanostructures,” Journal Materials Science and Engineering: B, Vol. 111, No. 2-3, 2004, pp. 150-155. doi:10.1016/j.mseb.2004.04.008
- S. Adnan, A. R. Fadhil and A. A. Majida, “TiO2 Nanoparticles Prepared by Sol-Gel,” Journal of Materials Science and Engineering, Vol. 3, No. 12, 2009, pp. 81-84.
- J. Zhang, M. J. Li, Z. C. Feng, J. Chen and C. Li, “UV Raman Spectroscopic Study on TiO2. I. Phase Transformation at the Surface and in the Bulk,” Journal of Physical Chemistry B, Vol. 110, No. 2, 2006, pp. 927-935.
- H. Nur, “Modification of Titanium Surface Species of Titania by Attachment of Silica Nanoparticles,” Journal Materials Science and Engineering: B, Vol. 133, No. 1-3, 2006, pp. 49-54. doi:10.1016/j.mseb.2006.05.003
- A. Merouani and H. Amardjia-Adnani, “Spectroscopic FT-IR Study of TiO2 Films Prepared by Sol-Gel Method,” International Scientific Journal for Alternative Energy and Ecology, Vol. 6, No. 62, 2008, pp. 151-154.
- Y.-G. Kwon, S.-Y. Choi, E.-S. Kang and S.-S. Baek, “Ambient-Dried Silica Aerogel Doped with TiO2 Powder for Thermal Insulation,” Journal of Materials Science, Vol. 35, No. 24, 2000, pp. 6075-6079. doi:10.1023/A:1026775632209
- M. A. Noginov, N. E. Noginova, H. J. Caulfield and P. Venkates-warl, “Line Narrowing in the Dye Solution with Scattering Centers,” Optics Communications, Vol. 118, No. 3-4, 1995, pp. 430-437. doi:10.1016/0030-4018(95)00177-A