Advances in Materials Physics and Chemistry
Vol.3 No.2(2013), Article ID:32645,8 pages DOI:10.4236/ampc.2013.32015
Miscibility Behavior of Poly Ethylene Glycol or Poly Ethylene Succinate/Chlorinated Poly Vinyl Chloride Blends Studied by Dielectric Relaxation Spectroscopy
1Department of Physics, Faculty of Science, Tabuk University, Tabuk, KSA
2Physics Department, Faculty of Science, Fayoum University, El Fayoum, Egypt
Email: tahanafy2@yahoo.com
Copyright © 2013 Taha A. Hanafy. This is an open access article distributed under the Creative Commons Attribution License, which permits unrestricted use, distribution, and reproduction in any medium, provided the original work is properly cited.
Received March 24, 2013; revised May 10, 2013; accepted May 19, 2013
Keywords: Miscibility; Dielectric Relaxation; Electric Modulus; Blending
ABSTRACT
The miscibility of chlorinated poly vinyl chloride (CPVC) and poly ethylene glycol (PEG) or poly ethylene succinate (PES) had been investigated using dielectric relaxation spectroscopy (DRS) over frequency and temperature ranges; 10 kHz - 4 MHz and 300 - 450 K, respectively. Three relaxation processes namely ρ-, α’-, and α-relaxation processes were observed for tan(δ) and the electric modulus M" of pure components and blends. The first one was attributed to the space charge polarization or the Maxwell-Wagner polarization. The second one was related to the amorphous regions located between the lamellar crystal stacks. The third one was due to the micro-Brownian motion of CPVC main chains. This process was found to be dependent in respect of temperature and frequency. The molecular dynamics of α-relaxation process were influenced by blending, i.e., the dielectric strength (De), the peak broadness, and the peak maximum of tan(δ) were found to be compositional dependent. Electric modulus analysis reveals that there is a role of electrode polarization for the dielectric relaxation.
1. Introduction
Biodegradable polymers have recently received more attention from the view point of environment protection and resource. Biodegradable polymers can usually be classified into two categories. One is the biosynthetic polymers, such as bacterial Poly(3-hydroxybutyrate) (PHB) [1]. The other is the chemosynthetic polymers such as poly ethylene glycol (PEG) and the poly ethylene succinate (PES) as aliphatic biodegradable polyester. The crystal structure, morphology and melting behavior of PES have been reported [2-4]. The chemical structure of PEG and PES are
 and
and
 , respectively.
PEG is used in most of the applications of aqueous phase partitioning. PEG is biocompatible and biodegradable polymer and has adhesive and flocculent properties [5]. Blend of PEG or PES with other polymers has been studied in order to modify the physical properties and extend its practical applications. Till now, less work has been done on blending PEG or PES with other polymers such as PVC or CPVC.
It is well known that miscibility and crystallization behaviors play crucial roles in physical properties of polymer blends. The most common and particularly important miscible polymer owes hydrogen bonding and electrostatic interactions between the different groups on the polymeric structure of the components. The weak hydrogen bond is postulated between halogen-containing polymers, such as PVC or CPVC, and the oxygen containing polymers [6]. This type of interaction is responsible for the miscibility of various polymers [7-9]. CPVC contains a higher content of chlorine groups and a higher α-hydrogen than PVC. Consequently, CPVC may have a wider miscibility window than PVC when blending with other polymers [10-12]. The compatibility of many PVCbased blends has been reported by the detected of glass rubber transition, Tg, which involves solid-state analysis. In the amorphous phase of polymers, there are two main chain motion; micro-Brownian motion, which occurs at Tg, and a more local type of motion, which occurs in the glassy state. The study of the amorphous loss (α) provides the most reliable means of assessing miscibility in polymer blends. In binary blend, relaxation process is based on the occurrence of either one or multiple loss peaks [7]. A single α-relaxation peak correspond a miscible blend.
It is possible to identify low cost and rapid techniques to study the miscibility of polymer blends. The main method to find out the number of the amorphous phases in polymer blends is the determination of the number of Tg because each Tg corresponds to one amorphous phase. Different experimental techniques including different scanning calorimetry (DSC), dynamical mechanical thermal analysis (DMTA) and dielectric relaxation spectroscopy (DRS) are used for the determination of Tg [13].
DRS is used to probe long and short range motions of macromolecular motions of mobile charges as a function of both frequency and temperature. Several researchers have been used DRS to examine the degree of miscibility in polymer blends [14-16]. Peak shifts and broadening are commonly observed for miscible or partially miscible polymer blends. It has been found that miscible polymer blends exhibit single Tg and one loss curve in dielectric or mechanical measurements. However, Alegria et al. [17] found that miscible blends of cis-polyisoprene (PI) and poly vinyl ethylene (PVE) exhibit biomodal dielectric loss curves for α-relaxation process. Biomodal means that a loss curve exhibits two peaks or a main peak and shoulder.
This study was aimed at exploring the miscibility and phase behavior of CPVC-PEG and CPVC-PES blends by using DRS technique. Because C-Cl, OH, C=O and ether groups have a strong dipole moment, relaxation processes of these blends can be examined with dielectric measurements. Subsequently, the dielectric data can also give hints about the molecular interaction in such blends.
2. Experimental
2.1. Materials
CPVC used in this work was obtained from Goodrich Chemical Division with Mw = 119,000, Tg = 352 K and it contains 67.2 wt% chlorine, PEG (Mw = 5400 and Tg = 208 K) was supplied from British Drug Houses Ltd. (BDH) and PES was obtained from Aldrich Chemical Co with Mw = 22,000 and Tg = 225 K.
2.2. Method
Blend of CPVC and PEG or PES was prepared by slowly casting film from tetrahydrofuran (THF, Aldrich) solutions as follows: An aqueous solution was obtained by adding 1 g of PVC to 20 mL of THF and the heating of the mixture to 40˚C with continuous stirring. PEG or PES of 10 wt% was dissolved in 5 ml of THF at 40˚C. The mixture was added to the CPVC solution at 40˚C with continuous stirring of the final mixture for 8 h. The aqueous solution of the mixture was cast into a Petri dish placed on a leveled plate at room temperature (30˚C) for 7 days until the solvent was completely evaporated. The obtained polymer film, 0.08 mm thick, was cut into square pieces and coated with silver paste to achieve ohmic contacts.
2.3. Dielectric Measurements
The dielectric measurements were carried out with a Hioki (Ueda, Nagano, Japan) model 3532 High Tester LCR, the accuracy of which for measuring the capacitance was of the order of ±0.08%. The dielectric constant (e'), and dielectric loss index (e") were recorded at frequency and temperature ranges 10 kHz - 4 MHz and 300 - 450 K, respectively. Both e' and e" were calculated as follows:
 (1)
(1)
where c is the capacitance of the sample filled capacitor, d is the sample thickness, eo is the vacuum permittivity, and A is the electrode area. The temperature was measured with a T-type thermocouple with its junction just in contact with the sample with accuracy better than ± 1 K.
3. Results and Discussion
3.1. Dielectric Relaxation of CPVC
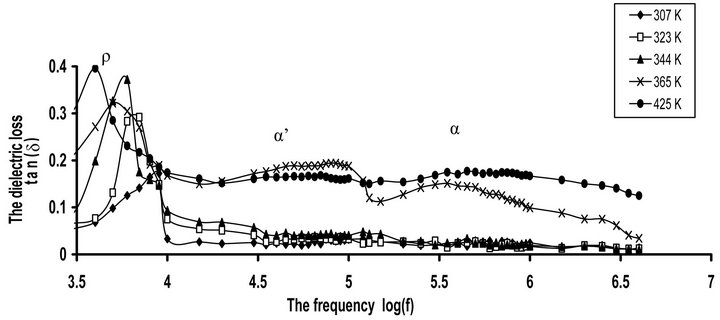
Figure 1(a) shows the frequency dependence of dielectric loss tan(δ) for Pure CPVC sample at some fixed tem-
 (a)
(a)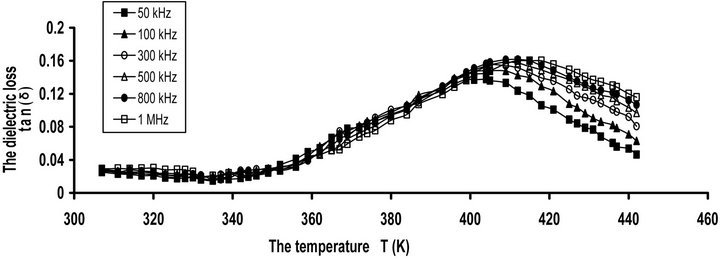 (b)
(b)
Figure 1. (a) The frequency dependence of dielectric loss tan(δ) for pure CPVC at some fixed temperatures. (b) The temperature dependence of dielectric loss tan(δ) for pure; CPVC at some fixed frequencies.
peratures. The variation of tan(δ) with frequency gives evidence for a very distinct dipolar peak whose position depends on the ambient temperature. Obviously, three relaxation processes can be observed for tan(δ). The high frequency side process, at 560 kHz, is related to the main α-relaxation process. The origin of this process is the micro-Brownian cooperative motion of the CPVC main chain. This behavior is connected with the onset of largescale motion of the main chain segments in the vicinity of Tg of CPVC. The loss maximum peak of this process shifts to a higher frequency with increasing in temperature. This indicates that the dielectric process for peak is dipolar in nature [7]. The middle frequency side, at 80 kHz, is α’-process. This effect can be assigned to the cooperative motions of CPVC end groups [7] or the segmental motion of the branching that occurs between CPVC main chains. This will form a rigid amorphous phase between adjacent lamellae within the lamellar stacks of CPVC. The low frequency side, at 10 kHz, is the ionic conductivity or ρ-relaxation process. This process appears at higher temperature as a rapid increase in tan(δ). This effect attributes to the existence of space charge polarization and the free charge motion within the material and also related to so called conductivity current relaxation process [18,19].
Figure 1(b) depicts the temperature dependence of tan(δ) for pure CPVC sample at some selected frequencies. It is clear that, tan(δ) for CPVC sample undergoes only α-relaxation process at 405 K. This process is related to Tg of CPVC. The peak maximum of α-process shows an increase in its magnitude with the increase of temperature as a result of the micro-Brownian motion of CPVC main chains. Moreover, α-relaxation process peak can be ascribed to the release of the frozen-in dipolar C-Cl groups and their cooperative motion with adjoining segments of the main chain [20].
3.2. Miscibility Study Based on Tg Analysis
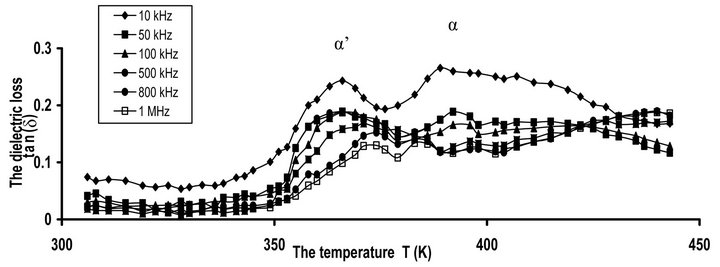
The study of miscibility in polymer blends by DRS involves principally the assessment of the presence of one or more α-relaxation peaks and the accurate locations of the temperature and frequency. The temperature dependence of tan(δ) for CPVC blends with 10 wt% of PEG at some selected frequencies is illustrated in Figure 2" target="_self"> Figure 2(a). It is seen that, tan(δ) exhibits α’- and α-relaxation processes at 366 K and 389 K, respectively. α’-relaxation process has been reported for PVC [7,21,22] but this effect is weak and is not always observed in compassion with the main α-relaxation process. α’-peak always observed for methyl ester form polymer. It reflects the cooperative dipole motion of C-O-CF2-CF-(CF3) for perfluoro carboxylate polymer [7]. For poly hyroxyburate (PHB), this process was assigned to the rigid amorphous phase located between adjacent lamellae within the la-
 (a)
(a) 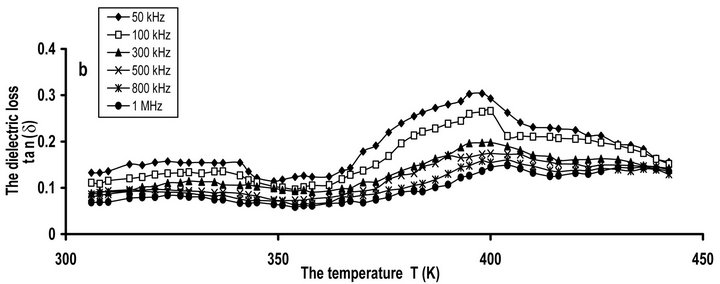 (b)
(b)
Figure 2. The temperature dependence of dielectric loss tan(δ) for (a) CPVC-PEG blend (b) CPVC-PES blend at some fixed frequencies.
mellar stacks [23]. Both α’- and α-peaks for PHB are attributed to the existence amorphous fraction in two distinct morphological environments. For CPVC-PEG blend the appearance of α’-process can be discussed as follows: the blend of CPVC with 10 wt% of PEG increases the amorphous phases between the crystalline phases of CPVC via the crosslinking formation [24]. This crosslinking comes from the hydrogen bonds that formed between the oxygen of PEG and the α-hydrogen of the chlorine groups of CPVC structure. Therefore, α’-process for CPVC-PEG blend can be attributed to the rigid amorphous phases that located between adjacent lamella inside the lamellar stacks of CPVC [25,26].
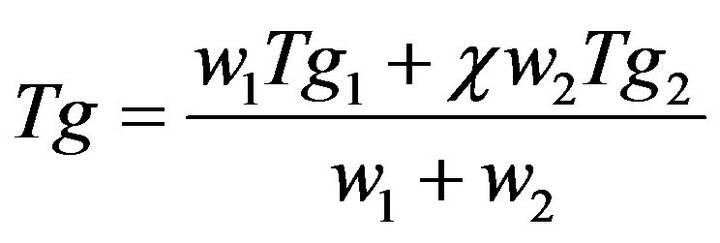
The dielectric results for CPVC-PEG blend show that the location of the main α-relaxation peak is altered by the existence of PEG content. According to these results, CPVC and PEG are compatible because the value of Tg for CPVC-PEG is 394 K at 50 kHz. Furthermore, the glass temperature of the blend can be calculated by the Gordon-Taylor equation [27]:
 (2)
(2)
where w1 and w2 are the weight fraction of two components, Tg1 and Tg2 are respective Tg of the neat component.  is a parameter related to the strength of the interaction between the two polymers. The value of
  for CPVC is one [28]. The calculated value of Tg for CPVC-PEG blend using Equation (2) is 388 K. It is obvious that, CPVC-PEG blend shows a single composition dependent Tg between those of the two neat components. This indicates that CPVC and PEG are miscible over the entire composition range. It is clear that, Tg of CPVCPEG blend decreases after blending with the low Tg component of PEG, resulting in the increase of mobility of CPVC main chain in the blend. So, one can suggest that, PEG act as a plasticizer for CPVC. The plasticization effect of PEG results from the hydrogen bond formation between its oxygen and the α-hydrogen of the C-Cl groups of CPVC. Then, PEG molecules make a widely spacing between the CPVC main chains and reducing Tg of the pure components. The reduction of Tg of CPVC-PEG blend can also assign to weaken of the intermolecular interaction, which makes the macromolecules of CPVC take mainly flexible conformation.
The miscibility of CPVC-PES blend was studied by measuring of Tg from the temperature dependence of tan(δ). Figure 2(b) illustrates the temperature dependence of tan(δ) for CPVC blends with 10 wt% of PES at some fixed frequencies. Two α’- and α-relaxation processes are observed at 330 K and 393 K, respectively. The calculating Tg of CPVC-PES blend, using Equation (2), is 390 K. This indicates that CPVC and PES are compatible. The miscibility between CPVC and PES has been reported [29]. where the thermally stimulated depolarization current (TSDC) of CPVC-PES blend exhibits only α-relaxation process. Also, PVC/ethylene vinyl acetate carbon monoxide polymer blends have been reported to be miscible [22] on the basis of the specific interaction between C=O and α-hydrogen of C-Cl groups for PVC structure. It is well known that, for a highly miscible blend, tan(δ) curve shows only a single peak in between the glass transition temperatures of the component polymers, whereas broadening of the transition occurs in the case of partially miscible system. So, one can suggest that, CPVC and PES are compatible as a manifested by a single α-relaxation process over the studied ranges of temperature and frequency.
Figure 3 depicts the temperature dependence of e’ for pure CPVC and that blend with 10 wt% of PEG or PES at 50 kHz. It is clear that, e’ increases gradually with the increase of temperature and then, it reach to a maximum value. The initial increase in e’ is attributed to the reorientation of the dipoles such as C-Cl, CH2, and C=O. Also, CPVC-PEG or CPVC-PES blend samples exhibit e’ higher value than that obtained in the case of pure components. This can be attributed to the dipolar reorientation of CH2, -O-, and OH groups for CPVC-PEG blend and CH2, -O-, C=O groups for CPVC-PES blend.
The frequency dependence of tan(δ) for CPVC blends with 10 wt% of PEG or PES at some fixed temperatures is shown in Figures 4(a) and (b). Three relaxation processes ρ, α’, and α are observed at low, middle and higher frequency side respectively. The two α and α’-relaxation processes for pure and blend CPVC samples can be described by the Havrillak Negami (HN) equation [20]:
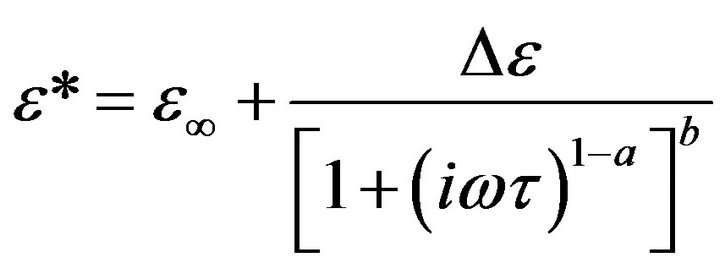 (3)
(3)
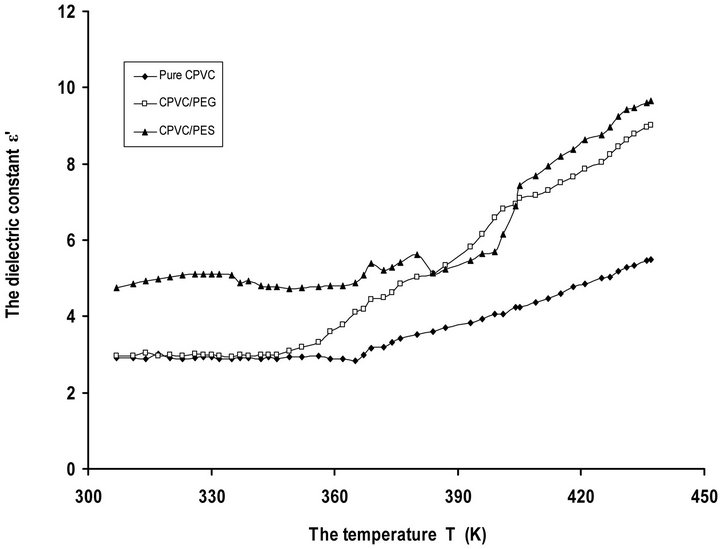
Figure 3. The temperature dependence of dielectric constant e' for pure CPVC and that blends with 10 wt% of PEG or PES at 50 kHz.
 (a)
(a)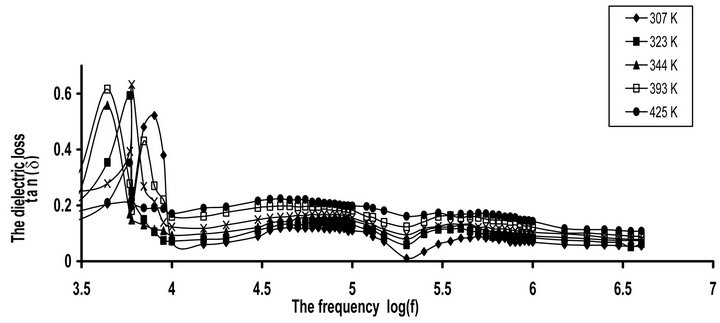 (b)
(b)
Figure 4. The frequency dependence of dielectric loss tan(δ) for (a) CPVC-PEG blend (b) CPVC-PES blend at some fixed temperatures.
where ω is the angular frequency, a and b are parameters, which describe the shape of the relaxation time distribution function. t is the relaxation time, e* is the complex dielectric permittivity, and De = (eo − e∞) is the dielectric strength. eo and e∞ are unrelaxed and relaxed dielectric constant, respectively. When b = 1 the last equation reduced to the Cole-Cole relationship. An abrupt increase in tan(δ) values was observed at low frequency. This investigates that the existence of space charges polarization or conduction current relaxation process. For previous study [20] HN equation has been fitted to the experimental of e"(ω) with a = 0.35 - 0.3 and b = 0.45 - 0.4.
Also, the conductivity term  was added to the fitting function to account for the drift charge carrier. Then the Equation (3) becomes:
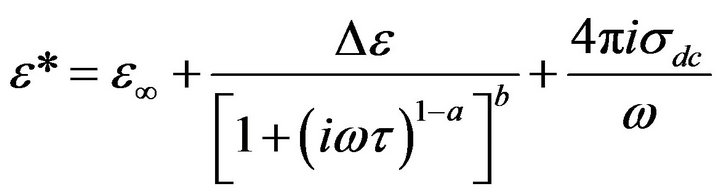 (4)
(4)
where sdc is dc conductivity.
The temperature dependence of the dielectric strength (De) for pure CPVC and that blend with 10 wt% of PEG or PES is shown in Figure 5. It is obvious that, the values of De increase with the increase of temperature. This can be attributed to the cooperation which exists between thermal energy and the electric field effects of the dipole alignments. Increasing of thermal energy of C-Cl, C=O, CH2, and OH groups will tend to enhance the alignment of themselves with the direction of the applied field. So, the increase of De with the increase of temperature is expected.
The cooperative relaxation behavior of α-relaxation process for pure components and blends can be described by the Arrhenius relation [30]:
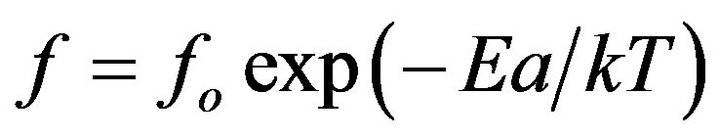 (5)
(5)
where Ea is the activation energy for the α-relaxation process, fo is constant, k is the Boltzmann constant and T is the absolute temperature. The relation between ln(fmax) versus 1000/T is shown in Figure 6. The calculated activation energy for Pure CPVC, CPVC-PEG blend, and CPVC-PES blend are 326 kJ/mol, 240 kJ/mol, and 311 kJ/mol, respectively. The values of Ea are higher than that reported [31-33]. This may refer to the existence of micro-homogeneities within the polymeric materials [1].
Figure 7 shows the normalized dielectric relaxation
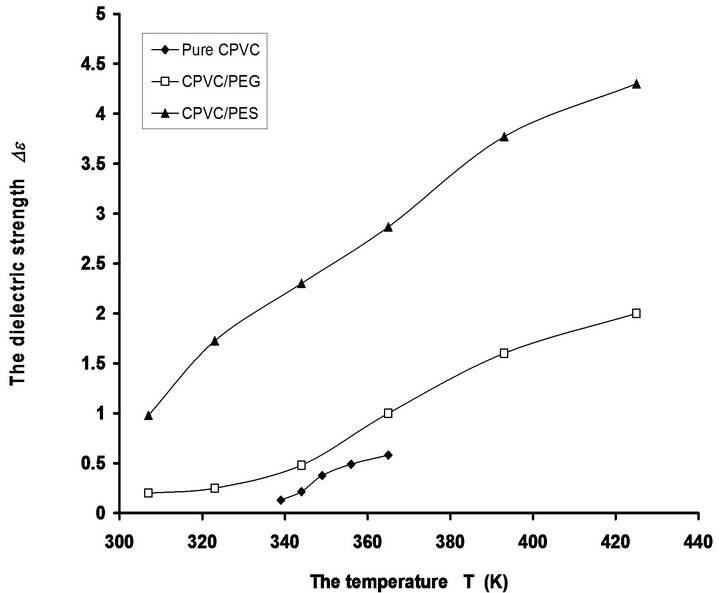
Figure 5. The temperature dependence of dielectric strength De for pure CPVC and that blend with 10 wt% of PEG or PES.
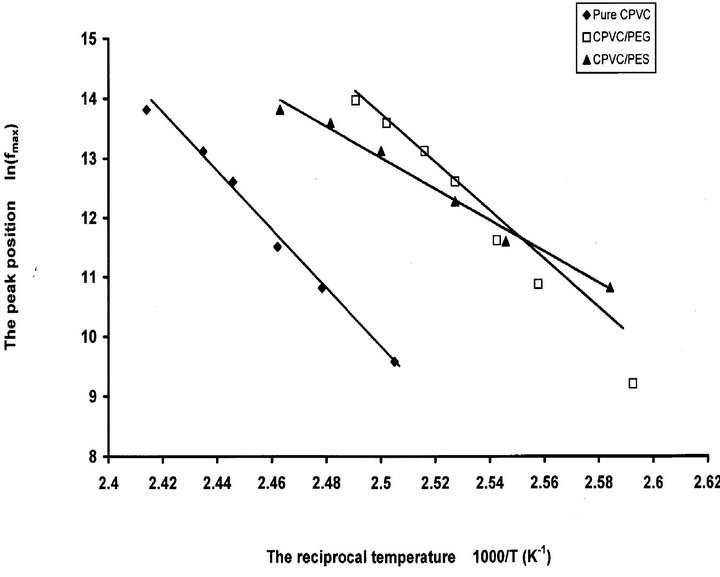
Figure 6. The peak position of the α-relaxation process ln(fmax) versus 1000/T for pure CPVC and that blends with 10 wt% of PEG or PES.
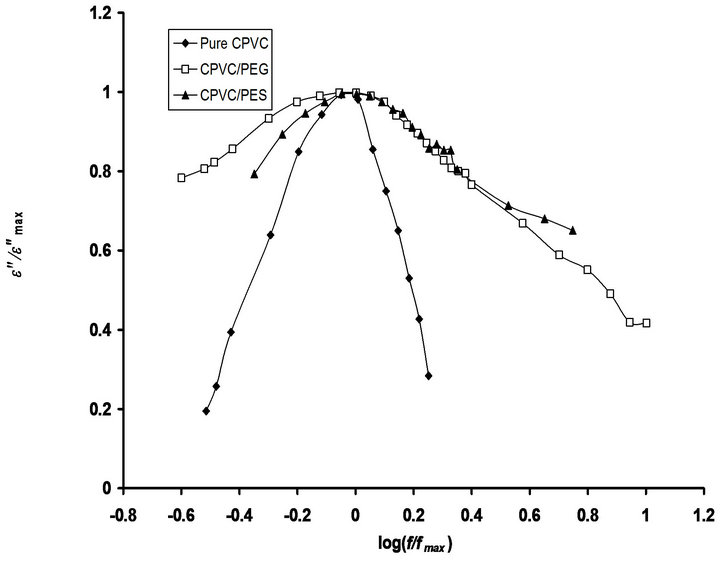
Figure 7. Normalized dielectric relaxation spectra of the α-relaxation process for pure CPVC and that blends with 10 wt% of PEG or PES at 344 K.
peaks, e”/e”max versus f/fmax, of the α-relaxation process for pure CPVC and CPVC-PEG blend and CPVC-PES blend. It is noticed that, the relaxation peak is broader in the blend samples. The distribution of relaxation time of the glass relaxation process for many blends was strongly influenced by blending [34]. Blending leads to broader α-relax ation peak than that achieved in the pure components. This behavior does not mean the existence of two micro-phases in the blend sample but rather the existence of concentration fluctuations which persist for a sufficient length [31].
From another point of view, we used the complex electric modulus M* to interpret the dielectric spectra. The main advantage of M* is that the electrode polarization can be supported. Since the electrode polarization affect the relaxation process for the polymeric system, it is important to analyze the dielectric spectra by M* formalism. M* can be described by the following [35]:
 (6)
(6)
 (7)
(7)
 (8)
(8)
where M' and M" are the real and the imaginary parts of the electric modulus, respectively.
The temperature dependence of M' for pure CPVC and that blend with 10 wt% of PEG or PES at 50 kHz is illustrated in Figure 8. The behavior of M' exhibits saturation region at temperature ranges 306 - 360 K, 306 - 350 K, and 306 - 333 K for pure CPVC, CPVC-PEG, and CPVC-PES, respectively. So, blend sample exhibits saturation region wider than that obtained for pure one. This indicates that the thermal stability of CPVC is decreased with blending. This is another evidence for the plasticization effect of PEG or PES. At higher temperature M' for pure components and blends tends to reach a constant value. This indicates that the dielectric constant is thermally activated [30]. Consequently, M' data reveal that there is a role of electrode polarization for the relaxation process of pure component and blends.
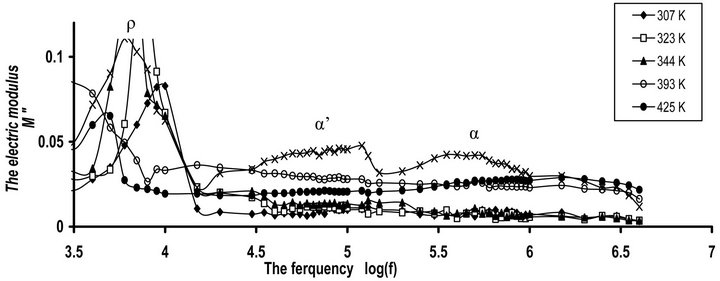
Figures 9(a) and (b) show the frequency dependence of M" for CPVC-PEG blend and CPVC-PES blend at some fixed frequencies. Same behavior of M" for both blend samples was obtained. M" for blends exhibits ρ-, α’-, and α-relaxation process, respectively. So, the space charge, ρ-process, or conductivity current relaxation process is still found in the relaxation process of the
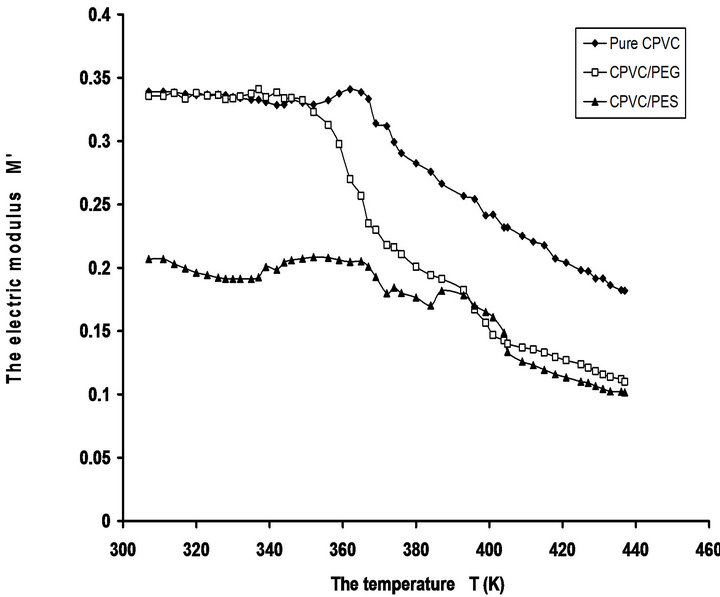
Figure 8. The temperature dependence of real part of the dielectric modulus M' for pure CPVC and that blends with10 wt% of PEG or PES at 50 kHz.
 (a)
(a)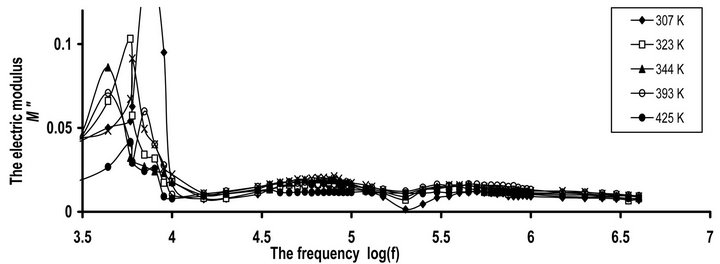 (b)
(b)
Figure 9. The frequency dependence of imaginary part of the dielectric modulus M" for (a) CPVC-PEG blend (b) CPVC-PES blend at some fixed temperatures.
blends. This process originates from the motion of space charges that are accumulated on the polymer close to electrodes. The nature of this process for crystalline regions is due to the chain trapping or interfaces or Maxwell-Wagener polarization. However, in the amorphous phases, ρ-process is related to conductive impurities, injected space charges and electrode polarization. In semi-crystalline polymers chain trapping or Maxwell Wagner polarization can be expected [29]. For CPVCPEG blend or CPVC-PES blend, this effect can be assigned to the multiple phases within the blend sample. These phases come from the hydrogen bond formation between the oxygen containing PEG or PES and the α- hydrogen of the halogen groups within the CPVC structure. Consequently, these phases may have different conductivities and the Maxwell Wagner polarization is predominant for the blend samples.
4. Conclusion
The miscibility of CPVC-PEG or CPVC-PES blend has been studied using dielectric relaxation spectroscopy. The dielectric spectra of the blends reveal that, both PEG and PES are compatible with CPVC as a manifested by a single α-relaxation process. The frequency dependence of tan(δ) and M" allows us to detect three relaxation processes in pure components and blends. The first one occurs at low frequency, ρ, and the second, α’, which is attributed to the existence of amorphous fractions in two distinct morphological environments during the blend process. The third one is the main α-relaxation process which occurs at Tg. This process is found to be greatly influenced by blending. Electric modulus relaxation for the blends provides that there is a role of electrode polarization for the dielectric relaxation.
5. Acknowledgements
The author is very thankful to Dr. A. Hassen, Department of Physics, Fayoum University, Fayoum, Egypt for the revision of this work.
REFERENCES
- T. A. Hanafy, K. Elbana, S. El-Sayed and A. Hassen, “Dielectric Relaxation Analysis of Biopolymer Poly(3-Hydroxybutyrate),” Journal of Applied Polymer Science, Vol. 121, No. 6, 2011, pp. 3306-3313. doi:10.1002/app.33950
- M. Barsbay and A. Güner, “Miscibility of Dextran and Poly(Ethylene Glycol) in Solid State: Effect of the Solvent Choice,” Carbohydrate Polymers, Vol. 69, No. 2, 2007, pp. 214-223. doi:10.1016/j.carbpol.2006.09.028
- F. Yang, Z. Qiu and W. Yang, “ Miscibility and Crystallization of Biodegradable Poly(Butylene Succinate-coButylene Adipate)/Poly(Vinyl Phenol) Blends,” Polymer, Vol. 50, No. 10, 2009, pp. 2328-2333. doi:10.1016/j.polymer.2009.03.029
- T. Iwata, Y. Doi, K. Isono and Y. Yoshida, “Morphology and Enzymatic Degradation of Solution Grown Single Crystals of Poly(Ethylene Succinate)” Macromolecules, Vol. 34, No. 21, 2001, pp. 7343-7348. doi:10.1021/ma010865c
- J. M. Lu, Z. B. Qiu and W. T. Yang, “Fully Biodegradable Blend of Poly(L-Lactide) and Poly(Ethylene Succinate): Miscibility, Crystallization, and Mechanical Properties,” Polymer, Vol. 48, No. 14, 2007, pp. 4196-4204. doi:10.1016/j.polymer.2007.05.035
- P. R. Babu and V. G. Gaikar, “Preparation, Structure, and Transport Properties of Ultrafiltration Membranes of Poly(Vinyl Chloride) (PVC), Carboxylated Poly(Vinyl Chloride) (CPVC), and PVC/CPVC Blends,” Journal of Applied Polymer Science, Vol. 73, No 7, 1999, pp. 1117- 1130. doi:10.1002/(SICI)1097-4628(19990815)73:7<1117::AID-APP3>3.0.CO;2-H
- M. A. Ahmed, T. A. Hanafy, “Dielectric Relaxation and Poole-Frenkel Conduction in Poly(Vinyl Chloride) Blends with Bisphenol A/Egyptian Corncob Resin,” Journal of Applied Polymer Science, Vol. 109, No. 1, 2008, pp. 182- 189. doi:10.1002/app.28075
- M. C. Senake Perera, U. S. Ishiaku and Z. A. Mohd Ishak, “Characterisation of PVC/NBR and PVC/ENR50 Binary Blends and PVC/ENR50/NBR Ternary Blends by DMA and Solid State NMR,” European Polymer Journal, Vol. 37, No. 1, 2001, pp. 167-178. doi:10.1016/S0014-3057(00)00085-9
- L.-X. Zhang, C. Zhou, S.-L. Sun, L. Ren, X.-L. Ma, M. Y. Zhang and H.-X. Zhang, “Study of Compatibility, Morphology Structure and Mechanical Properties of CPVC/ ABS Blends,” Journal of Applied Polymer Science, Vol. 116, No. 6, 2010, pp. 3448-3454.
- R. J. Sikorski and E. Crerwinska, “Studies on Reactivity of Polymers Chlorination of Poly(Vinyl Chloride) Using Sulphuryl Chloride in Solution in the Presence of Radical Initiators,” European Polymer Journal, Vol. 22, No. 2, 1986, pp. 179-183. doi:10.1016/0014-3057(86)90115-1
- L. G. Bourland and D. M. Braunstein, “Single Phase Polymer Systems: CPVC/Styrene Copolymer Alloys,” Journal of Applied Polymer Science, Vol. 32, No. 8, 1986, pp. 6151-6161. doi:10.1002/app.1986.070320802
- W. Huh and F. E. Karasz,” Miscibility Behavior in Blends of Poly(Acrylonitrile-co-Butadiene),” Macromolecules, Vol. 25, No. 3, 1992, pp. 1057-1061. doi:10.1021/ma00029a007
- T. Sterzynsk, J. Tomaszewsk, K. Piszczek and K. Skorczewska, “The Influence of Carbon Nanotubes on the PVC Glass Transition Temperature,” Composites Science and Technology, Vol. 70, No. 6, 2010, pp. 966-968. doi:10.1016/j.compscitech.2010.02.013
- M. A. Ahmed and T. A. Hanafy, “Neutron Dosimetry Measurement,” Indian Journal of Physics, Vol. 70, No. 10, 2005, pp. 1149-1155.
- K. Urman, S. Madbouly and J. U. Otaigbe, “Unusual Accelerated Molecular Relaxations of a Tin Fluorophosphates Glass/Polyamide 6 Hybrid Studied by Broadband Dielectric Spectroscopy,” Polymer, Vol. 48, No. 6, 2007, pp. 1659-1666. doi:10.1016/j.polymer.2007.01.031
- Y. Hirose and K. Adachi, “Dielectric Study of Dynamical Heterogeneity in Blends of Polyethers,” Journal of Non-Crystalline Solids, Vol. 352, No. 42-49, 2006, pp. 4758-4762. doi:10.1016/j.jnoncrysol.2006.01.110
- A. Alegria, J. Colmenero, K. L. Ngai and C. M. Rol, “Observation of the Component Dynamics in a Miscible Polymer Blend by Dielectric and Mechanical Spectroscopies,” Macromolecules, Vol. 27, No. 16, 1994, pp. 4486-4492. doi:10.1021/ma00094a009
- E. Mitzoner, H. Goering and R. Becker, “Polyurethane Elastomers Based on Polymer Polyols,” Die Angewandte Makromolekulare Chemie, Vol. 220, No. 1, 1994, pp. 177-188. doi:10.1002/apmc.1994.052200115
- P. A. M. Steeman, C. Goudard and R. L. Scherrenberg, “A Broad-Band Dielectric Study of Poly(Vinyl Chloride): Effect of Molar Mass and Processing Conditions on Space-Charge Mechanisms,” Journal of Polymer Science Part B: Polymer Physics, Vol. 32, No. 1, 1994, pp. 119- 130.
- S. Mahrous and T. A. Hanafy, “Dielectric Analysis of Chlorinated Polyvinyl Chloride Stabilized with Di-nOctyltin Maleate,” Journal of Applied Polymer Science, Vol. 113, No. 1, 2009, pp. 316-320. doi:10.1002/app.29490
- L. M. Robeson, “Miscible Polymer Blends Containing Poly(Vinyl Chloride),” Journal of Vinyl Technology, Vol. 12, No. 2, 1990, pp. 89-94. doi:10.1002/vnl.730120209
- S. A. Madbouly, A. A. Mansour and N. Y. Abdou, “Crystallization Kinetics of PHB/PVAc Blends Using Time Resolved Dielectric Spectroscopy,” European Polymer Journal, Vol. 43, No. 9, 2007, pp. 3933-3942. doi:10.1016/j.eurpolymj.2007.06.020
- S. A. Madbouly, A. A. Mansour and N. Y. Abdou, “Molecular Dynamics of Amorphous/Crystalline Polymer Blends Studied by Broadband Dielectric Spectroscopy,” European Polymer Journal, Vol. 43, No. 5, 2007, pp. 1892-1904. doi:10.1016/j.eurpolymj.2007.03.004
- S. Nouh, A. Mohamed, H. M. El Hussieny and T. M. Hegazy, “Modification Induced by Alpha Particle Irradiation in Makrofol Polycarbonate,” Journal of Applied Polymer Science, Vol. 109, No. 6, 2008, pp. 3447-3451. doi:10.1002/app.28469
- C. Alvarez, I. Sics, A. Nogales, Z. Denchev, S. S. Funari and T. A. Ezquerra, “Structure-Dynamics Relationship in Crystallizing Poly(Ethylene Terephthalate) as Revealed by Time-Resolved X-Ray and Dielectric Methods,” Polymer, Vol. 45, No. 11, 2004, pp. 3953-3959. doi:10.1016/j.polymer.2003.09.069
- A. Sanz, A. Nogales, T. A. Ezquerra, N. Lotti, A. Munari and S. S. Funari, “Order and Segmental Mobility during Polymer Crystallization: Poly(Butylene Isophthalate),” Polymer, Vol. 47, No. 4, 2006, pp. 1281-1290. doi:10.1016/j.polymer.2005.12.047
- Y. S. Yang and S. J. Kim, “Study of Glass Transition Temperatures in Sugar Mixtures,” Journal of the Korean Physical Society, Vol. 46, No. 3, 2005, pp. 606-609.
- D. S. Hubbell and S. L. Cooper, “The Physical Properties and Morphology of Poly-ϵ-Caprolactone Polymer Blends,” Journal of Applied Polymer Science, Vol. 21, No. 11, 1977, pp. 3035-3061. doi:10.1002/app.1977.070211117
- S. Mahrous, “Study of Dielectric Relaxation of Chlorinated Polyvinyl Chloride (CPVC)-Poly(Ethylene Succinate) (PES) Blend,” International Journal of Polymeric Materials and Polymeric Biomaterials, Vol. 44, No. 1-2, 1999, pp. 145-156. doi:10.1080/00914039908012141
- A. Hassen, T. A. Hanafy, S. El-Sayed and A. Himanshu, “Dielectric Relaxation and Alternating Current Conductivity of Polyvinylidene Fluoride Doped with Lanthanum Chloride,” Journal of Applied Physics, Vol. 110, No. 11, 2011, Article ID: 114119. doi:10.1063/1.3669396
- R. Singh, J. Kumar, R. K. Singh, A. Kaur, R. D. P. Sinha and N. P. Gupta, “Low Frequency ac Conduction and Dielectric Relaxation Behavior of Solution Grown and Uniaxially Stretched Poly(Vinylidene Fluoride) Films,” Polymer, Vol. 47, No. 16, 2006, pp. 5919-5928. doi:10.1016/j.polymer.2006.06.023
- M. Abdelaziz and M. M. Ghannam, “Influence of Titanium Chloride Addition on the Optical and Dielectric Properties of PVA Films,” Physica B: Condensed Matter, Vol. 405, No. 3, 2010, pp. 958-964. doi:10.1016/j.physb.2009.10.030
- S. Mahrous, T. A. Hanfy and M. S. Sobhy, “Dielectric Relaxation of Chlorinated Polyvinyl Chloride (CPVC) Stabilized with Cyanoguamidine,” Current Applied Physics, Vol. 7, No. 6, 2007, pp. 629-635. doi:10.1016/j.cap.2007.01.002
- R. E. Wetton, W. J. Macknight, J. Fried and F. E. Karasz, “Compatibility of Poly(2,6-dimethyl-1,4-phenylene oxide) (PPO)/Poly(styrene-co-4-chlorostyrene) Blends. 2. Dielectric Study of the Critical Composition Region,” Macromolecules, Vol. 11, No. 1, 1978, pp. 158-165. doi:10.1021/ma60061a028
- T. A. Hanafy, “Dielectric Relaxation and Alternating Current Conductivity of Lanthanum, Gadolinium, and Erbium-Polyvinyl Alchol Doped Films,” Journal of Applied Physics, Vol. 112, No. 3, 2012, pp. 34102-34110. doi:10.1063/1.4739752