Advances in Materials Physics and Chemistry
Vol. 2 No. 2 (2012) , Article ID: 19958 , 6 pages DOI:10.4236/ampc.2012.22011
Preparation for Graphite Materials and Study on Electrochemical Degradation of Phenol by Graphite Cathodes
Department of Environmental Science and Engineering, Heilongjiang University, Harbin, China
Email: yuxiujuan@hlju.edu.cn
Received March 31, 2012; revised May 5, 2012; accepted May 17, 2012
Keywords: Electricity Catalytic; Nanographite; Cathode; Phenol
ABSTRACT
Nanographite flake through ultrasound dispersing expanded graphite which got by chemical oxidation and microwave puffing method have been prepared by natural flake graphite. The microstructures of natural flake graphite, expanded graphite and nanographite sheets were characterized by means of SEM, XRD, FTIR and Raman; the cathodes were made by NG, EG and nanographite, respectively; the electrolysis phenol was conducted by the diaphragm cell prepared cathode and the Ti/RuO2 anode. The results showed that the thickness of graphite flake was 18 nm, and the grain size and particle size decreased compared with the NG and EG; Nano-G showed the best electrochemical properties; in the diaphragm electrolysis system with the aeration conditions, the degradation rate of phenol reached 89.5% COD reached 81.3% under 120 min’s electrolysis, which was far above the degradation rate of phenol of EG cathode and NG cathode.
1. Introduction
Carbon materials are the forefront of chemistry, physics, and material science research. Carbon occurs in many forms, and the dependence of the properties of each form on its special structure makes carbon a truly unique building block for nanomaterials. Expanded graphite and nanographite are both belong to carbon materials, which are been studying enthusiastically. Expanded graphite has been applied widely as a kind of functional carbon, used in sealing, catalyzing, mechanism, space flight, military affairs, environment protection [1]. And it is prepared by the methods of electrochemistry and chemistry oxidation. The sulfur-free expanded graphite has been reported [2], for the better quality. Nanographite also with unique chemical and physical structure exhibits good thermal and electrical conductivity, inertness and lubricating ability, and has been widely used in industry, for example, as coating materials for electrical conductors as gaskets and as absorbents for removing spilled oil from water system [3-8]. Up to now, a number of methods for production of nanographite have been developed. For instance, mechanical milling method, detonation splitting method, ultrasonic powdering method and electrochemical intercalation method are based on the nature graphite. And pulsed laser deposition method, detonation synthesis method, chemical vapor deposition method and chemical synthesis method based on fullerene [9].
The removal of hazardous organic pollutants from ground-water and wastewater is one of the most critical and urgent topics in environmental research. Phenols and phenolic compounds have been declared to be hazardous pollutants [10]. Recent decades have seen a considerable effort invested in the determination of phenolic compounds in environmental, industrial, food and clinical matrices [11]. Traditional treatment processes such as biological treatments are not very effective for degradation of phenol, recently, advanced oxidation processes (AOPS) have attracted much attention, since they can be used to effectively treat wastewater containing phenol [12], the electrochemical oxidation has received a great deal of attention recently, mainly because of its ease of control, amenability to automation, high efficiency and environmental compatibility [13]. And the oxidation of wastewater is principally depended on the hydroxyl radical generated on the surface of the electrodes [14]. In order to improve the efficiency of oxidation and accelerated the reaction rate, new cathode material should be find, lots of heterogeneous catalysts materials have been investigated, and graphite materials are widely for the electrode, such as graphite, mesh porous carbon electrode, Carbon-PTFE oxygen-diffusion cathode, etc. [15].
The aim of this work is to prepare expanded graphite by the nature graphite and nanographite based on the expanded, compare the there kinds of graphite material microstructure, electrochemical performance, and electrochemical degradation of phenol in cathode compartment, by now no literatures are reported on the nanographite as phenol degradation cathode, and an effective and friendly material for treating phenol by using a electrochemical oxidation is developed.
2. Experimental
2.1. Preparation of Sulfurfree Expanded Graphite
According to the preparation of lower-sulfur content expand-able graphite with potassium permanganate as oxidant, 2.0 g of nature flake graphite (200 mesh), 1.0 g of potassium permanganate, and 8.0 g perchloric acid were placed into a dry three-necked bottle equipped with a thermometer, and a stirrer, and putted the bottle into water bath kettle. The mixture was continually stirred for 40 min at 35˚C, then was washed to neutrality with water and dried at the temperature of 60˚C to produce the dry expandable graphite. A 500 ml silica beaker containing 1 g of the sulfur-free expandable graphite was put into a microwave oven at 1000˚C for 20 s, and finally the sulfurfree expanded graphite (EG) was obtained.
2.2. Preparation of Nanographite
The nanographite (nano-G) was prepared based on the EG. A weighed amount (1 g) of EG was immersed in 1000 mL of aqueous alcohol solution (75 vol% alcohol and 25 vol% distilled water), and then the mixture was subjected to 12 h powdering in an ultrasonic bath with a power of 100 W. The resulting dispersion was then filtered, repeatedly washed with distilled water, and dried in a thermo-static vacuum oven at 100˚C, to obtain the nano-G. The EG and nano-G treatment process is illustrated in Figure 1.
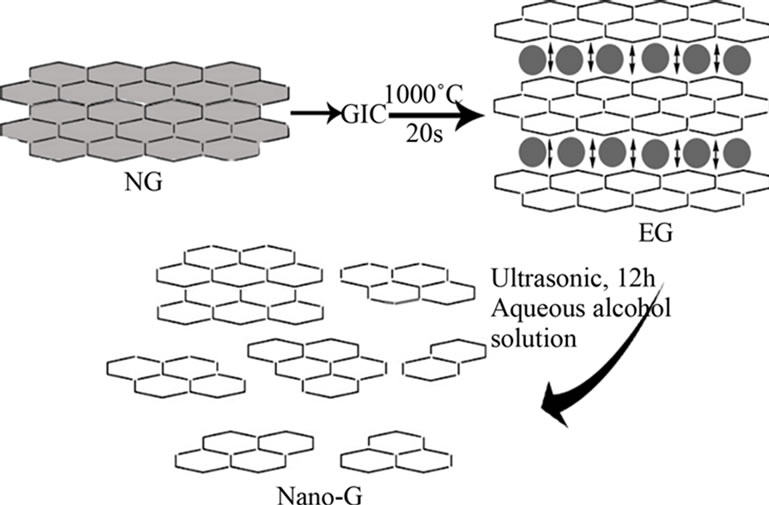
Figure 1. The process of preparing EG and nano-G.
2.3. Preparation of Graphite Cathode for the Three Electrodes System
0.2 g graphite sample and 0.3 g solid paraffin were mixed uniformly in the condition of heat (60˚C), then the mixture was put into the glass tube (diameter is 5 mm), the packing height was 4 cm, and copper wire prepared was inserted in the middle of the glass tube. Finally, made the electrode cooling to the room temperature. The electrode was used in the three electrodes system of the electrochemical workstation to test the electrochemical performance. Marked as A electrode.
2.4. Preparation of Graphite Cathode for the Two Electrodes System
A suspension for the precursor was prepared with a mixture of 1.2 g graphite sample (NG, EG and nano-G), 4.0 ml of ethanol as a dispersant and 4 g of 10% PTFE as a wet-proofing agent and binder. The resulting electrode was then cut to obtain electrodes of 4 cm × 4 cm and about 0.4 mm thick, which was used in the two electrodes system for electrochemical oxidation phenol by constant potential. Marked as B electrode.
2.5. Procedures
Electrochemical performance test was finished in the three electrodes system, working electrode was graphite paraffin electrode (A electrode), auxiliary electrode was platinum wire electrode, and reference electrode was Ag/AgCl (saturation KCl) electrode. Circulation currentvoltage curve was tested in the solution mixed with potassium ferricyanide and supporting electrolyte Na2SO4, Tafel curve was tested in the solution of supporting electrolyte Na2SO4.
Electrolysis was conducted in a terylene diaphragm cell of 100 ml. The anode was a Ti/IrO2/RuO2 net of 16 cm2. The cathode was graphite electrode (B electrode) of 16 cm2. A schematic diagram of the experimental setup was shown in Figure 2. Laboratory direct current power
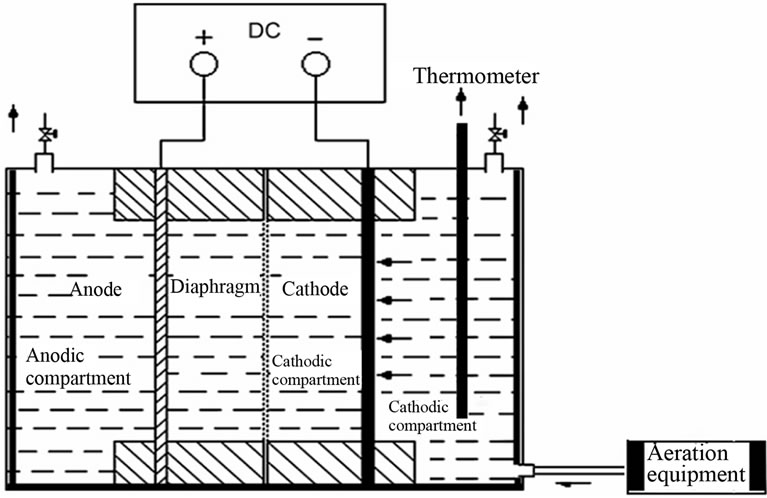
Figure 2. Experimental setup of electrolysis.
supply with current-voltage monitor was employed to provide the electric power. The synthetic wastewater was used. The initial phenol concentration was 100 mg/l. The current density was 39 mA/cm2, the concentration of supporting electrolyte (Na2SO4) was 0.1 mol/L, the distance between electrodes was 3 cm, and the initial pH was 7.0 and the whole procedure was finished in the condition of aeration.
2.6. Analytical Methods
The samples were studied using SEM (Philips XL-30- ESEM-FEG), XRD (XRD-D/maxⅢB, operated at 40 kV and 30 mA, Cu-Kα), Raman spectroscopy (HR800, 458 nm He-Ne laser excitation), FTIR (SP-100), and electrochemical workstation (LK3200, Tianjin).
Chemical oxygen demand (COD) was chosen as a parameter in order to evaluate the oxidation process and was determined according to standard methods [16,17].
3. Results and Discussion
3.1. SEM Characterization
Figure 3 showed the nature flake graphite, expanded graphite and nanographite, respectively. NG appeared the layer structure regularly and parts of a fracture block, the overall structure was massive slight and compact, no duct. The expanded graphite had many tubes like worms, each worm contained a large amount of pores at ektexine, and the pores inside a worm showed a wide range of size distribution [18], and made up of many nanometer thickness graphite flake, the thickness was from nanometer up to micrometer. Subtle interstice whose dimension was about dozens of nanometers to micrometers existed between the flakes, and forms network structure. EG had four-level interstice structure, V-open pore, second lamella Salix leaf pore, second lamella polygon pore and nanopore [19-21], and EG we prepared mainly got second lamella Salix leaf pore and second lamella polygon pore. Compared with the expanded graphite, the worm like expanded graphite with a large amount of pores, and the loose, poral structures embedding inside had been broken into small particles by ultrasound processing after 12 h in air atmosphere. Detailed SEM examination had revealed that the sizes of particles were reduced into a wide range of size distribution
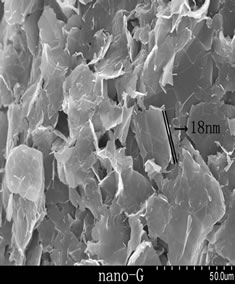
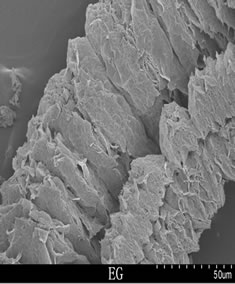
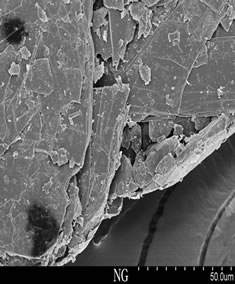
Figure 3. SEM pattern of NG, EG and nano-G.
from hundreds of nanometers to several microns in the form of aggregations, new surface instead of the raw EG inner pore wall, no caking. The nano-Gs were 2D sheets looking like pieces of paper to some degree, and can be measured directly when the sheets were vertical on the sample holder, the thickness of nanographite was about 18 nm.
3.2. FTIR Spectrum
Figure 4 showed the FTIR spectrum of graphite, which revealed three main peaks, the peak at 3469 cm–1 assigned to ν as (OH), 1634 cm–1 assigned to ν as (C=C), 1090 cm–1 assigned to ν as (C-O-C), nano-G FTIR spectrum was more similar to NG, except the peak at 1634 cm–1 was much sharper, EG FTIR had many small peaks except the three main peaks, which caused by oxidation and high temperature expanded. In general, the main functional groups of the three kinds of graphite were coincident.
3.3. XRD Spectrum
Figure 5 represented the XRD profiles for NG, EG, and nano-G. The 2θ diffraction peaks at 26.6˚ and 54.6˚ were attributed to the (002) and (004) planes. The diffraction peaks at 26.6˚ and 54.6˚ were the NG’s characteristic diffraction peaks, the intensity of (002) peak was strongest of the three, (004) peak was of the same case. The two peaks decreased obviously of EG, (004) peak nearly disappeared, for the preparation of EG (the insert of oxide) and the extrusion damaged the structure of NG, influenced the crystalinity of graphite.
After ultrasonic dispersion, the (002) and (004) peak intensity upswinged slightly, meant the graphite crystallinity had rebounded somehow, the crystal form was better than EG without damaging the structure of EG. Compared with EG (002) diffraction peak, the nano-G peak became wider, which meant the grain of nano-G was smaller than EG. It also can be seen from the XRD profiles that during the whole process no other graphite shape formed, for no impurity peaks appeared of the three. We chose the (002) plane diffraction peak to calculated the grain size by Scherrer Equation. The grain size of NG was 24.48 nm, EG was 27.85 nm, nano-G was 17.4 nm.
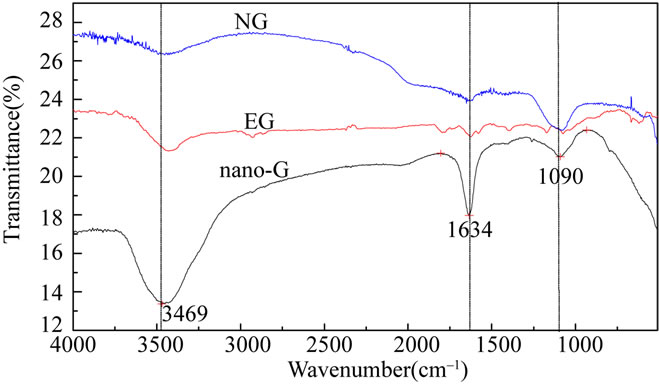
Figure 4. FEIR pattern of NG, EG and nano-G.
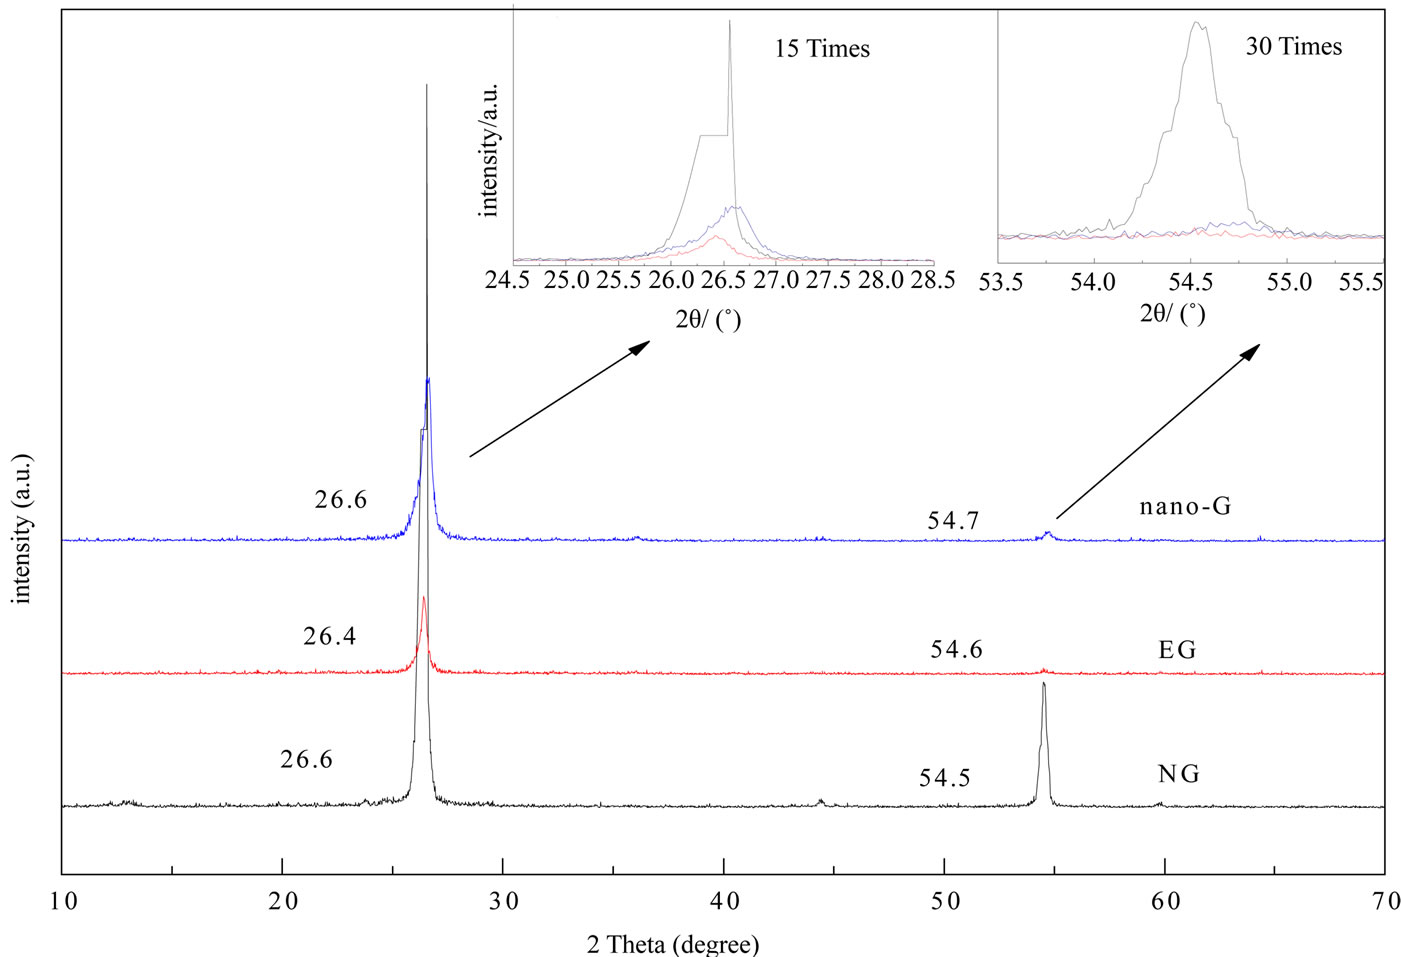
Figure 5. XRD pattern of NG EG and nano-G.
3.4. Raman Spectrum
Raman spectroscopy is a powerful tool to study the structure of the graphite [18,22]. Figure 6 showed the Raman spectra of the NG, EG, nano-G. It demonstrated that nanographite and EG Raman spectroscopy were composed of D-band and G-band, NG just had one poignant peak which was E2g vibration in plane of atom of graphite lattice [23]. The D-band and G-band that were associated with disordered graphite due to the finite particle size effect or lattice distortion, and the vibrations in all sp2 bonded carbon atoms in a 2D hexagonal lattice [24] can be clearly seen. With the degree of disorder increasing, G-band will become wider, when the disorder increased to a certain degree, D-band appeared. Compared with the nano-G D-band intensity, EG D-band was much weaker. D-band and G-band of nano-G became wider for the nanometer size effect. On the basis of Thinstra and Koening, with graphite grain decreasing, the intensity of D-band will increase [25]. The intensity ratio of D band to G band (ID/IG) for the NG was 0, while for EG the ID/IG was 0.078, and for nano-G the ID/IG was 0.423, implied the nano-G grain size was the smallest of the three, which coincided with the result of XRD.
3.5. Electrochemical Properties Test
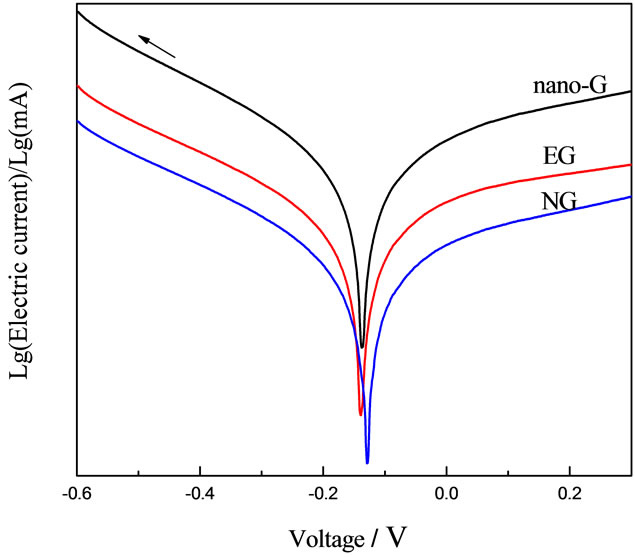
The Tafel curve implied that nono-G electrode had the best electrical conductivity of the three electrodes in Figure 7. Exchangecunent density was the most important parameter of measuring electrode catalytic activity by Kinetics on Electrode Process, the stronger of exchangecunent density, the smaller of overpotential, the faster of reaction speed, which meant the electrode catalytic activity was better [26]. Obviously, the electrode catalytic activity of nano-G electrode was the best of the three. Circulation current-voltage curve showed the highest reversibility and intensity of oxidation reduction peak of the three, which was consistent with the Tafel curve.
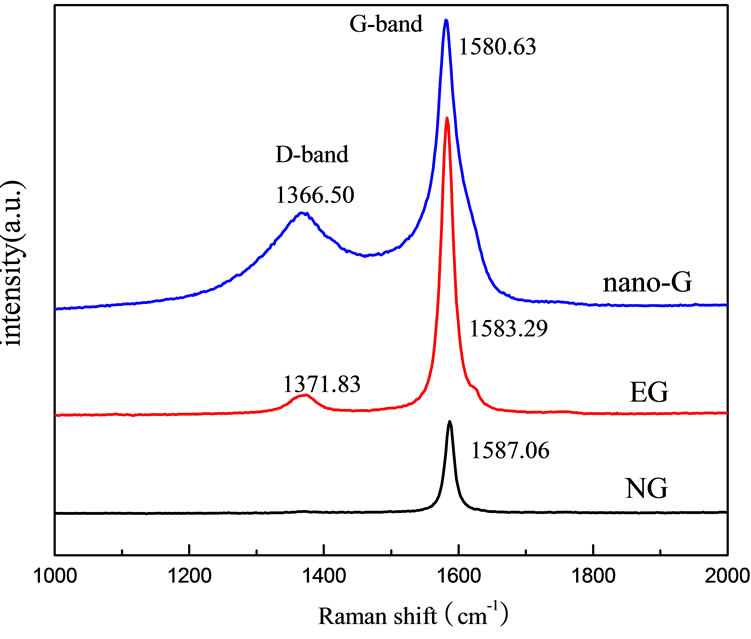
Figure 6. Raman pattern of NG, EG and nano-G.
 (a)
(a)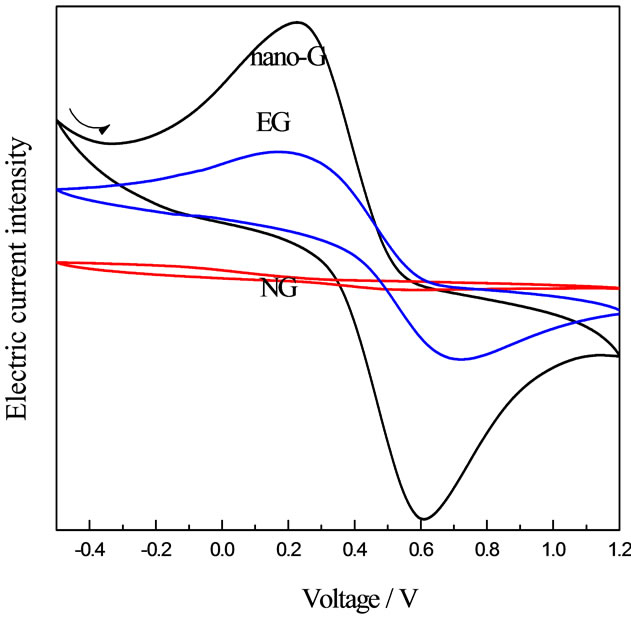 (b)
(b)
Figure 7. Tafel curve and Circulation current-voltage curve of A electrodes (a) Tafel curve of NG, EG and nano-G electrodes; (b) Circulation current-voltage curve of NG, EG and nano-G electrodes ).
4. The Degradation of Phenol in Cathodic Compartment
The electrolysis phenol was conducted by the diaphragm cell prepared cathode and the Ti/IrO2/RuO2 anode [27]. The phenol solution was the simulative phenol wastewater prepared in the lab. In basic electrolyte of the cathodic compartment in the terylene diaphragm cell, graphite electrode catalyzed the two-electron reduction of O2 to H2O2 and , and then H2O2 and
  may be converted to HO· and O2· as follows [28]:
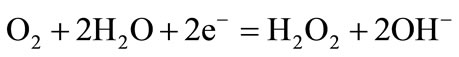 (1)
(1)
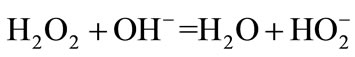 (2)
(2)
 (3)
(3)
The electrochemical reaction mechanisms of the gene-
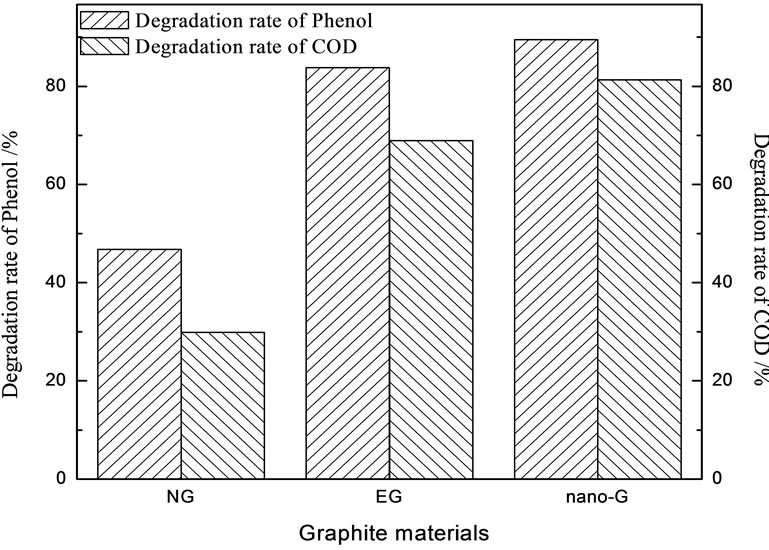
Figure 8. Degradation of Phenol in cathodic compartment (Current density was 39 mA/cm2, initial pH value was 7.0, electrolyte concentration was 0.1 mol/L, phenol initial concentration was 100 mg/L).
ration of HO· and H2O2 by reduction of dissolved oxygen in the cathodic compartment was proved previously [29]. The oxidizing power of H2O2, HO· and O2·– existed in the catholyte during  electroreduction on the cathode was very strong, which can oxidize organics to smaller molecule intermediates or to CO2 and H2O [29].
Nano-G electrode obviously had highest degradation rate by Figure 8, which implied that the great BET and pore structure didn’t improve the degradation rate of phenol and COD, vast sheets exposure of nano-G and small grain size made for the high degradation. This attributed to that nano-G electrode accelerated the two-electron reduction of O2 to H2O2. The degradation of COD was lower than phenol degrdation, which illustrated phenol didn’t mineralize completely, some phenol translated into intermediate product, neutral and alkaline was favor of COD degradation.
5. Conclusions
Series graphite materials were prepared, the process was NG-EG-nano-G, NG interlamination was opened, the grain size was bigger after becoming EG, and nano-G particle size was uniformity, the thickness of nano-G sheet was about 18 nm.
Nano-G showed the best electro-catalysis performance. In the diaphragm electrolysis system with the aeration conditions, the degradation rate of phenol reached 89.5% COD reached 81.3% under 120 min’s electrolysis, which was far above the degradation rate of phenol of EG cathode and NG cathode.
REFERENCES
- R. G. Yu and X. J. Qiao, “Synthesis and Application of Expandable Graphite as a Nanometer Compound Material,” Materials Review, Vol. 17, 2003, pp. 125-126.
- J. H. Li, H. F. Da, Q. Liu and S. F. Liu, “Preparation of Sulfur-Free Expanded Graphite with 320 Mesh of Flake Graphite,” Materials Letters, Vol. 60, No. 29-30, 2006, pp. 3927-3930. doi:10.1016/j.matlet.2006.06.066
- M. Wissler, “Graphite and Carbon Powders for Electrochemical Applications,” Journal of Power Sources, Vol. 156, No. 2, 2006, pp. 142-150. doi:10.1016/j.jpowsour.2006.02.064
- B. Tryba, J. Przepiórski and A. W. Morawski, “Influence of Chemically Prepared H2SO4-Graphite Intercalation Compound (GIC) Precursor on Parameters of Exfoliated Graphite (EG) for Oil Sorption from Water,” Carbon, Vol. 41, No. 10, 2003, pp. 2013-2016. doi:10.1016/S0008-6223(03)00200-8
- C. H. Yun, Y. H. Park and C. R. Park, “Effects of PreCarbonization on Porosity Development of Activated Carbons from Rice Straw,” Carbon, Vol. 39, No. 4, 2001, pp. 559-567. doi:10.1016/S0008-6223(00)00163-9
- B. G. Kim, S. K. Choi, H. S. Chung, J. J. Lee and F. Saito, “Grinding Characteristics of Crystalline Graphite in a Low-Pressure Attrition System,” Powder Technology, Vol. 126, No. 1, 2002, pp. 22-27. doi:10.1016/S0032-5910(02)00030-X
- T. Enoki, M. Suzuki and M. Endo, “Graphite Intercalation Compounds and Applications,” Oxford University Press, New York, 2003.
- H. Y. Zhang, H. Q. Wang and G. H. Chen, “A New Kind of Conducting Filler-Graphite Nanosheets,” Plastics, Vol. 35, No. 4, 2006, pp. 42-50.
- G. L. Sun, “Progress on Methods and Mechanics of Preparing Nano-Graphite and Application,” Development and Application of Materials, Vol. 26, No. 4, 2011, pp. 77-80.
- K. Chen and Y. Lin, “Degradation of Phenol by PAA- Immobilized Candida Tropocalis Enzyme Microb,” Technology, Vol. 31, 2002, pp. 490-497.
- Y. Kong, X. H. Chen, J. H. Ni, S. P. Yao, W. C. Wang, Z. Y. Luo and Z. D. Chen, “Palygorskite—Expanded Graphite Electrodes for Catalytic Electro-Oxidation of Phenol,” Applied Clay Science, Vol. 49, No. 1-2, 2010, pp. 64-68. doi:10.1016/j.clay.2010.04.003
- H. Wang and J. L. Wang, “Comparative Study on Electrochemical Degradation of 2,4-Dichlorophenol by Different Pd/C Gas-Diffusion Cathodes,” Applied Catalysis B: Environmental, Vol. 89, No. 1-2, 2009, pp. 111-117. doi:10.1016/j.apcatb.2008.12.003
- C. Comninellis, “Electrocatalysis in the Electrochemical Conversion/Combustion of Organic Pollutants for Waste Water Treatment,” Electrochimica Acta, Vol. 39, No. 11- 12, 1994, pp. 1857-1862. doi:10.1016/0013-4686(94)85175-1
- A. Alejandre, F. Medina, P. Salagre, A. Fabregat and J. E. Sueiras, “Characterization and Activity of Copper and Nickel Catalysts for the Oxidation of Phenol Aqueous Solutions,” Application Catalysis B: Environment, Vol. 18, No. 3-4, 1998, pp. 307-315.
- H. Wang and Z. Y. Bian, “Degradation Mechanism of Phenol with Electrogenerated Hydrogen Peroxide on a Pd/C Gas-Diffusion Electrode,” Enviromental Science, Vol. 31, No. 6, 2010, pp. 1506-1507.
- S. P. Faulkner Jr., W. H. Patrick and R. P. Gambrell, “Field Techniques for Measuring Wetland Soil Parameters,” Soil Science Society of America Journal, Vol. 53, No. 3, 1988, pp. 883-890. doi:10.2136/sssaj1989.03615995005300030042x
- American Water Works Association and Water Pollution Control Federation, “Standard Methods for the Examination of Water and Waste Water,” 19th Edition, American Public Health Association, Washington DC, 1995.
- J. M. Shen, J. Y. Li, Q. Chen, T. Luo, W. C. Yu and Y. T. Qian, “Synthesis of Multi-Shell Carbon Microspheres,” Carbon, Vol. 44, No. 1, 2006, pp. 190-193. doi:10.1016/j.carbon.2005.05.049
- A. Celzard, J. F. Mareche and G. Furdin, “Surface Area of Compressed Expanded Graphite,” Carbon, Vol. 40, No. 14, 2002, pp. 2713-2718.
- Y. Nishi, N. Iwashita and M. Inagaki, “Evaluation of Pore Struture of Exfoliated Gaphite by Mercury Porosimeter,” Tanso, Vol. 2002, No. 201, 2002, pp. 31-34. doi:10.7209/tanso.2002.31
- M. Inagaki and T. Suwa, “Pore Structure Analysis of Exfoliated Graphite Using Image Processing of Scaning Electron Micrographs,” Carbon, Vol. 39, No. 6, 2001, pp. 915-920. doi:10.1016/S0008-6223(00)00199-8
- A. C. Ferrari, J. C. Meyer, V. Scardaci, C. Casiraghi, M. Lazzeri, F. Mauri, S. Piscanec, D. Jiang, K. S. Novoselov, S. Roth and A. K. Geim, “Raman Spectrum of Graphene and Graphene Layers,” Physical Review Letters, Vol. 97, No. 18, 2006, Article ID: 187401. doi:10.1103/PhysRevLett.97.187401
- J. P. Tu, L. P. Zhu, K. Hou and S. Y. Guo, “Synthesis and Frictional Properties of Arry Film of Amorphous Carbon Nanofibers on Anodic Aluminum Oxide,” Carbon, Vol. 41, No. 6, 2003, pp. 1257-1263. doi:10.1016/S0008-6223(03)00047-2
- Y. Lu, Z. Zhu and Z. Y. Liu, “Carbon-Encapsulated Fe Nanoparticles from Detonation-Induced Pyrolysis of Ferrocene,” Carbon, Vol. 43, No. 2, 2005, pp. 369-374. doi:10.1016/j.carbon.2004.09.020
- F. Tuinstra and J. L. Koenig, “Raman Spectrum of Graphite,” The Journal of Chemical Physics, Vol. 53, No. 3, 1970, pp. 1126-1130. doi:10.1063/1.1674108
- Y. J. Feng, H. Y. Ding and W. J. Zhang, “Research on Electrocatalytic Properties of Rare Earth Doped Ti/SnO2- Sb Electrodes by CV and Tafel Curves,” Materials Science & Technology, Vol. 17, No. 2, 2009, pp. 278-284.
- X. J. Yu, H. Wang, L. Wu and D. Z. Sun, “Degradation of Phenol in the Electrolytic Cell with a Diaphragm by Electrocatalytic Oxidation,” Materials Science & Technology, Vol. 12, No. 3, 2004, pp. 303-306.
- J. M. Fang, R. C. Sun, D. Salisbury, P. Fowler and J. Tomkinson, “Comparative Study of Hemicelluloses from Wheat Straw by Alkali and Hydrogen Peroxide Extractions,” Polymer Degradation Stability, Vol. 66, No. 3, 1999, pp. 423-432. doi:10.1016/S0141-3910(99)00095-6
- H. Wang and J. L. Wang, “Electrochemical Degradation of 4-Chlorophenol Using a Novel Pd/C Gas-Diffusion Electrode,” Applied Catalysis B: Environmental, Vol. 77, No. 1-2, 2007, pp. 58-65. doi:10.1016/j.apcatb.2007.07.004