Theoretical Economics Letters
Vol.4 No.7(2014), Article
ID:48469,9
pages
DOI:10.4236/tel.2014.47065
Asymmetric Impact of Financial Integration to International Nonsynchronous Trading Effects in Developed and Emerging Equity Markets
KiHoon Jimmy Hong
University Technology of Sydne, Sydney, Australia
Email: hong.jimmy@gmail.com
Copyright © 2014 by author and Scientific Research Publishing Inc.
This work is licensed under the Creative Commons Attribution International License (CC BY).
http://creativecommons.org/licenses/by/4.0/


Received 12 May 2014; revised 16 June 2014; accepted 24 July 2014
ABSTRACT
This paper investigates the impact of the international equity market integration to the international nonsynchronous trading effects (INTE). The paper finds that the financial market integration would increase INTE, in general, and the impact monotonically decreases over the lag length. However empirical evidence suggests that the increase is asymmetric among developed and emerging markets. Further theoretical investigation reveals that the level of volatility and autocorrelation are positively related to the increase in INTE. The paper concludes that the relatively higher level of volatility and autocorrelation in emerging markets could mitigate the increase in INTE from financial market integration.
Keywords:Nonsynchronous Trading, Equity Market Integration, Price Autocorrelation

1. Introduction
This paper investigates the impact of financial equity market integration to international nonsynchronous trading effects (INTE). It should be emphasized that this paper looks into the cross market nonsynchronous trading. It is different from the nonsynchronous trading within one market, which most existing studies investigate. The paper employs a stochastic process to provide a theoretical framework. The contributions are clear: First it provides a theoretical framework to investigate the nonsynchronous trading effect. Second, it theoretically and empirically investigates the effect of equity market integration to INTE. And third, the paper provides price level evidence instead of return level evidence.
The paper finds the theoretical and empirical evidences that more integrated equity markets increases the INTE. However the empirical findings show that the increase is asymmetric between developed and emerging markets. Further investigation reveals that the higher volatility and autocorrelation in emerging equity markets mitigate the increase in INTE incurred by the equity market integration. The paper also finds that the size of the effect of equity market integration to nonsynchronous effects decreases over time.
It is well known that nonsynchronous trading causes auto correlation in equity price and return. There are plenty of literature that addresses problems of nonsynchronicity which can be thought of as the random, or deterministic, arrival of data within the interval of measurement and its consequences on the measurement of beta (See Atchison, Butler and Simonds, [1] and Dimson [2] ). More recent works include Barndorff-Nielsen et al. [3] and Fung, Liu and Tse [4] . Recent works tend to focus on the econometrics method of nonsynchronous trading problem.
A careful investigation of existing literature in nonsynchronous trading effects reveals that there are several potential aspects that could be further investigated. (1) The cross autocorrelation is much less explored compare to the autocorrelation within the index due to its complex nature. The latter induces autocorrelation mainly from thinly traded securities that have less liquidity while the first induces autocorrelation due to equity market operation time difference. This paper is interested in the cross market nonsynchronous trading effect and refers it to INTE. There could be two consequences of nonsynchronous trading to international equity market data. (2) Most of the existing literature investigate return series instead of price series. Although positive price autocorrelation means positive return autocorrelation in AR process, the direct effect of nonsynchronous trading is price autocorrelation. Return autocorrelation is a product of the price autocorrelation. This paper tackles the price autocorrelation.
(3) With more integrated world’s financial markets, such nonsynchronicity problem could be investigated in a different angle. Schotman and Zalewska [5] address the issue of nonsynchronous trading associated with financial market integration. They argue that controlling for time differences in trading hours of stock markets is important and show that time-adjustment improves estimates of market integration. This study shows that nonsynchronous trading effects may be affected by the degree of financial market integration. The current paper intends to expand the scope of Schotman and Zalewska [5] and investigate the relationship between the equity market integration and INTE.
The rest of the paper is organized as follows. Section 2 introduces the theoretical model. Section 3 empirically tests the two hypotheses. Section 4 reinvestigates the theoretical model to explain the discrepancy between developed and emerging markets. Section 5 concludes the paper.
2. The Model
In modeling shock emissions among international equity markets, there are some domestic shocks that are irrelevant to international markets. These shocks should be excluded from the analysis; hence the term “shock” in this paper refers to the shocks that have international influence only. For modeling purpose, I take a common practice in literature investigating international equity market volatility spill over (See Baele [6] and Bekaert and Harvey [7] ) and assume that there exists a common factor that is affected by all shocks immediately—if a shock occurs in country , the common factor is affected simultaneously, while the shock is only updated to the equity market of country
  when its market opens.
This paper employs a modified version of the model developed by Lo and Wang [8] . The basis for the model analyzed in this paper forms the bivariate Ornstein Uhlenbeck with some modifications permitting residuals of asset and market return to be correlated. This correlation may correspond to common factors, due to the indices’
dependence on factors. Assume that the logarithm of the index levels  and
and  have linear trends
  and
and  respectively. We consider the de-trended log price process,
 (1)
(1)
Assume that  satisfies the following pair of stochastic differential equations,
 (2)
(2)
 (3)
(3)
where  stands for price, subscript
  indicates that the parameter is for country
 , subscript
  indicates that the parameter is for the common factor and
  and
and ![]() are the parameters of the OU process with the obvious use of subscripts. Furthermore, we assume
are the parameters of the OU process with the obvious use of subscripts. Furthermore, we assume , and
, and  denotes a Wiener process.
  and
and 
are correlated standardized Wiener processes with correlation coefficient![]() , i.e.
, i.e. .
.
Therefore ![]() can be seen as the degree of equity market
can be seen as the degree of equity market ’s integration with the common factor. It could be also seen as the underlying systemic risks of the market
  with respect to the common factor, over and above the “market model” term given by
 . For most international equity markets,
 ![]() is expected to be positive.
is expected to be positive.
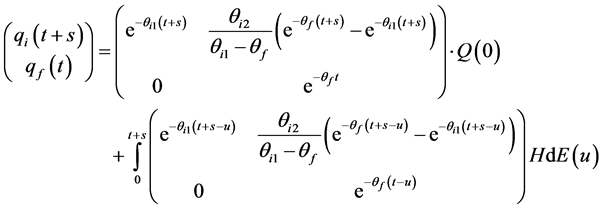
According to Hong and Satchell [9] , the solution can be written as
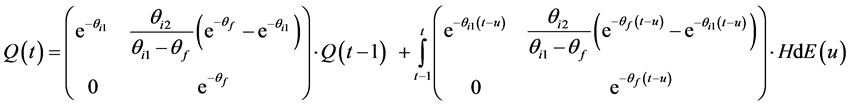 (4)
(4)
where  and
and 
All results are conditional on time zero information.
Remark 1: The conditional covariance of index price and factor price can be written as
 (5)
(5)
See Appendix A of Lo and Wang [8] for the proof for Remark 1.
Remark 2: The conditional  -period autocovariance of index return and factor return can be written as
 (6)
(6)
A proof of Remark 2 is in the Appendix. Equation (6) is the amount of autocovariance induced from nonsynchronous trading.
The system of Equations (2) and (3) represents the one factor model that the demeaned log price of index  is influence by the demeaned log price of the factor. Beta of this one factor model measures the responsiveness of the index
  price to the factor price. Since we are interested in lagged relationship, the beta is computed with lagged time series,
  and
and , and will be denoted as
 . I refer
  as auto-beta because it captures the beta-type relationship of a one factor model between lagged terms, like autocorrelation. The difference between
  and autocorrelation is that the former captures the lagged relationship of two different prices while the latter captures the lagged relationship within one price. Although the notation beta is used to indicate this is a measure of responsiveness, current model is very different from the CAPM in many aspects. Current model should be considered as price one factor model.
Proposition 1: The nonsynchronous trading effect,  , can be written as
 (7)
(7)
Proposition 1 is an immediate result of Remark 2, dividing the both sides by the variance.
Proposition 2: The impact of equity market integration to nonsynchronous trading effects can be expressed as
 (8)
(8)
Proposition 2 is a partial derivative of Proposition 1 with respect to kappa. This measure becomes positive as long  and
and  have the same sign. This condition indicates that both index and factor prices revert back to mean or both do not revert back to mean. It would be reasonable to assume that this is true since de-trended equity indices are known to be mean-reverting. When both the index and the factor prices exhibit mean-reverting feature, Equation (8) is positive.
Proposition 2 implies that more integrated international financial equity markets increases the level of INTE. Intuitively, this is because more integrated financial markets allow shocks from one market to be transferred more widely to other markets.
Proposition 3: The sensitivity of  with respect to financial integration and lag time period can be written as
 (9)
(9)
Proposition 3 is a partial derivative of Proposition 2 with respect to s. Given  and
and  have the same sign, Equation (9) becomes negative if
  is positive and becomes positive if
  is negative. Since it is more likely that the de-trended index equity price series to be mean-reverting, hence
 , Equation (9) is likely to be negative. This indicates that the size of the INTE monotonically decreases over time. This should intuitively make sense.
From the theoretical finding of Proposition 2 and 3, two hypotheses could be drawn.
H1: The more integrated financial market equity market increases the INTE.
H2: INTE monotonically decreases with respect to time.
In next section, the two hypotheses are empirically tested.
3. Empirical Test
3.1. Data and Measures
In the empirical investigation of INTE, daily data is more suitable than weekly or monthly data. Schotman and Zalewska [5] find that using weekly frequency does not sidestep the consequences of the time-match problem but leads to significant loss of information. Hence this paper uses the daily data of 11 international financial equity markets from the first quarter of 1998 to the first quarter of 2013. Nonsynchronous trading is not the only source of price autocorrelation. Table 1 presents the list of international financial equity markets in the sample.
Intervalling effect (Dimson [2] ) and overlapping data (Hansen and Hodrick [10] ) could also induce the autocorrelation. These are closely related but different issues to nonsynchronous trading effects. This paper uses non-overlapping data with daily measurement interval to overcome these problems. Therefore cross autocorrelation between an index and the factor could be interpreted as the INTE. This paper takes this approach of Baele [6] and have S&P 500 index as the common factor and investigate the relationship of other indices to the factor. Hence there would be 10relationships with S&P 500 to be captured in the current sample.
Two measures are computed according to the theoretical section:  as a measure of INTE and Pearson correlation as a measure of equity market integration. Existing papers in international equity market integration often use simple Pearson correlation in measuring the degree of equity market integration. Moreover, Hong and Satchell [9] showed that price correlation is closely related to the
 ![]() of the bivariate OU process model. Therefore, this paper follows the existing literature and use index price correlation with S&P 500 in measuring how equity markets are integrated and denote the correlation of index
of the bivariate OU process model. Therefore, this paper follows the existing literature and use index price correlation with S&P 500 in measuring how equity markets are integrated and denote the correlation of index  as
as . Table 2 shows the descriptive statistics of index price correlation with respect to S&P 500 over the sample period.
Since quarterly non-overlapping price correlations of most liquid stock indices using daily frequency, the data is less likely to suffer from autocorrelation induced by overlapping data and intervalling effect. The autocorrelation and cross autocorrelation observed in the sample data would be mostly due to INTE between equity markets. We see that Canadian the European stock markets move more closely with the US stock market compare to those of East Asian countries. This conforms to the general expectation. All correlation distributions are negatively skewed and this indicates that relatively high level of correlations are more likely compare to relatively low level of correlations. This is also consistent with the findings of the previous studies.
 is computed up to the order of 5 and aggregated additively. The lag of 5 business days is chosen based

Table 1 . List of sample international equity markets. The table below presents the list of 11 sample international equity markets used in this paper. Country is the country that the index belongs to, Index is the name of the index and Notation is the notation for the index that this paper refer to.
Table 2. Descriptive statistics of historical correlations. The table below presents the mean, standard deviation, skewness and kurtosis of the historical quarterly non-overlapping correlations between 10 international indices and S&P 500. The sample used in this analysis consists of 10 international equity indices from Q1 of 1998 to Q1 of 2013.
on the results that the nonsynchronous trading problem could be resolved by using weekly data instead of daily data. The sum of squared auto-betas,  , is used as the degree of INTE. This measure is equivalent to Ljung-Box Q statistic using lagged betas instead of autocorrelations.
3.2. Empirical Result: H1
In order to test the first hypothesis that “The more integrated financial market equity market increases the INTE”, Following regression for each index is ran.
 (10)
(10)
where  {S&P/TSX, DAX, FTSE100, CAC40, AEX, NIKKE, HANSENG, KOSPI, ASX, IBOVESPA}. Equation (10) explains the five-day aggregated auto-betas using equity market cross correlation. Table 3 presents the result.
Table 3. Regression result of Equation (10). The table below presents the regression result of Equation (10) for the 10 sample international equity indices. R Square is the  of the regression equation,
 ![]() and
and  are the regression coefficients. p-values are shown in parentheses. ***, **, * indicate statistical significance at the 1%, 5%, and 10% levels, respectively. The sample used in this analysis consists of 10 international equity indices from Q1 of 1998 to Q1 of 2013.
First we note that all but one constant term, ![]() , are not statistically significant at 5% confidence level. This indicates that if equity markets are not integrated at all, there would be no statistically significant INTE. This intuitively makes sense in that if all equity markets move independently, nonsynchronous trading hour should not matter.
, are not statistically significant at 5% confidence level. This indicates that if equity markets are not integrated at all, there would be no statistically significant INTE. This intuitively makes sense in that if all equity markets move independently, nonsynchronous trading hour should not matter.  of HANGSENG, KOSPI and IBOVESPA are not statistically significant at 1% confidence level. The
  of the rest of the sample indices are statistically significant at 1% confidence level. All
  are positive. This indicates that the degree of equity market is likely to have meaningful impact on INTE. More integrated financial equity markets empirically show larger INTE.
It is interesting to see that the emerging markets, China, Korea and Brazil, do not have significant . This implies that even if the equity markets of these countries are more integrated with the US equity market, the INTE do not increase. It is interesting to see that only equity markets of emerging economies suffer less from the increase in INTE due to financial integration. The contribution of equity market integrity to INTE should be captured by the
  of the regression equation.
  of the developed markets are higher than those of emerging markets. The numerical size of the parameters is less meaningful since the interpretation of the squared beta is not clear. The sign and the statistical significance are the important information. The overall empirical investigation supports the theoretical finding of Proposition 2 for developed countries while not for emerging economies. This will be further investigated in Section 4.
3.3. Empirical Result: H2
The second hypothesis states that the INTE monotonically decreases with respect to time, hence predicts monotonically decreasing  with respect to s. For the five auto-betas, probability dictates that this should occur 6.25% of the times. Table 4 presents the number of monotonically decreasing quarterly auto-betas for all five lag periods.
Note that there are total 61 quarters during the sample period. The result of the formal test is reported in Table5
Observed Mean and SD are the parameters for the number of the observed monotonic relationships. Random Mean and SD are the parameters when the size of  takes random value. The empirical result tells us that the percentage of the monotonically decreasing relationships should be statistically different from 6.25%. Hence we do not have enough empirical evidence to reject the second hypothesis. This implies that for the given sample, we may conclude that INTE monotonically decreases with respect to the length of the time lag. And the monotonicity is presented consistently in both emerging and developed economies.
Table 4. Monotonically decreasing sample relationships. The table below presents the number of monotonically decreasing sample betas for all 5 lagging periods and its percentage with respect to the total sample period of 61 quarters.  indicates the case when all the five betas are monotonically decreasing with respect the number of lag period. % of Monotonic Relationships is the portion of quarters that showed the monotonic relationship out of total 61 quarters. The sample used in this analysis consists of 10 international equity indices from Q1 of 1998 to Q1 of 2013.
Table 5. Test of the monotonicity. The table below presents the result of testing the statistical significance of the number of quarters that all five betas showed monotonic relationship. Observed Mean is the actual percentage of monotonic relationships, Observed SD is the standard deviation of the distribution of the actual monotonic relationships, Random Mean is the percentage of monotonic relationships if betas follow random order and Random SD is the standard deviation of the distribution of the monotonic relationships if betas follow random order. The sample used in this analysis consists of 10 international equity indices from Q1 of 1998 to Q1 of 2013.
4. Developed vs. Emerging Economies: Theoretical Model Revisited
Sections 2 and 3 of this paper investigate the sensitivity of the most recent five day factor price with respect to the current index and factor price correlation. The theoretical findings using a bivariate OU process model predict a positive significant relationship between the degree of equity market integration and INTE in international equity markets. However the empirical evidences show that the more integrated equity market increases INTE in developed economies but it does not have significant effect to emerging economies. In order to resolve the discrepancy, we need to take advantage of using a theoretical model and analyze exactly what induces the sensitivity of INTE with respect to the equity market integrity.
Although they are not statistically significant, we still observe positive estimated parameters. This indicates that noise in the data could hide the relationship to be empirically observed. This could be the reason why the empirical result for developing countries is not consistent with the theoretical outcome. One potential explanation could be that developed markets have parameters that make empirical  positive and significant while emerging markets do not. Hence we are interested in which values of country specific parameters,
  and
and , make Equation (10) large and positive.
Proposition 4: The sensitivity of  with respect to country specific parameters,
  and
and , can be written as
 (11)
(11)
 (12)
(12)
We can see that the larger  and smaller
  increases
 . An equity market with lager
  indicates that the equity market has higher volatility. The smaller
  indicates the larger price autocorrelation, hence less information efficient market. This is consistent with the empirical findings. Emerging markets tend to have higher volatility and larger price autocorrelation in their domestic equity markets.
While financial market integration worsens the problem of nonsynchronous trading among the international equity markets in general, emerging markets suffer less from it compared to developed markets. The paper finds that this is due to emerging markets’ higher level of volatility and higher price autocorrelation compared to those of developed markets. These could be indicators of less information efficient market. Ironically speaking, less efficient equity markets of emerging countries mitigate the increase in INTE from more integrated financial equity markets.
5. Conclusion
This paper builds a theoretical model, using a bivariate Ornstein Uhlenbeck process, to investigate the impact of the international equity market integration to INTE. The paper finds that the financial market integration would increase the effect, in general, and the impact monotonically decreases over the lag length. However the paper empirically finds that the increase is asymmetric between developed and emerging markets. Further theoretical investigation reveals that the level of volatility and autocorrelation in equity market are positively related to the increase in INTE due to financial market integration. The paper finds that relatively higher level of equity index volatility and autocorrelation in emerging markets could mitigate the increase in INTE from financial market integration.
References
- Atchison, M.D., Butler, K.C. and Simonds, R.R. (1987) Nonsynchronos Security Trading and Market Index Autocorrelation. The Journal of Finance, 42, 111-118. http://dx.doi.org/10.1111/j.1540-6261.1987.tb02553.x
- Dimson, E. (1979) Risk Measurement When Shares Are Subject to Infrequent Trading. Journal of Financial Economics, 7, 197-226. http://dx.doi.org/10.1016/0304-405X(79)90013-8
- Barndorff-Nielsen, O.E., Hansen, P.R., Lunde, A. and Shephard, N. (2011) Multivariate Realised Kernels: Consistent Positive Semi-Definite Estimators of the Covariation of Equity Prices with Noise and Nonsynchronous Trading. Journal of Econometrics, 162, 149-169.
http://dx.doi.org/10.1016/j.jeconom.2010.07.009 - Fung, H.G., Liu, Q. and Tse, Y. (2010) The Information flow and Market Efficiency between the US and Chinese Aluminum and Copper Futures Markets. Journal of Futures Markets, 30, 1192-1209.
http://dx.doi.org/10.1002/fut.20474 - Schotman, P.C. and Zalewska, A. (2006) Non-Synchronous Trading and Testing for Market Integration in Central European Emerging Markets. Journal of Empirical Finance, 13, 462-494. http://dx.doi.org/10.1016/j.jempfin.2006.04.002
- Baele, L. (2005) Volatility Spillover Effects in European Equity Markets. Journal of Financial and Quantitative Analysis, 40, 373-401. http://dx.doi.org/10.1017/S0022109000002350
- Bekaert, G. and Harvey, C.R. (1997) Emerging Equity Market Volatility. Journal of Financial Economics, 43, 29-77. http://dx.doi.org/10.1016/S0304-405X(96)00889-6
- Lo, A.W. and Wang, J. (1995) Implementing Option Pricing Models When Asset Returns Are Predictable. Journal of Finance, American Finance Association, 50, 87-129.
- Hong, K. and Satchell, S. (2014) The Sensitivity of Beta to the Time Horizon When Log Prices Follow an Ornstein-Uhlenbeck Process. European Journal of Finance, 20, 264-290.
http://dx.doi.org/10.1080/1351847X.2012.698992 - Hansen, L.P. and Hodrick, R.J. (1980) Forward Exchange Rates as Optimal Predictors of Future Spot Rates: An Econometric Analysis. Journal of Political Economy, 88, 829-853.
http://dx.doi.org/10.1086/260910
Appendix
Let  and K: Covariance Matrix of


Using that  is only defined for
 ,
,